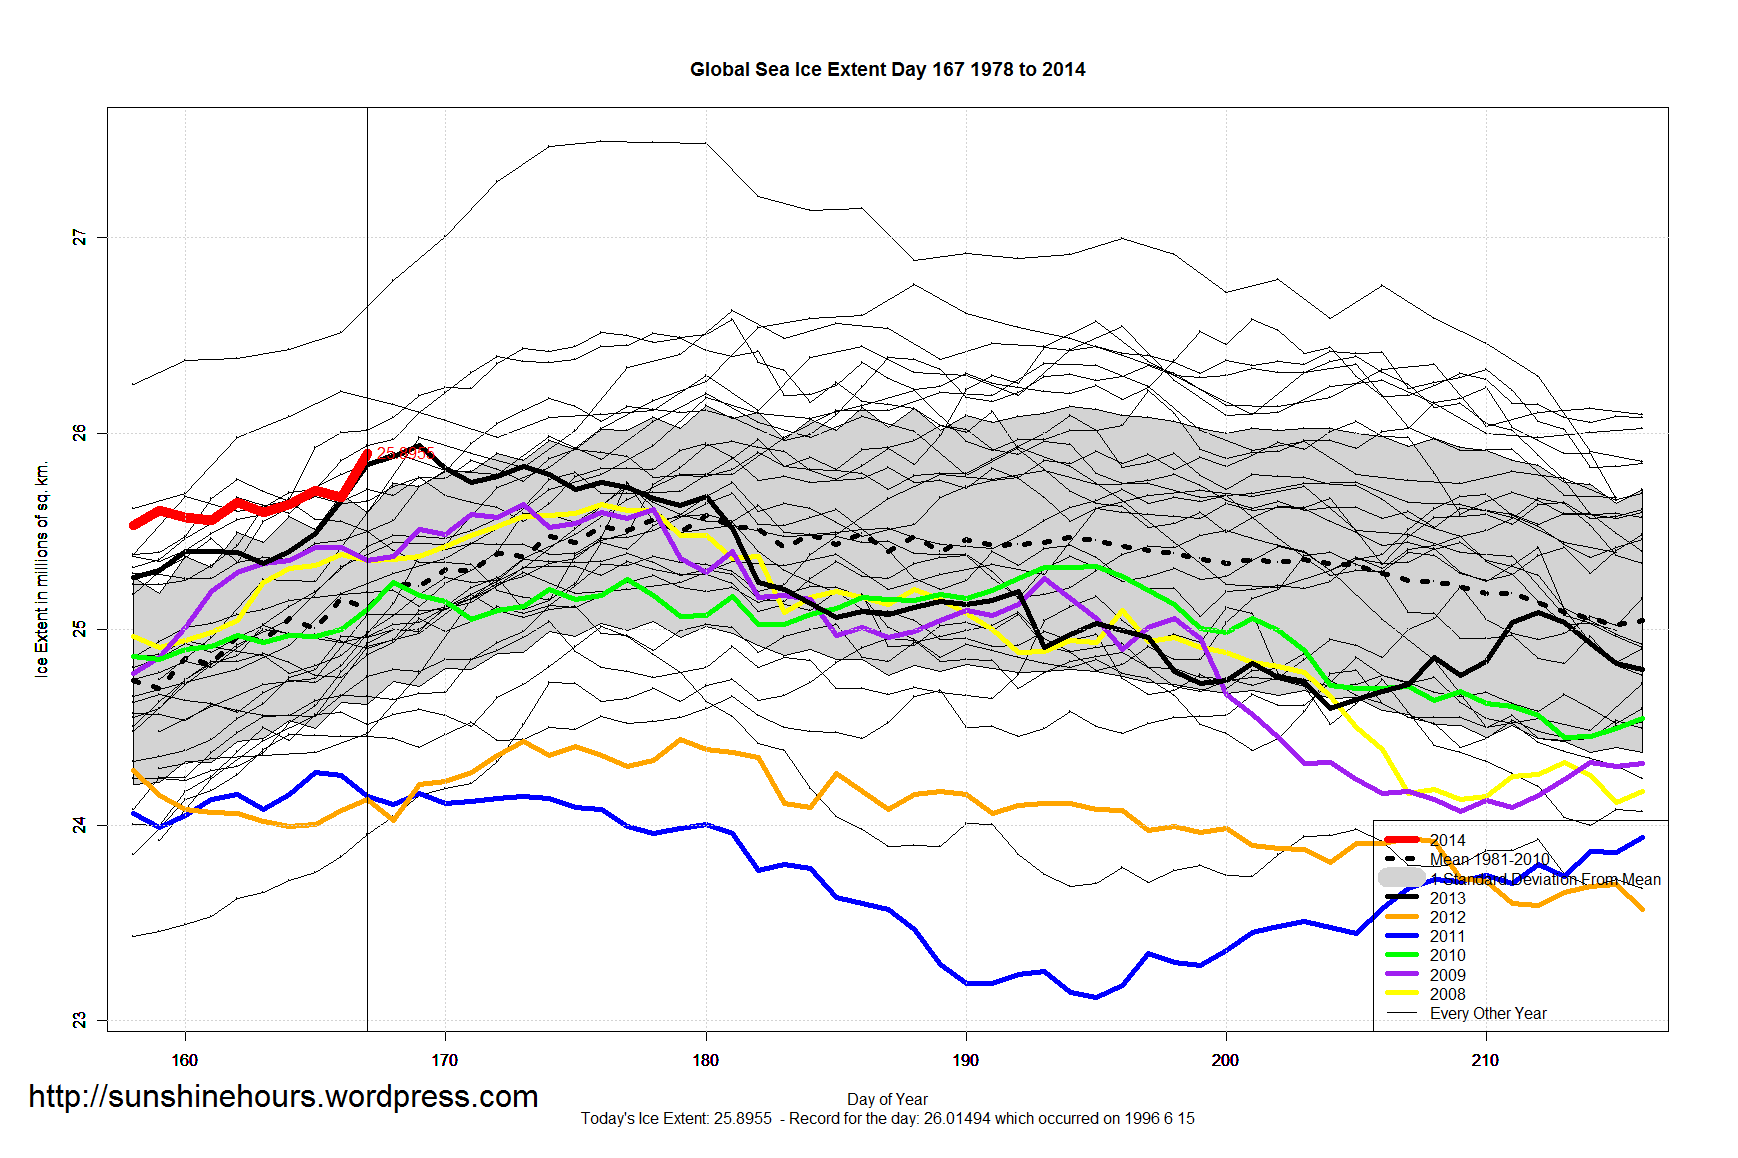
Only 3 years had more global sea ice on day 168 – 1979,1982 and 1996
.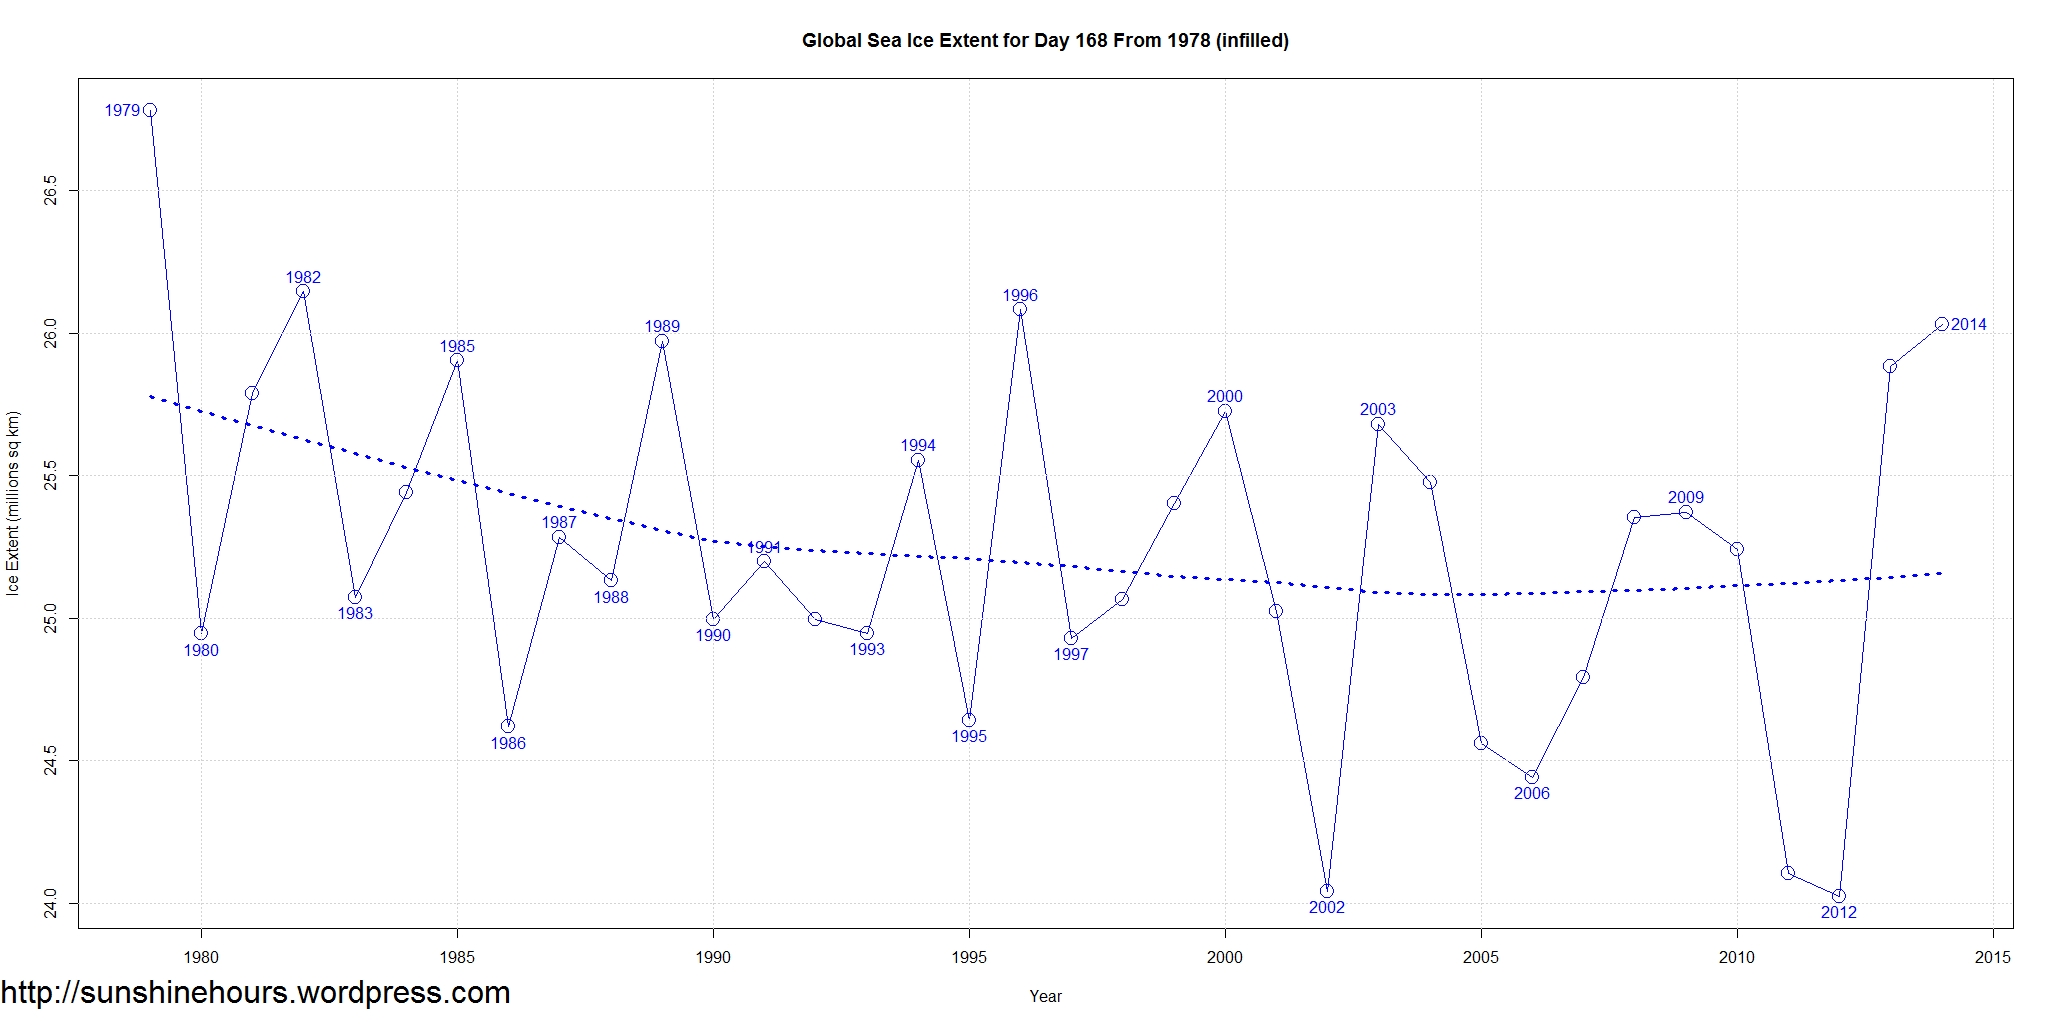
Only 3 years had more global sea ice on day 168 – 1979,1982 and 1996
.
June 17 2014 MASIE Update – According to MASIE Arctic Sea Ice is up 28,401 over the last 3 days
7 regions have a net gain for last 3 days. Greenland Sea is the big gainer.
| Region | Start | End | Last 79 | Last 28 | Last 14 | Last 7 | Last 3 | Last 1 |
| Baffin Bay Gulf of St. Lawrence | 1,688,530 | 872,963 | -815,568 | -342,840 | -172,753 | -51,216 | -28,850 | 5,785 |
| Hudson Bay | 1,260,903 | 1,140,749 | -120,154 | -90,558 | -80,991 | -47,516 | -32,539 | 7,709 |
| Bering Sea | 697,324 | 52,799 | -644,525 | -92,626 | -50,482 | -41,676 | -16,162 | 0 |
| Chukchi Sea | 966,006 | 846,814 | -119,192 | -67,648 | -37,922 | -18,060 | 16,608 | 0 |
| Kara Sea | 933,859 | 840,006 | -93,854 | -76,631 | -34,108 | -13,967 | 1,559 | 0 |
| Sea of Okhotsk | 853,240 | 16,272 | -836,967 | -77,483 | -32,293 | -9,492 | -3,419 | -5,020 |
| East Siberian Sea | 1,087,137 | 1,005,353 | -81,784 | -23,042 | -25,952 | -8,627 | -1,563 | 0 |
| Canadian Archipelago | 853,214 | 785,240 | -67,974 | -48,285 | -22,230 | -7,658 | 1,926 | 3,421 |
| Baltic Sea | 15,337 | 0 | -15,337 | 0 | 0 | 0 | 0 | 0 |
| Yellow Sea | 0 | 0 | 0 | 0 | 0 | 0 | 0 | 0 |
| Barents Sea | 645,917 | 275,816 | -370,101 | -230,008 | -101,902 | 171 | 11,868 | 0 |
| Central Arctic | 3,221,921 | 3,243,659 | 21,738 | -3,161 | 3,853 | 1,703 | -39 | 0 |
| Beaufort Sea | 1,070,445 | 1,039,609 | -30,836 | -12,967 | -16,747 | 5,347 | 8,047 | 9,199 |
| Laptev Sea | 897,845 | 704,210 | -193,634 | -181,040 | -39,909 | 18,180 | 13,055 | 0 |
| Greenland Sea | 603,416 | 680,576 | 77,161 | -31,751 | 58,656 | 46,977 | 57,910 | 12,906 |
| Northern Hemisphere (Total) | 14,805,115 | 11,505,595 | -3,299,520 | -1,277,718 | -552,395 | -125,448 | 28,401 | 33,999 |
| NH (Average Loss per Day) | -41,244 | -45,633 | -39,457 | -17,921 | 9,467 | 33,999 |
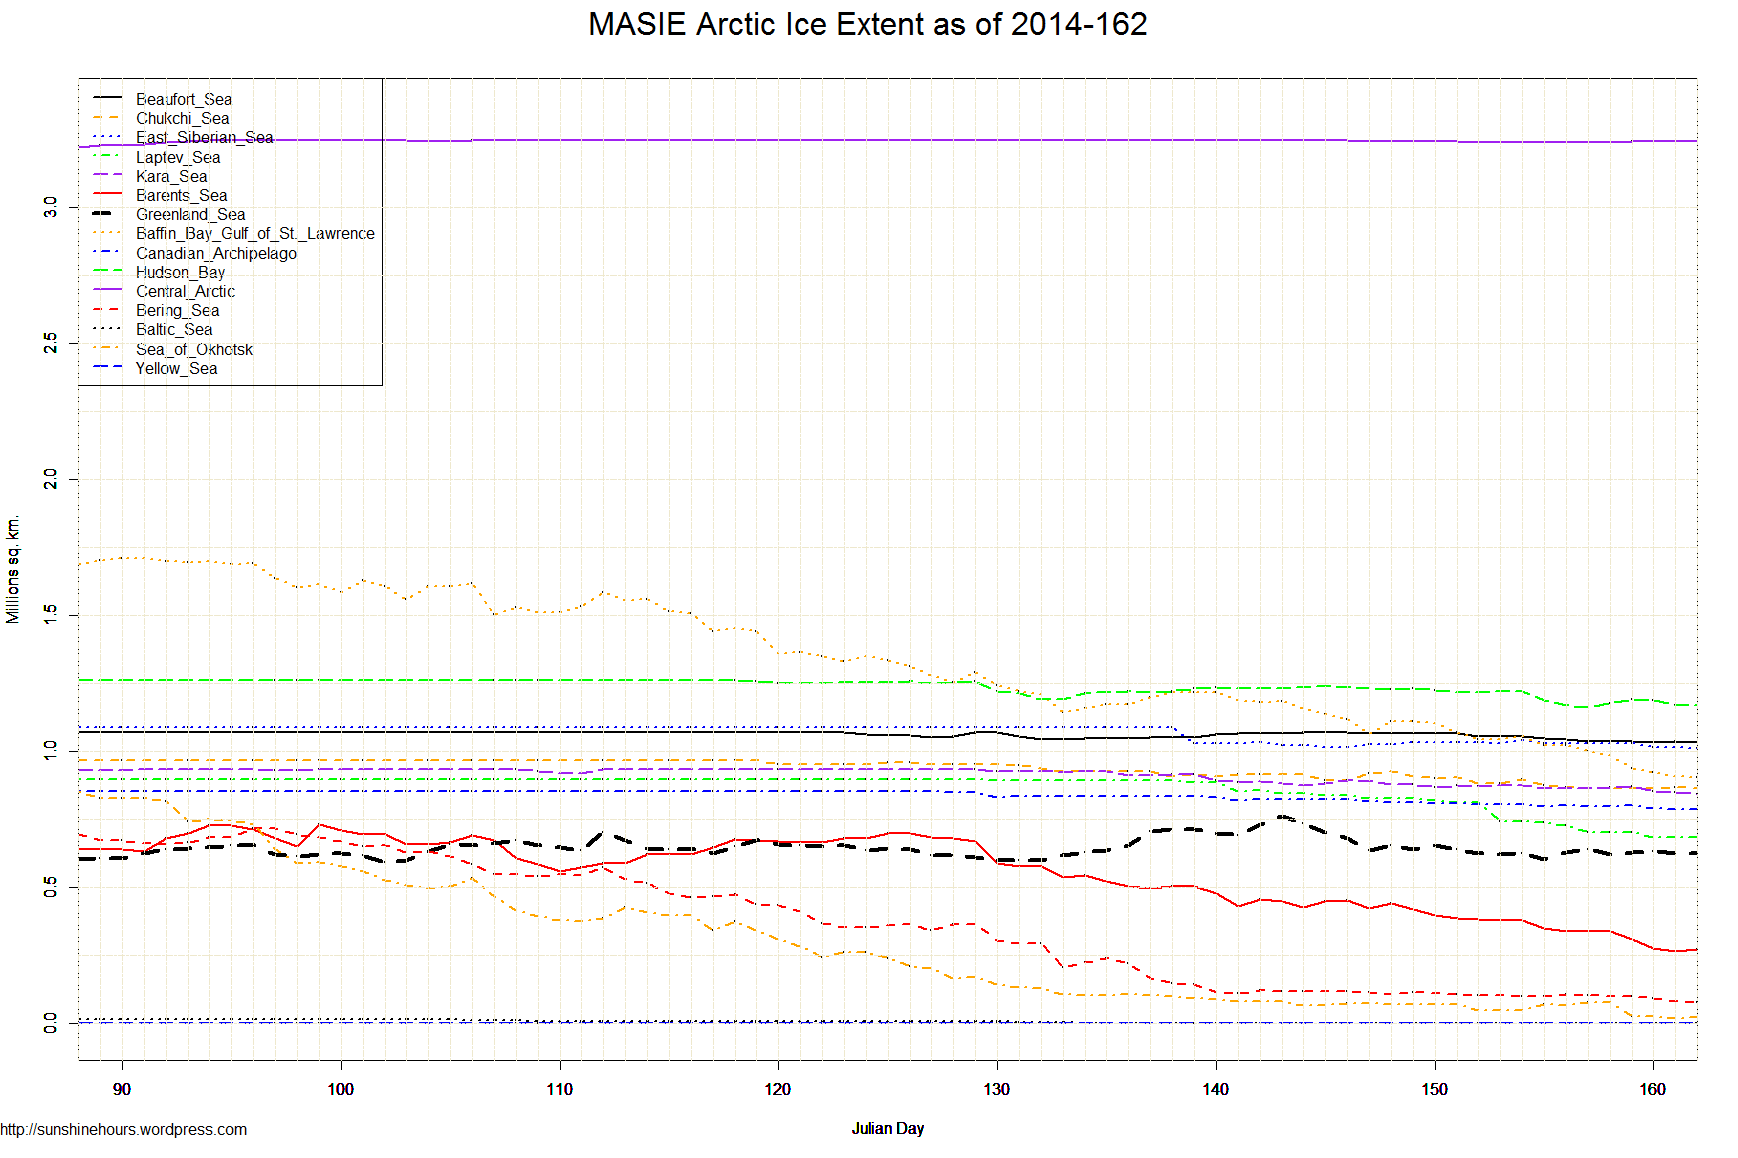
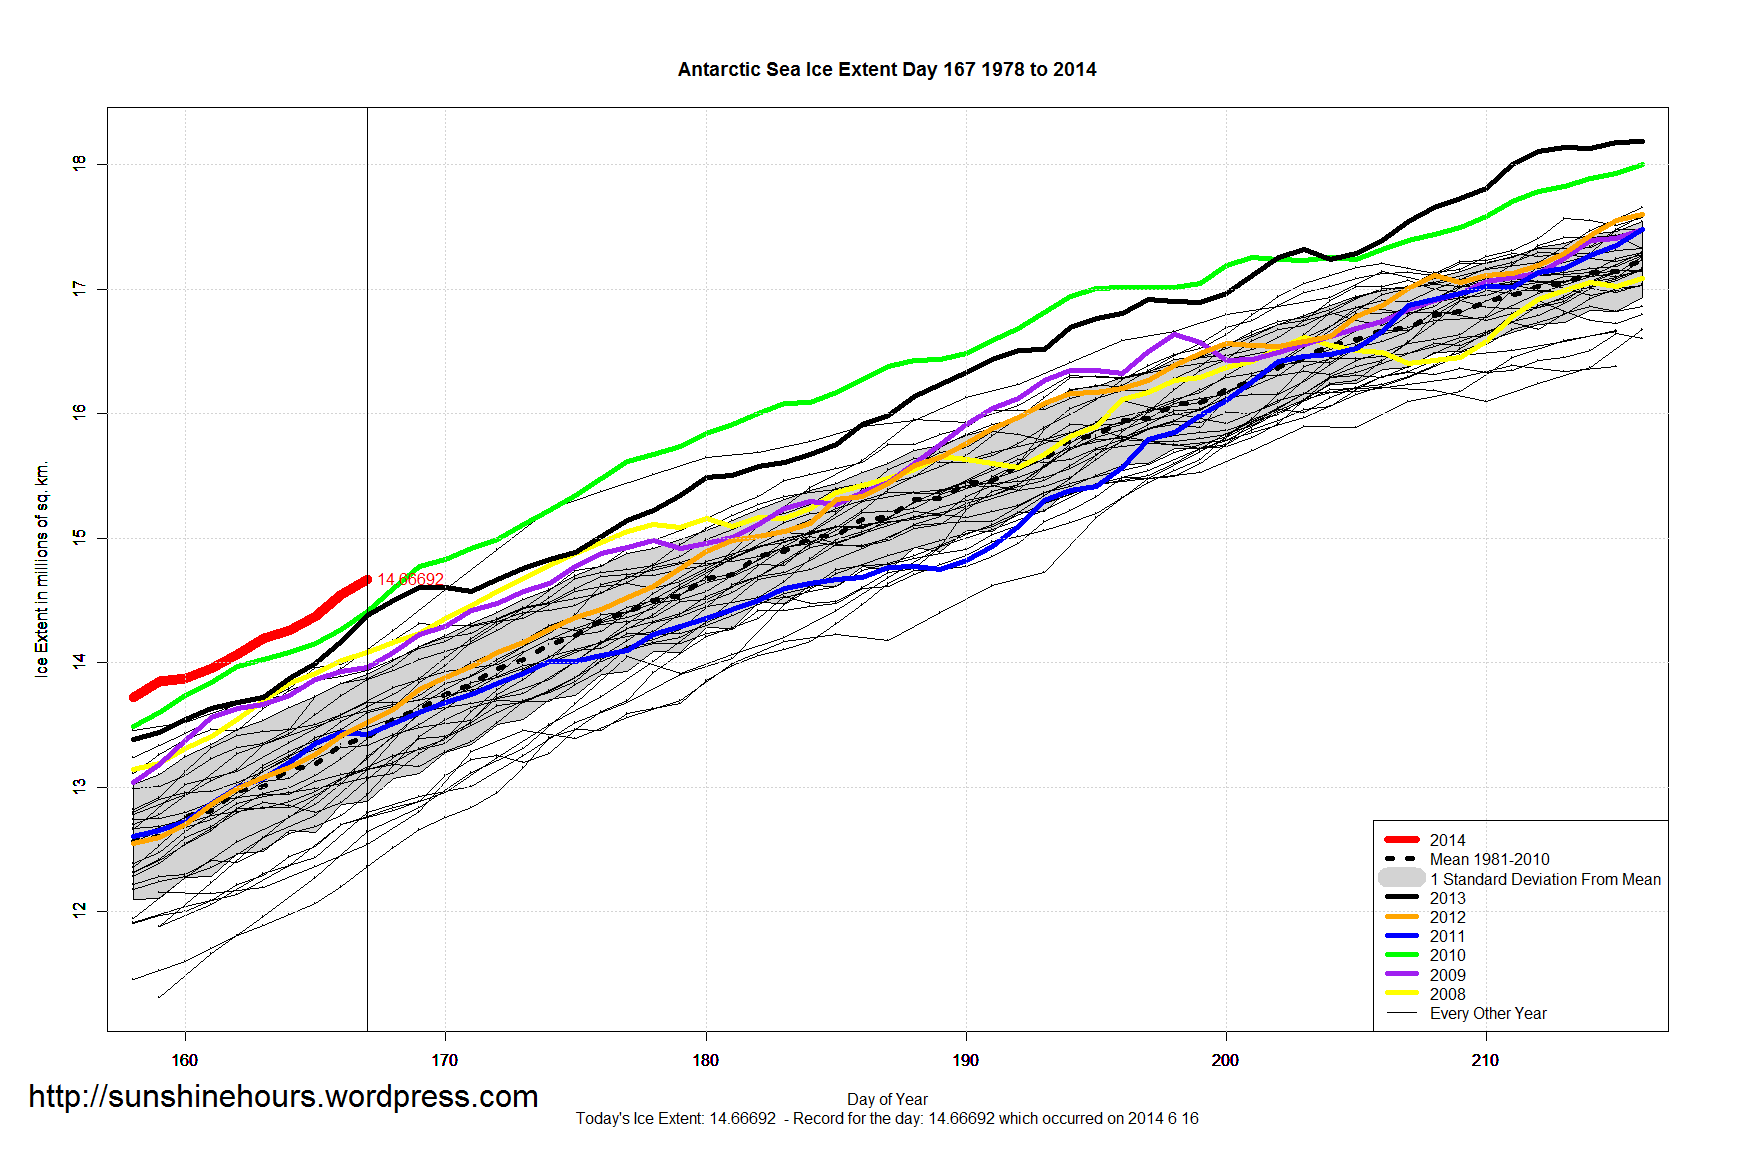
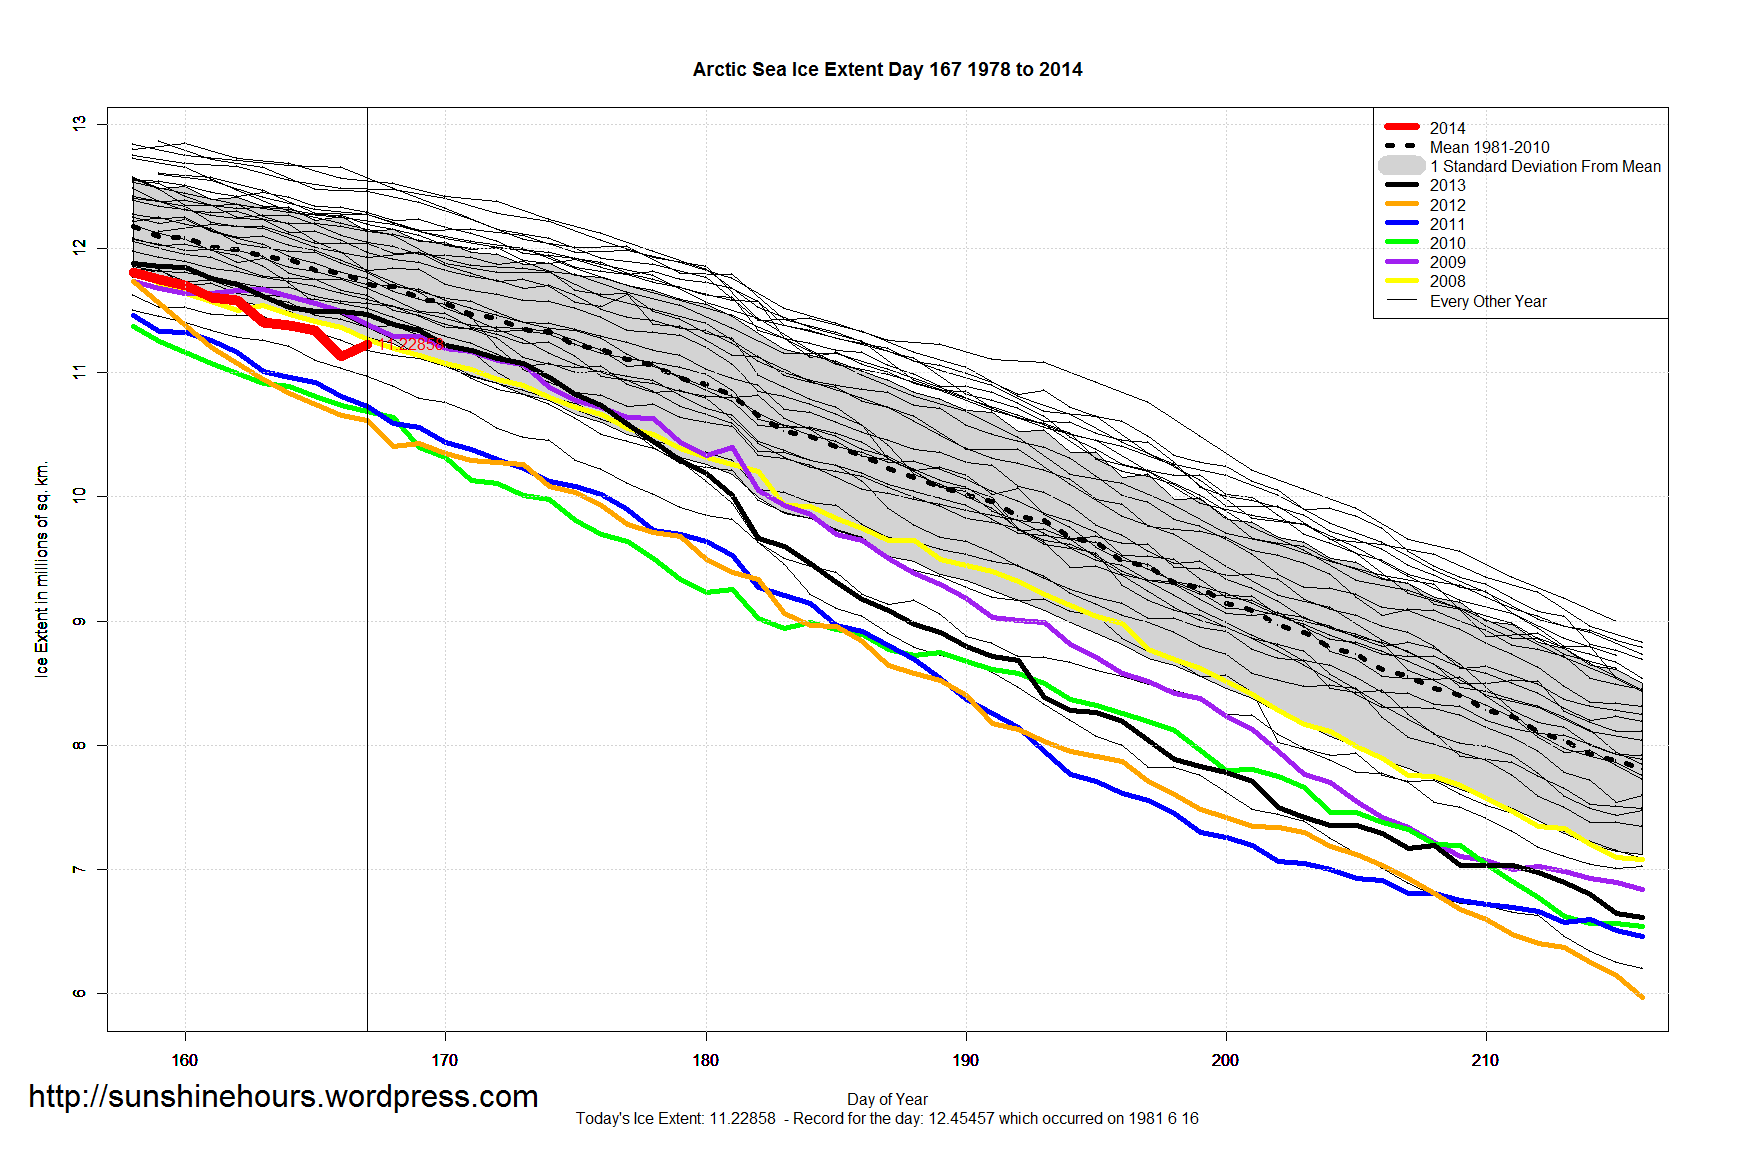
A quick update for sea ice extent for day 167 of 2014
NOAA Data here and here here. Graphs below. Click for bigger.
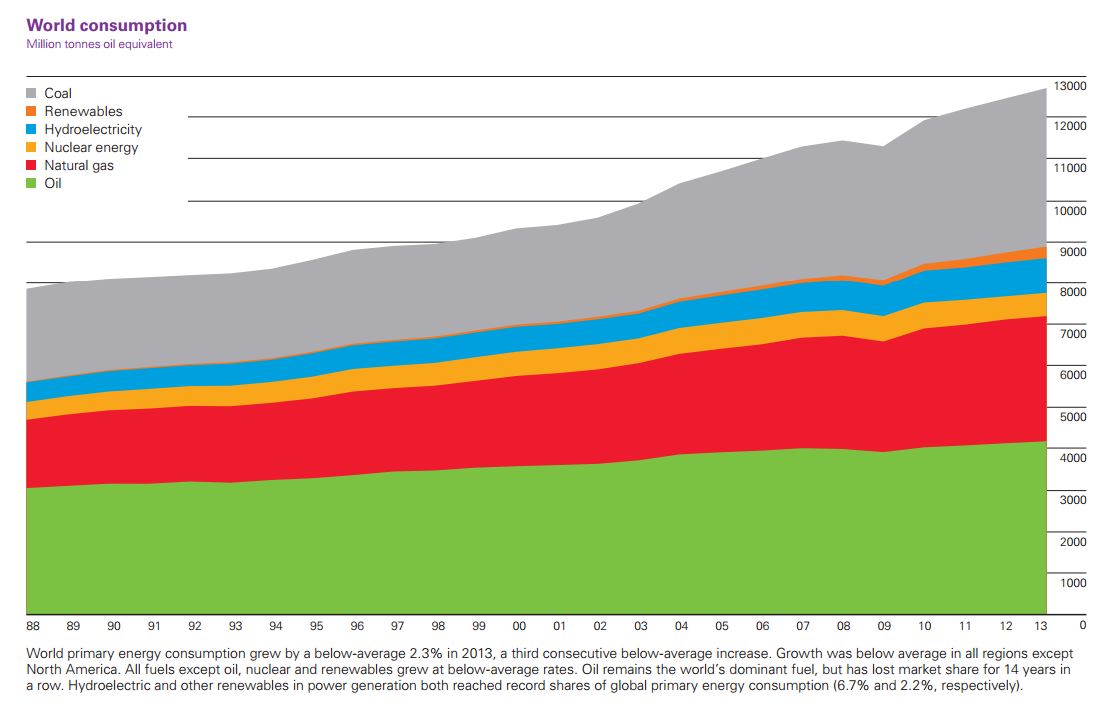
BP does an annual review of world energy consumption, production and reserves. It is well worth a look here.
In 2013 China+HK were responsible for 50.5% of world coal consumption. The US consumed 11.9%.
China and India accounted for 88% of global growth in consumption.
This chart is All Energy consumption in MTOE.
A new “study” is out.
“Britain will have fewer days of ‘extreme cold’ and will enjoy milder winters as a direct result of climate change, according to a new study.
The new research is set to cool growing fears that the Northern Hemisphere could be gripped by more severe winters throughout the next century due to the Arctic warming up.”
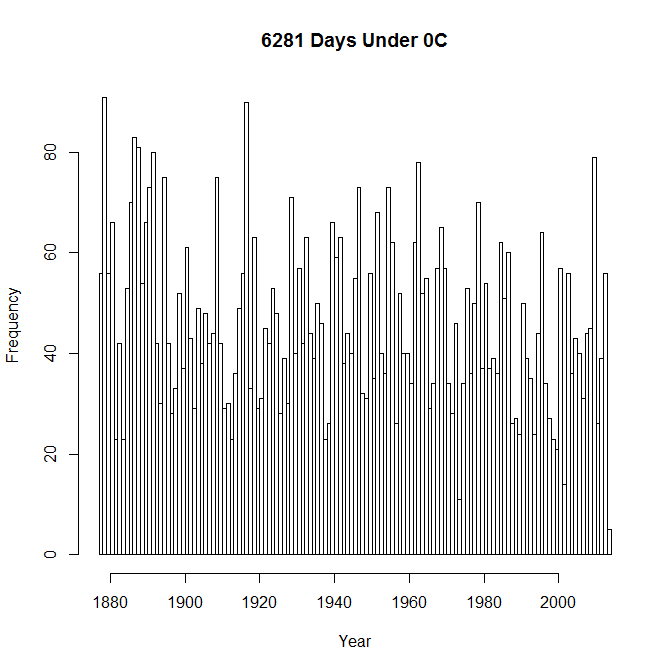
In these cases I like to turn to HADCET Daily Minimum data which is available from 1878 on. And I thought I would look at the number of days that the minimum was lower or equal to 0C for each year.
Wow. 2010 had the 6th highest number of days that were 0C or colder. So much for “Global Warming”.
| Year | Days | Longest Coldwave |
| 1879 | 91 | 18 |
| 1917 | 90 | 28 |
| 1887 | 83 | 11 |
| 1888 | 81 | 23 |
| 1892 | 80 | 14 |
| 2010 | 79 | 16 |
| 1963 | 78 | 27 |
| 1895 | 75 | 32 |
| 1909 | 75 | 23 |
| 1891 | 73 | 13 |
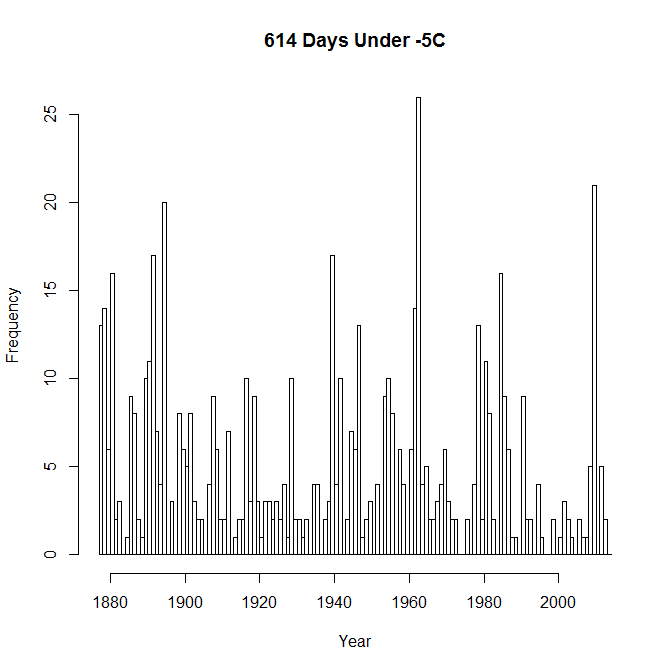
What about equal to or less than -5C? Wow! 2010 was 2nd highest with 21 days.
| Year | Days | Longest Coldwave |
| 1963 | 26 | 5 |
| 2010 | 21 | 5 |
| 1895 | 20 | 11 |
| 1892 | 17 | 7 |
| 1940 | 17 | 14 |
| 1881 | 16 | 8 |
| 1985 | 16 | 6 |
| 1879 | 14 | 7 |
| 1962 | 14 | 3 |
| 1878 | 13 | 6 |
June 15 2014 MASIE Update – Laptev Sea and Greenland Sea and Central Arctic are the three gainers over the last week.
Thanks to those small gains, the melt has slowed down just a little to -32,825 per day over last 3 days. The average for the last 28 days is -50,272 per day.
| Region | Start | End | Last77 | Last28 | Last14 | Last7 | Last3 | Last1 |
| Baffin Bay Gulf of St. Lawrence | 1,688,530 | 874,825 | -813,705 | -324,970 | -194,710 | -110,946 | -29,215 | -26,987 |
| Barents Sea | 645,917 | 259,620 | -386,297 | -236,053 | -127,835 | -78,608 | -11,819 | -4,328 |
| Sea of Okhotsk | 853,240 | 17,969 | -835,271 | -86,198 | -54,150 | -59,825 | -4,073 | -1,722 |
| Bering Sea | 697,324 | 60,292 | -637,031 | -106,752 | -47,382 | -39,056 | -16,737 | -8,669 |
| Kara Sea | 933,859 | 836,428 | -97,432 | -76,848 | -40,492 | -33,265 | -4,510 | -2,019 |
| Chukchi Sea | 966,006 | 831,093 | -134,913 | -97,599 | -75,415 | -31,760 | -33,534 | 888 |
| East Siberian Sea | 1,087,137 | 1,007,598 | -79,539 | -79,539 | -27,456 | -23,661 | -4,937 | 681 |
| Hudson Bay | 1,260,903 | 1,155,003 | -105,901 | -62,511 | -63,651 | -22,434 | -15,144 | -18,286 |
| Canadian Archipelago | 853,214 | 782,534 | -70,680 | -50,991 | -27,199 | -17,379 | -4,122 | -780 |
| Beaufort Sea | 1,070,445 | 1,031,227 | -39,218 | -21,800 | -33,859 | -6,667 | -3,942 | -335 |
| Baltic Sea | 15,337 | 0 | -15,337 | 0 | 0 | 0 | 0 | 0 |
| Yellow Sea | 0 | 0 | 0 | 0 | 0 | 0 | 0 | 0 |
| Laptev Sea | 897,845 | 707,490 | -190,354 | -185,852 | -105,157 | 3,075 | 22,277 | 16,335 |
| Central Arctic | 3,221,921 | 3,243,698 | 21,776 | -3,050 | 2,386 | 3,169 | 1,999 | 0 |
| Greenland Sea | 603,416 | 631,794 | 28,379 | -75,775 | -8,538 | 9,800 | 5,283 | 9,128 |
| Northern Hemisphere (Total) | 14,805,115 | 11,441,099 | -3,364,015 | -1,407,617 | -803,072 | -407,171 | -98,474 | -36,094 |
| NH (Average Loss per Day) | -43,128 | -50,272 | -57,362 | -58,167 | -32,825 | -36,094 |
The National Resources Defense Council went on a little rant about clothes dryers in the USA.
A couple of items stood out:
“natural gas dryers typically cost 50 percent to 75 percent less to operate.”
“A typical household pays over $100 in annual utility bills to operate an electric dryer and $40 for a gas dryer.“
Clearly, to me, the NRDC is telling people: Buy A Gas Dryer!
“If all of America’s electric dryers were updated to the most efficient models sold in other parts of the world, U.S. consumers would not only save $4 billion worth of energy per year”
The NRDC are certifiably insane. An “Eco-Dry” dryer costs 1,199$. There are 89,000,000 dryers in the USA. That would cost 107 billion dollars to save 4 billion dollars. Does that make sense?
And if the USA did have a spare 108 billion dollars to send to Korea or China or Europe for new dryers:
” it would prevent roughly 16 million tons of carbon dioxide emissions annually, equivalent to the pollution from three coal-fired power plants””
Or one natural gas power plant. Unless the 107 billion dollars was spent on gas dryers (as the NRDC recommends) in which case it would probably increase the amount of CO2. Just kidding. Gas dryers produce less CO2 than electric ones because a large portion of US electricity comes from coal.
“How a consumer uses a dryer is almost as important as which dryer is purchased. Choosing a lower operating temperature can slow the drying process a little, but it cuts energy use significantly. Stopping the dryer before all of the clothes are bone-dry saves time and energy, while reducing wrinkles and helping clothes last longer.”
Sure. Lets spend 107 billion, burn more natural gas (actually I like that recommendation) so we can have slow drying wet clothes.
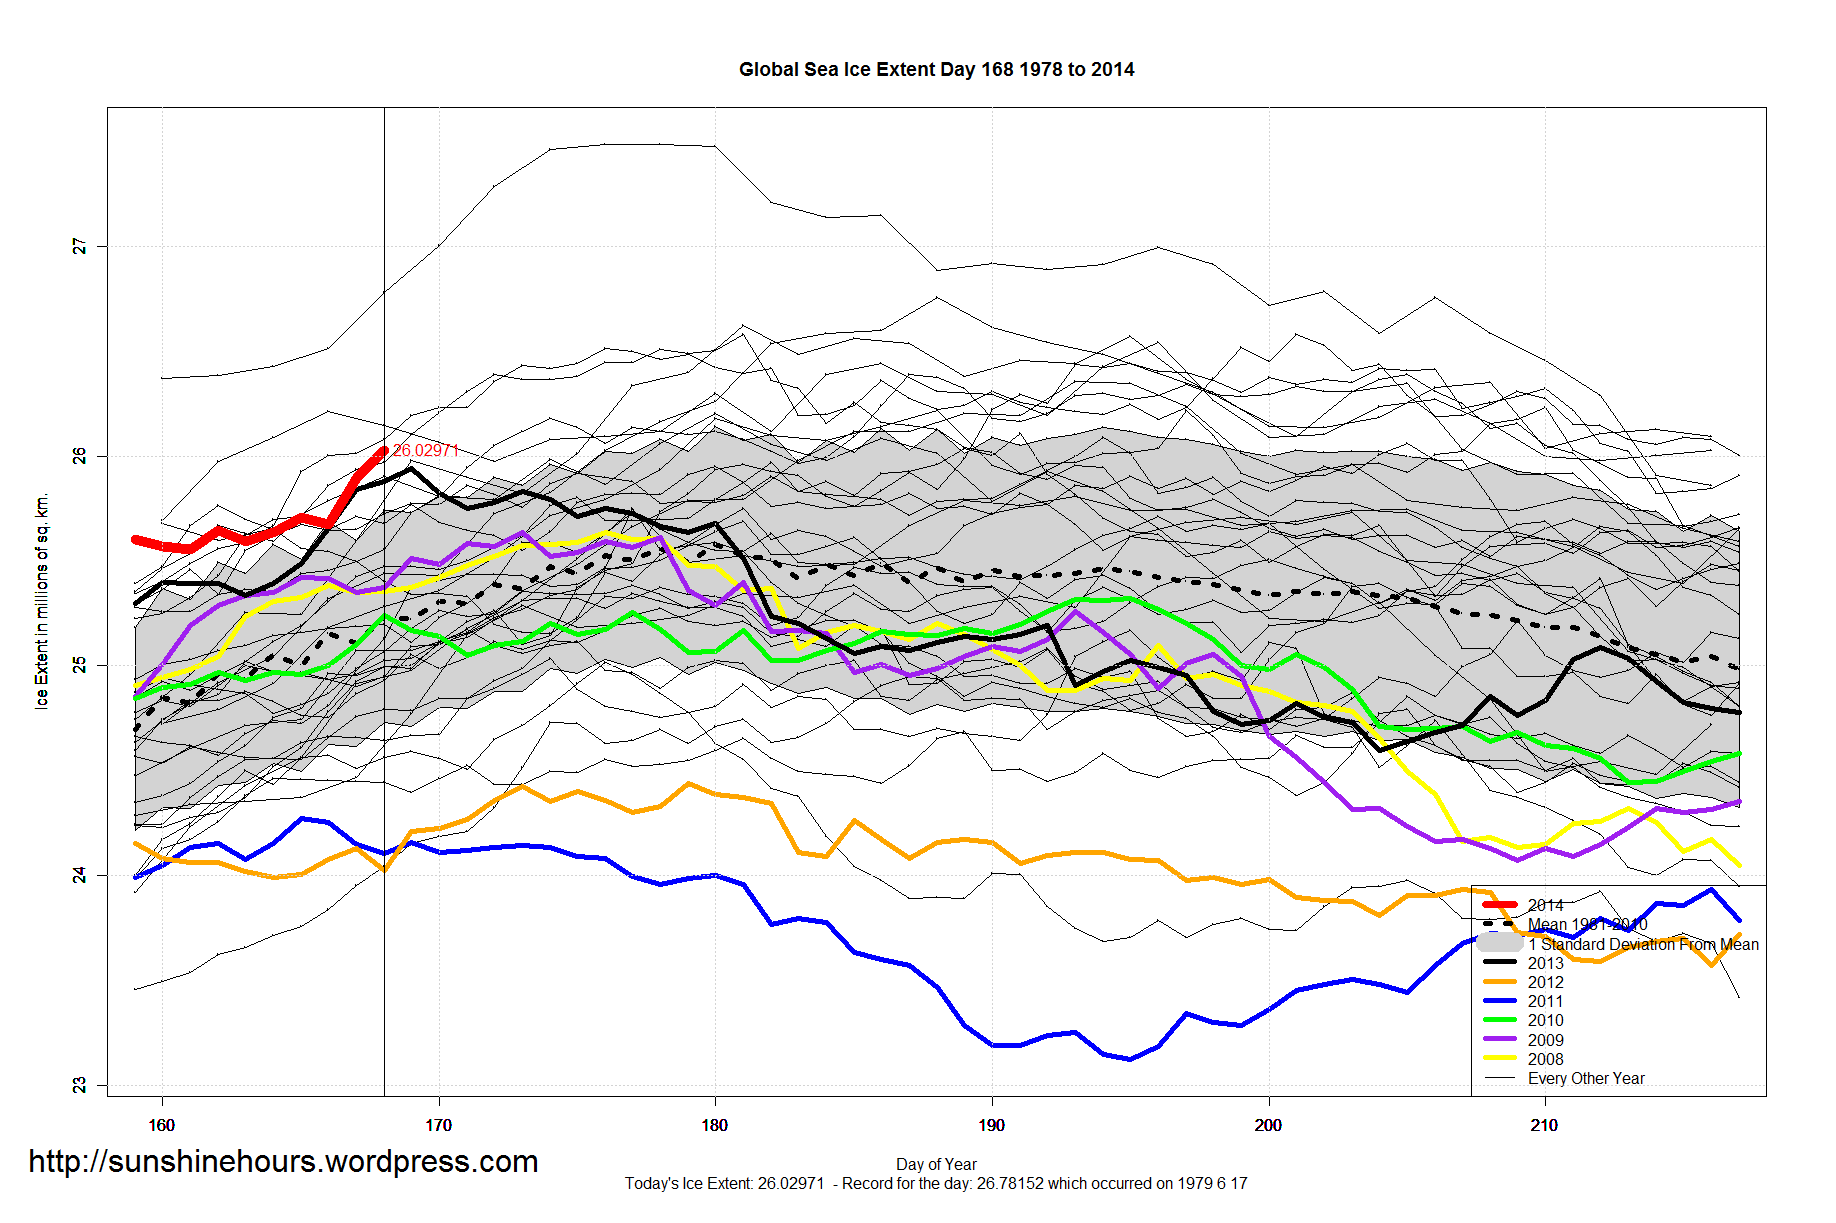
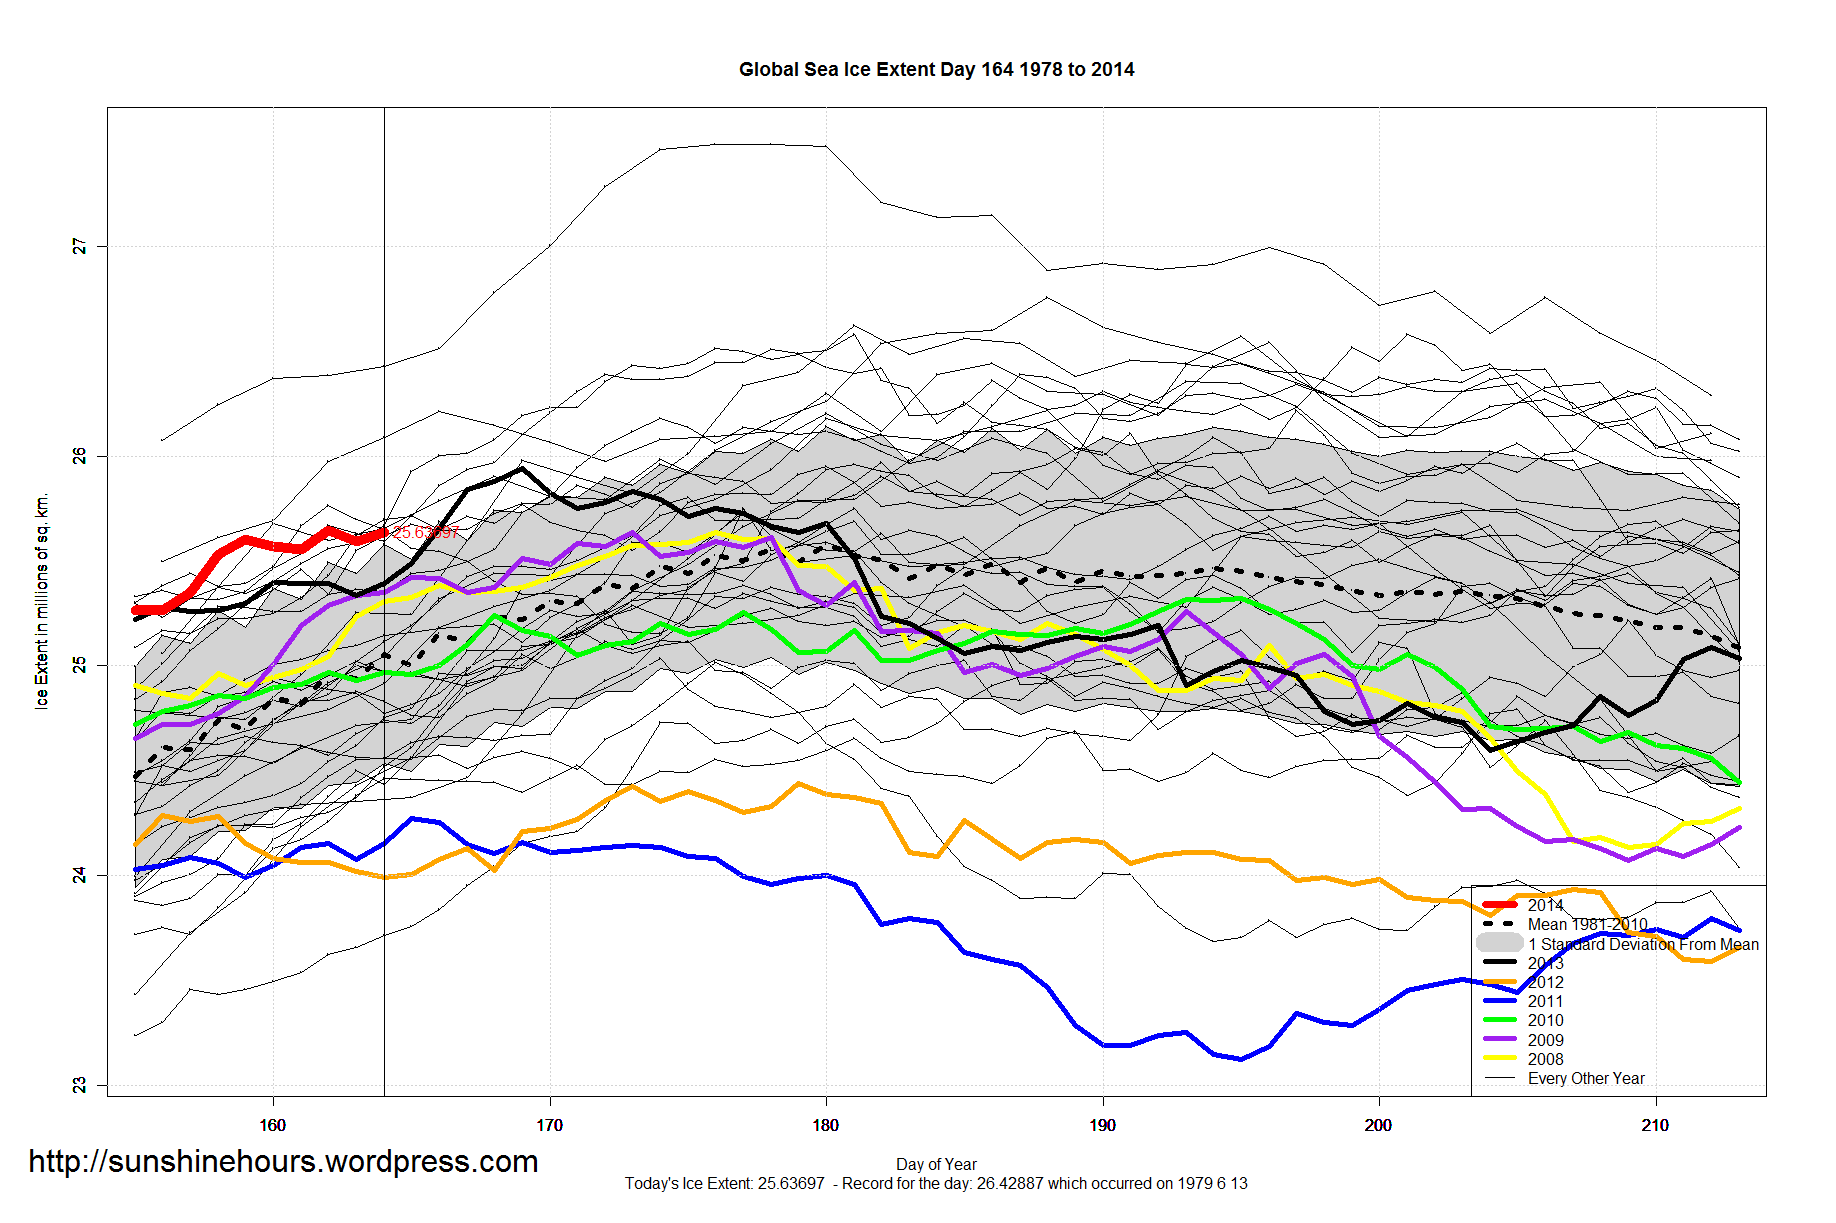
On this day in 2002 global sea ice was at 23.7 million sq km. In 2014 on the same day global sea ice is at 25.6 million sq km. That is a 1.9 million sq km increase.
You have to go back to 1999 to have more global sea ice than in 2014 on this day.
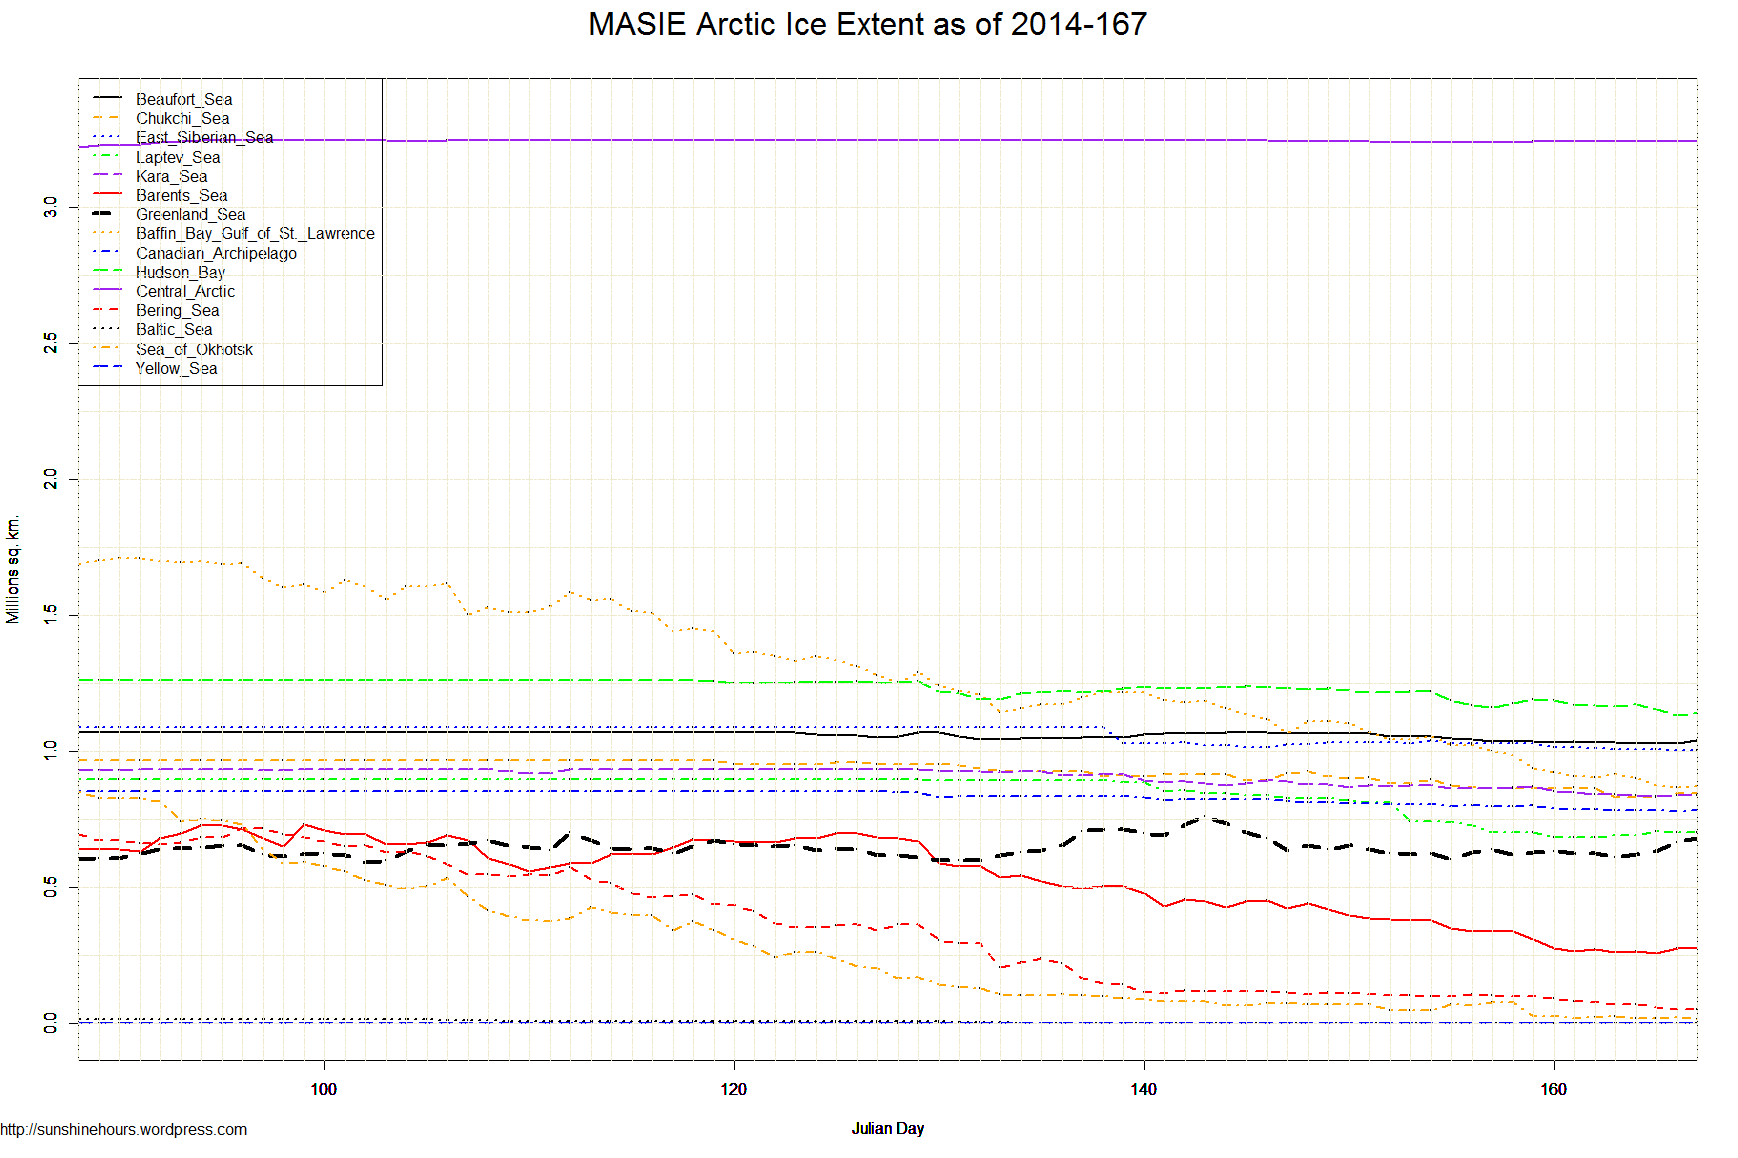
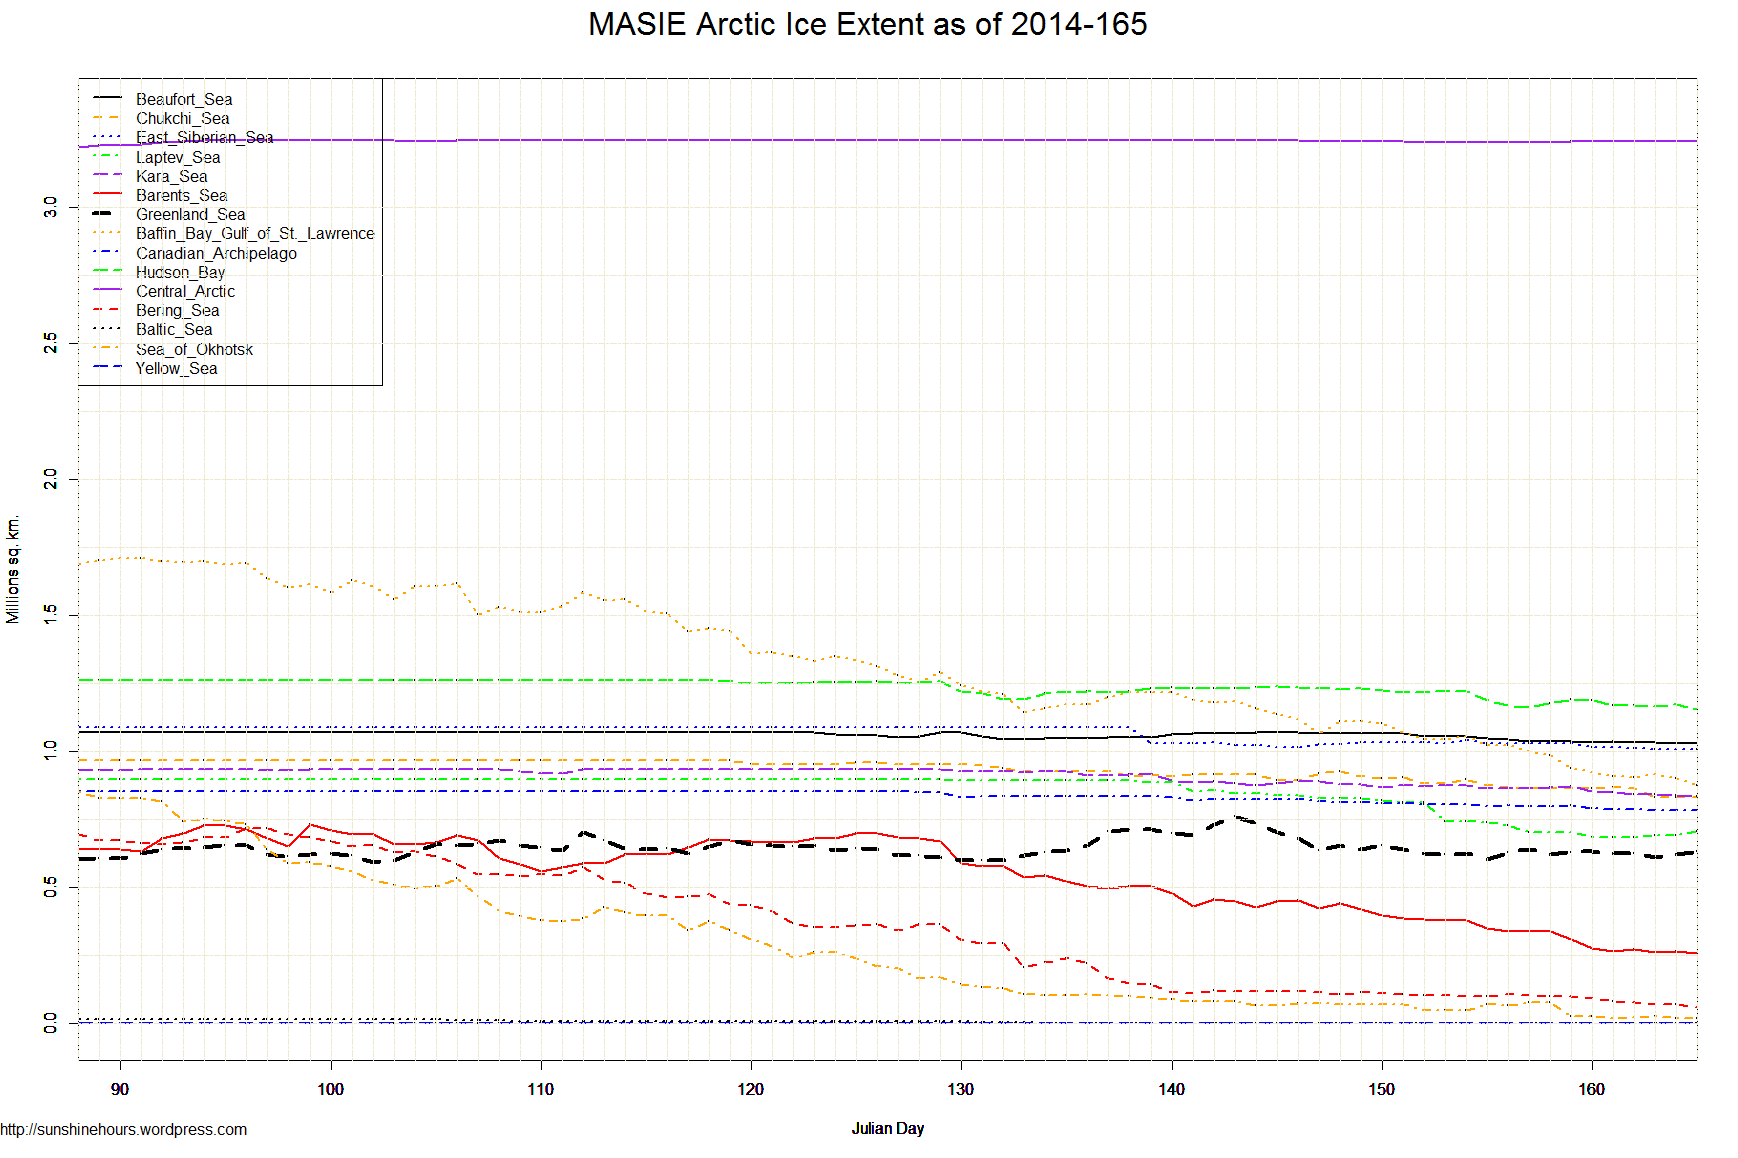
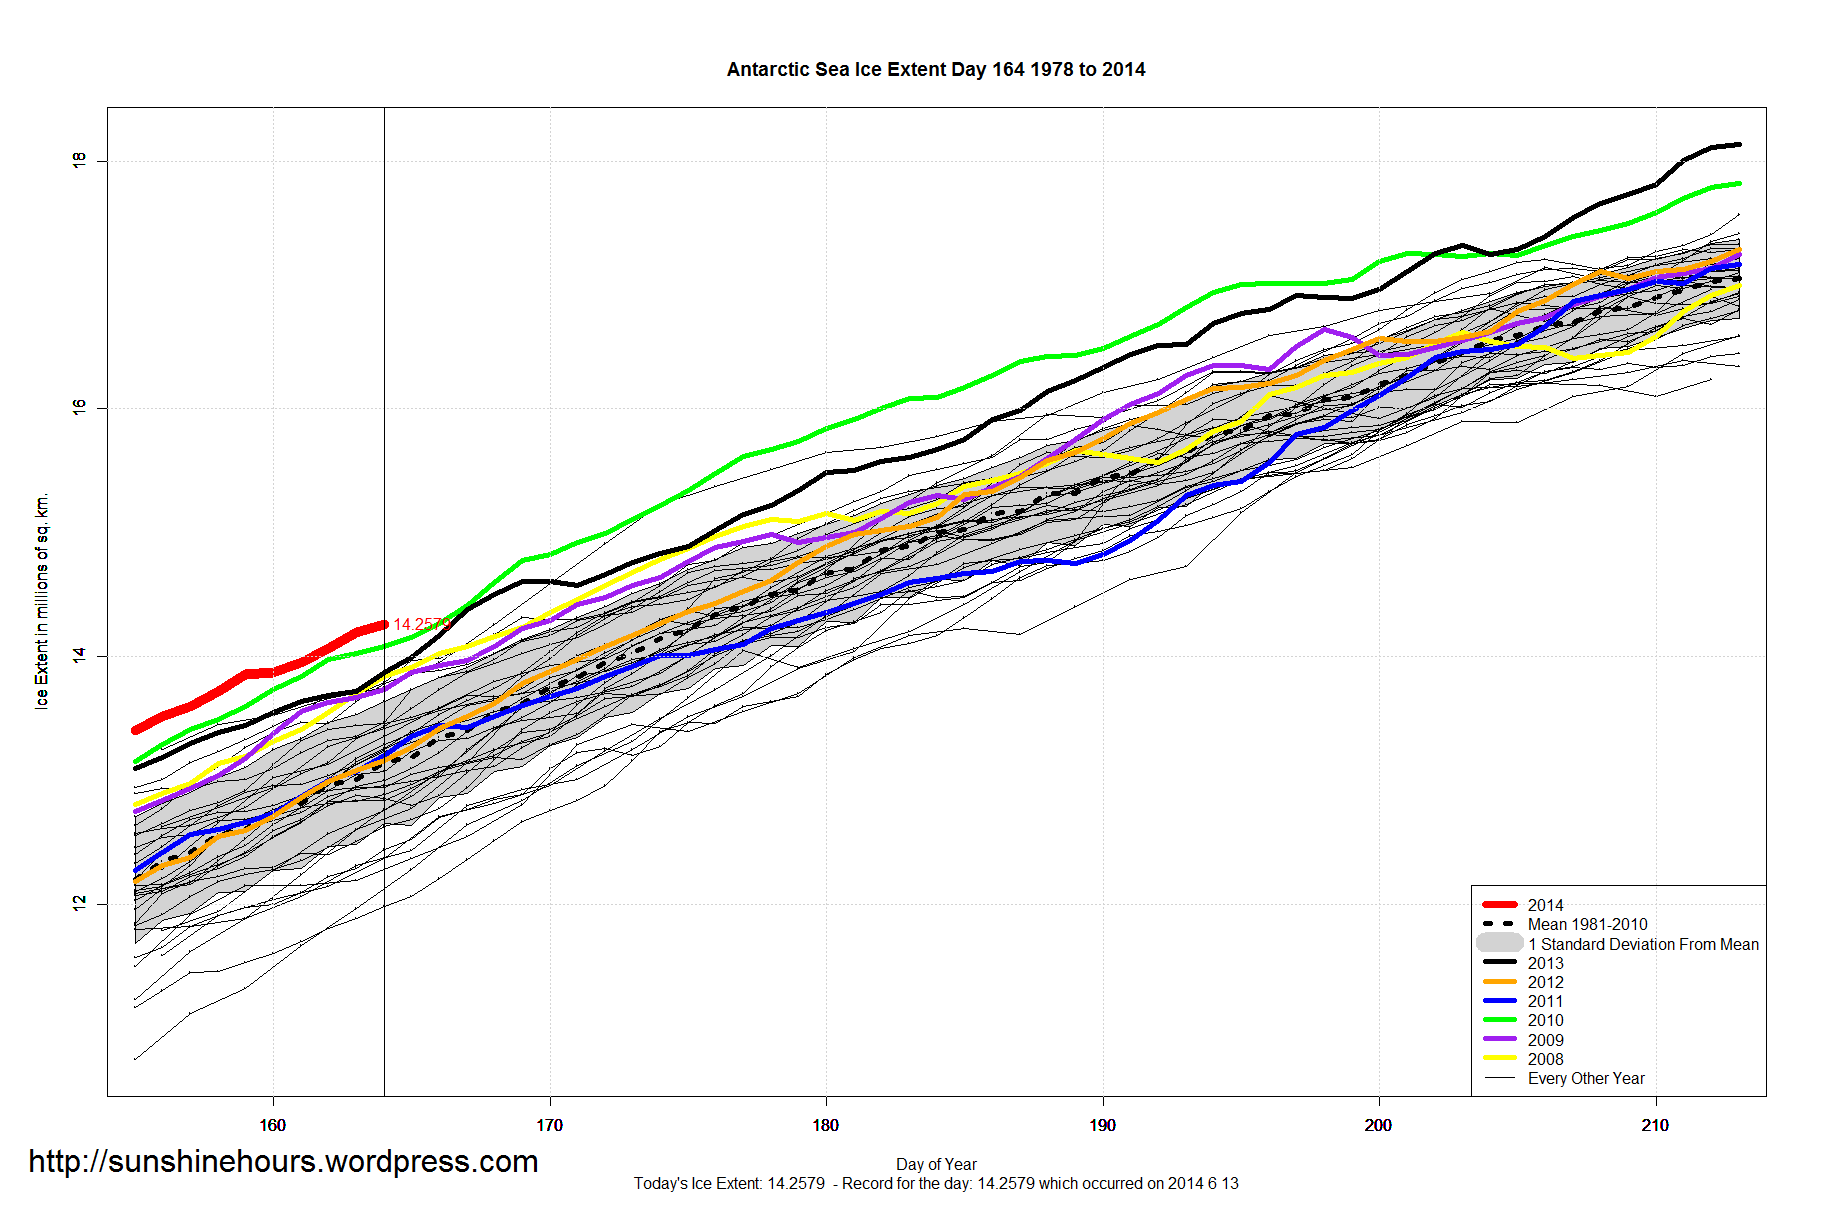
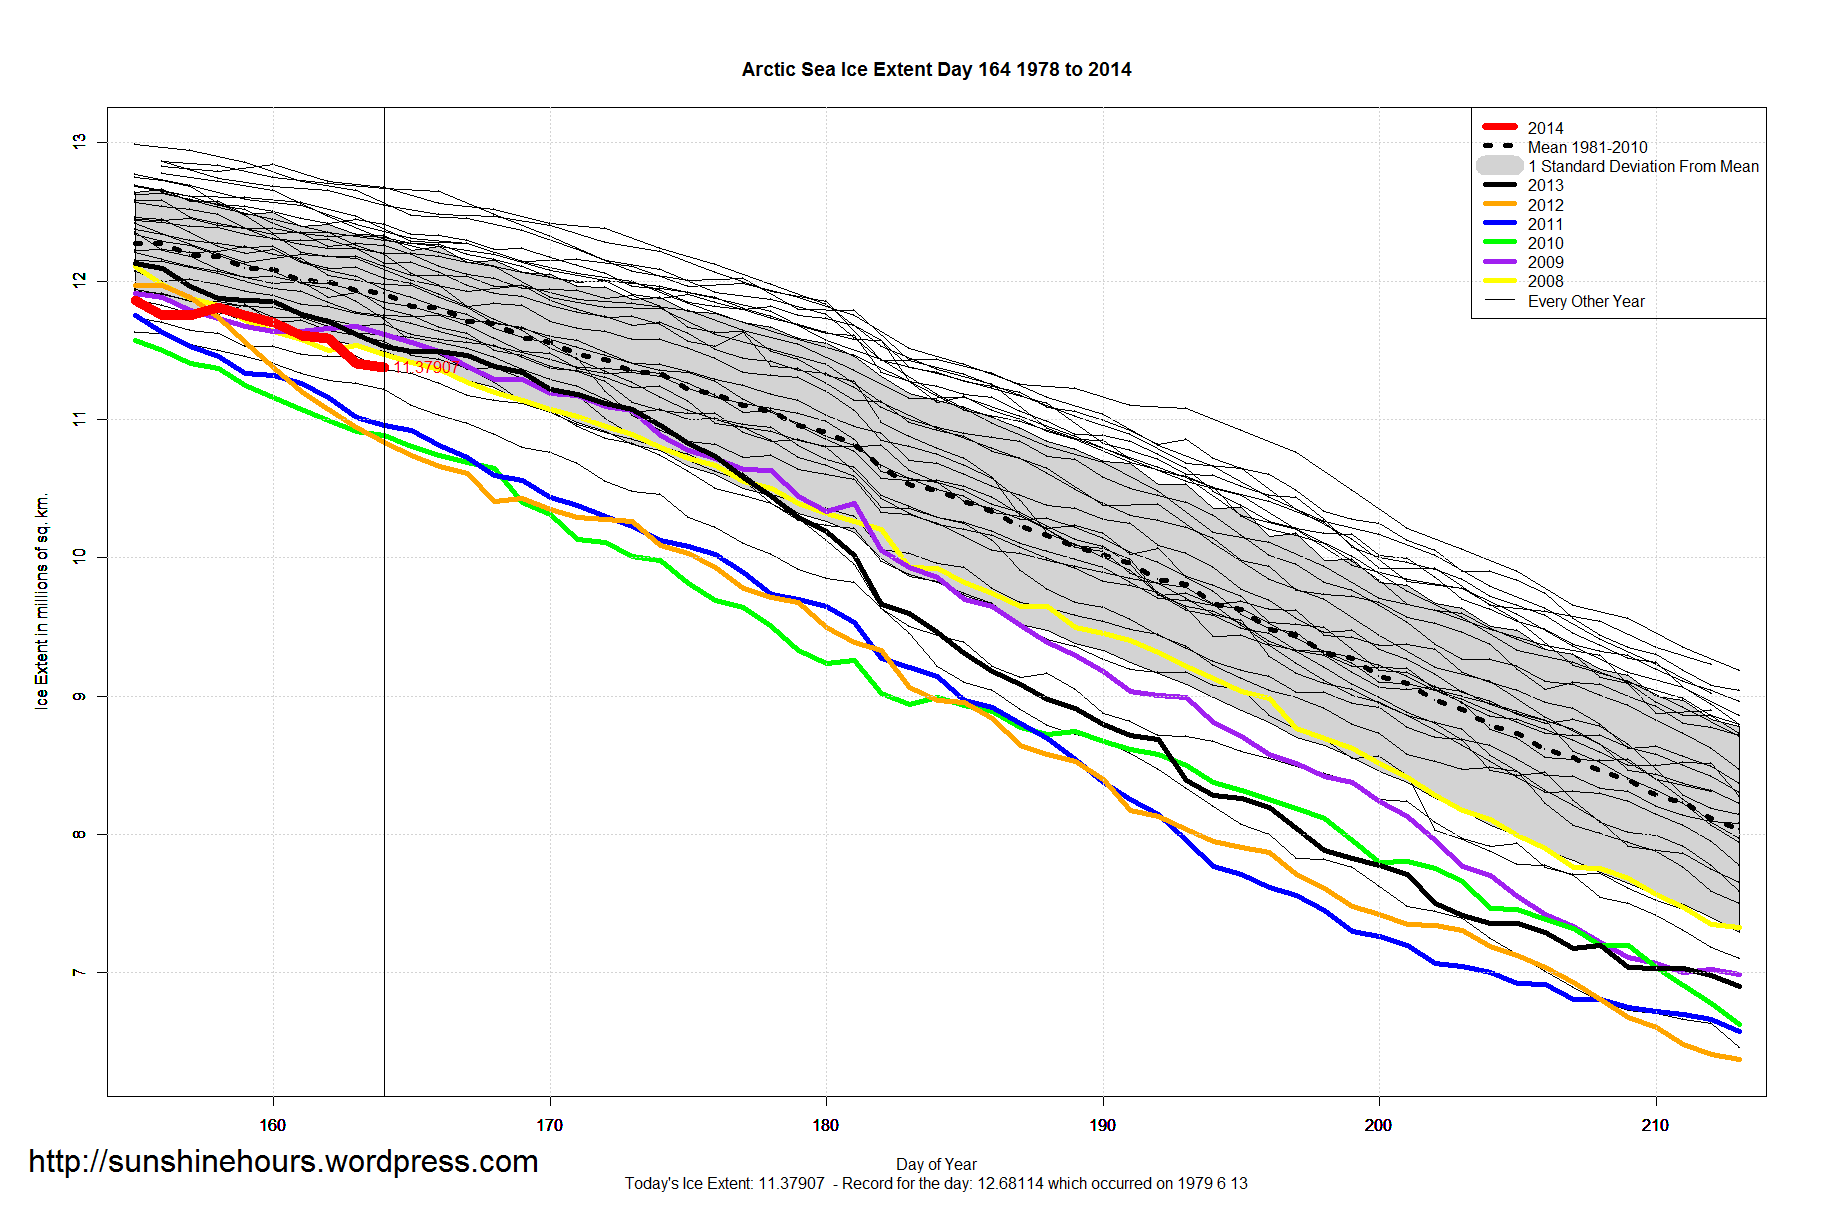
A quick update for sea ice extent for day 164 of 2014
NOAA Data here and here here. Graphs below. Click for bigger.
” India’s domestic spy service has accused Greenpeace and other lobby groups of hurting economic progress by campaigning against power projects, mining and genetically modified food, the most serious charge yet against foreign-funded organisations.”
“Greenpeace denied it was trying to block economic expansion”
“Seventy million households – 35-40 percent of the country’s 1.2 billion people – still have no access to electricity. This summer authorities in north India are battling power breakdowns and public anger as the country swelters under the longest heatwave on record.
The Intelligence Bureau said the foreign NGOs and their Indian arms were serving as tools advance Western foreign policy interests.”
Greenpeace believed that India should embrace renewable energy and improve energy efficiency …
http://uk.reuters.com/article/2014/06/12/uk-india-projects-idUKKBN0EN1CV20140612
How can rich white people headquartered in Germany hate the poor brown in India so much they deny them the chance of having electricity?
How can you improve the energy efficiency of ZERO electricity for 40% of the people. 500 million people without electricity.
And all the while Germany gets over 50% of its electricity from dirty brown lignite coal
There is a new government in India, and I suspect Greenpeace et al will be facing life and death choices for choosing to condemn so many Indians to poverty.
June 12 2014 MASIE Update – Central Arctic and Greenland Sea last two regions with more ice now than 74 days ago
Also, a slight slowdown only in the last 1 day. Ice on dropped -17,601.
| Region | Start | End | Last 74 | Last 28 | Last 14 | Last 7 | Last 3 | Last 1 |
| Baffin Bay Gulf of St. Lawrence | 1,688,530 | 904,040 | -784,490 | -253,963 | -208,362 | -120,139 | -32,622 | -5,302 |
| Barents Sea | 645,917 | 271,439 | -374,478 | -272,700 | -168,751 | -76,979 | -38,919 | 6,909 |
| Laptev Sea | 897,845 | 685,213 | -212,631 | -208,129 | -141,366 | -54,414 | -19,202 | -817 |
| Sea of Okhotsk | 853,240 | 22,042 | -831,197 | -80,052 | -49,182 | -47,337 | -4,905 | 1,504 |
| Kara Sea | 933,859 | 840,937 | -92,922 | -87,640 | -37,900 | -25,513 | -29,354 | -9,835 |
| Bering Sea | 697,324 | 77,030 | -620,294 | -146,473 | -31,857 | -24,151 | -22,319 | -4,679 |
| Hudson Bay | 1,260,903 | 1,170,147 | -90,757 | -43,330 | -59,925 | -18,886 | -20,428 | -231 |
| East Siberian Sea | 1,087,137 | 1,012,535 | -74,602 | -74,602 | -14,726 | -18,192 | -18,724 | -1,446 |
| Beaufort Sea | 1,070,445 | 1,035,169 | -35,276 | -13,379 | -30,935 | -13,864 | -2,725 | -1,235 |
| Chukchi Sea | 966,006 | 864,628 | -101,379 | -63,686 | -63,816 | -12,345 | 1,774 | -2,176 |
| Canadian Archipelago | 853,214 | 786,656 | -66,558 | -47,527 | -27,820 | -11,191 | -14,571 | -1,060 |
| Baltic Sea | 15,337 | 0 | -15,337 | -2,673 | 0 | 0 | 0 | 0 |
| Yellow Sea | 0 | 0 | 0 | 0 | 0 | 0 | 0 | 0 |
| Central Arctic | 3,221,921 | 3,241,698 | 19,777 | -6,044 | 7 | 2,003 | 6 | -400 |
| Greenland Sea | 603,416 | 626,511 | 23,096 | -3,170 | -27,694 | 24,406 | -3,669 | 781 |
| Northern Hemisphere (Total) | 14,805,115 | 11,539,574 | -3,265,541 | -1,303,336 | -862,280 | -396,216 | -205,273 | -17,601 |
| NH (Average Loss per Day) | -43,541 | -46,548 | -61,591 | -56,602 | -68,424 | -17,601 |