Sea Ice Update February 17 2014 – Antarctic Sea Ice Extent Still 25% above normal

A quick update for sea ice extent:

  • Global Sea Ice is 93,000 sq km below the 1981-2010 mean.  That is 0.5% below “normal”
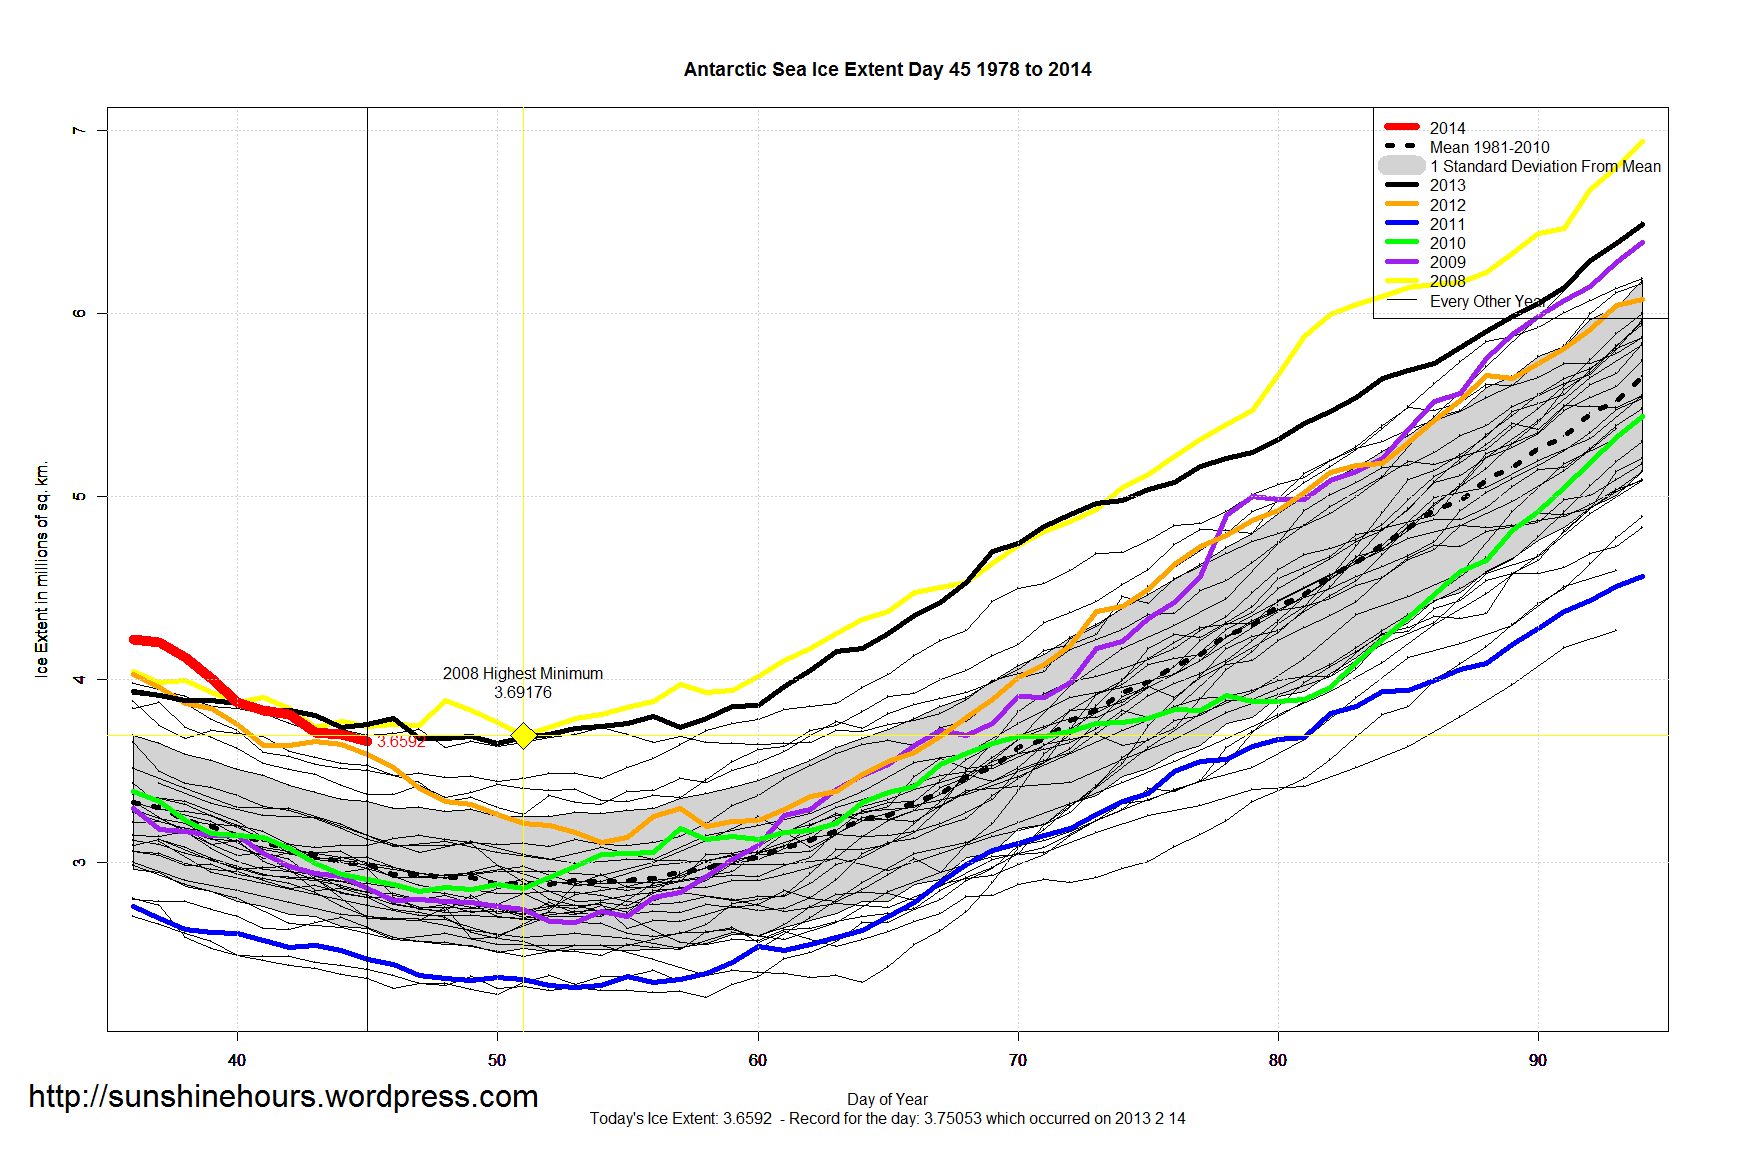
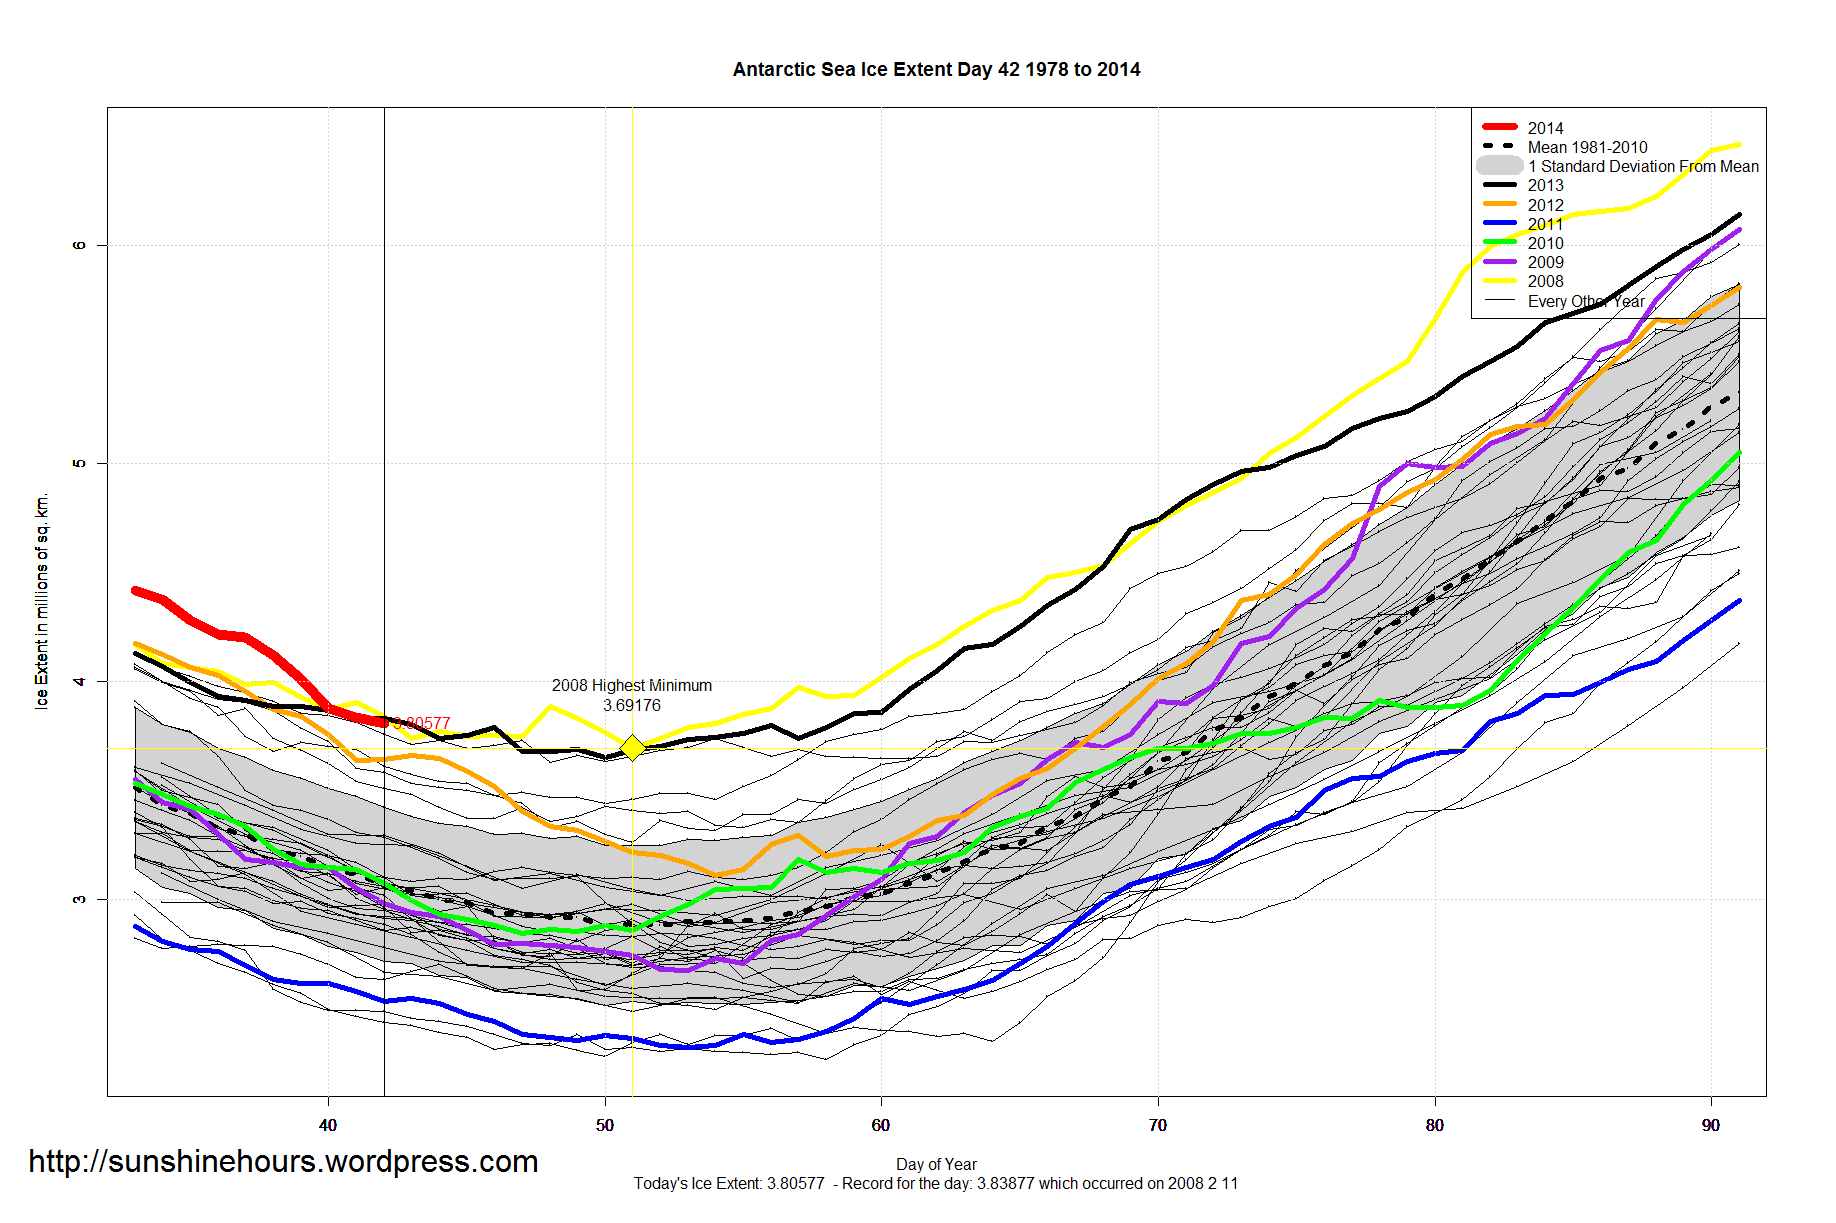
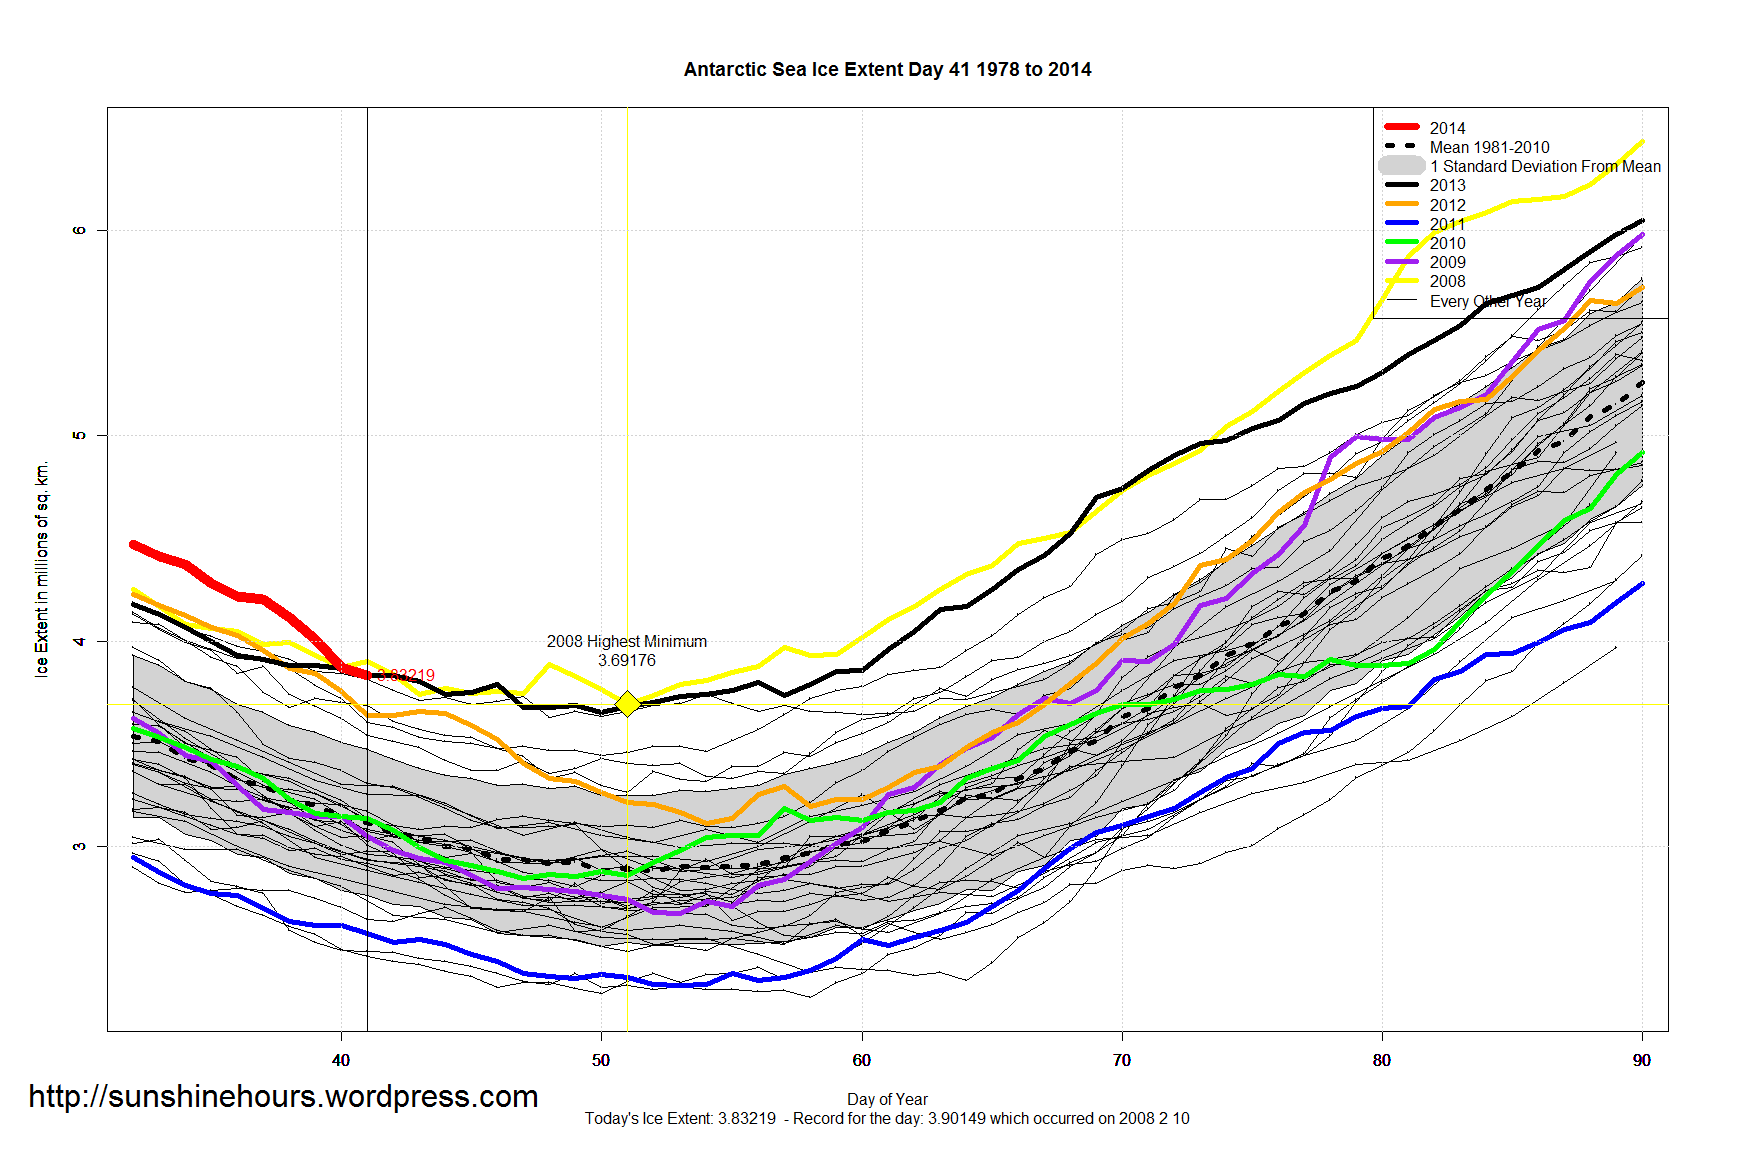
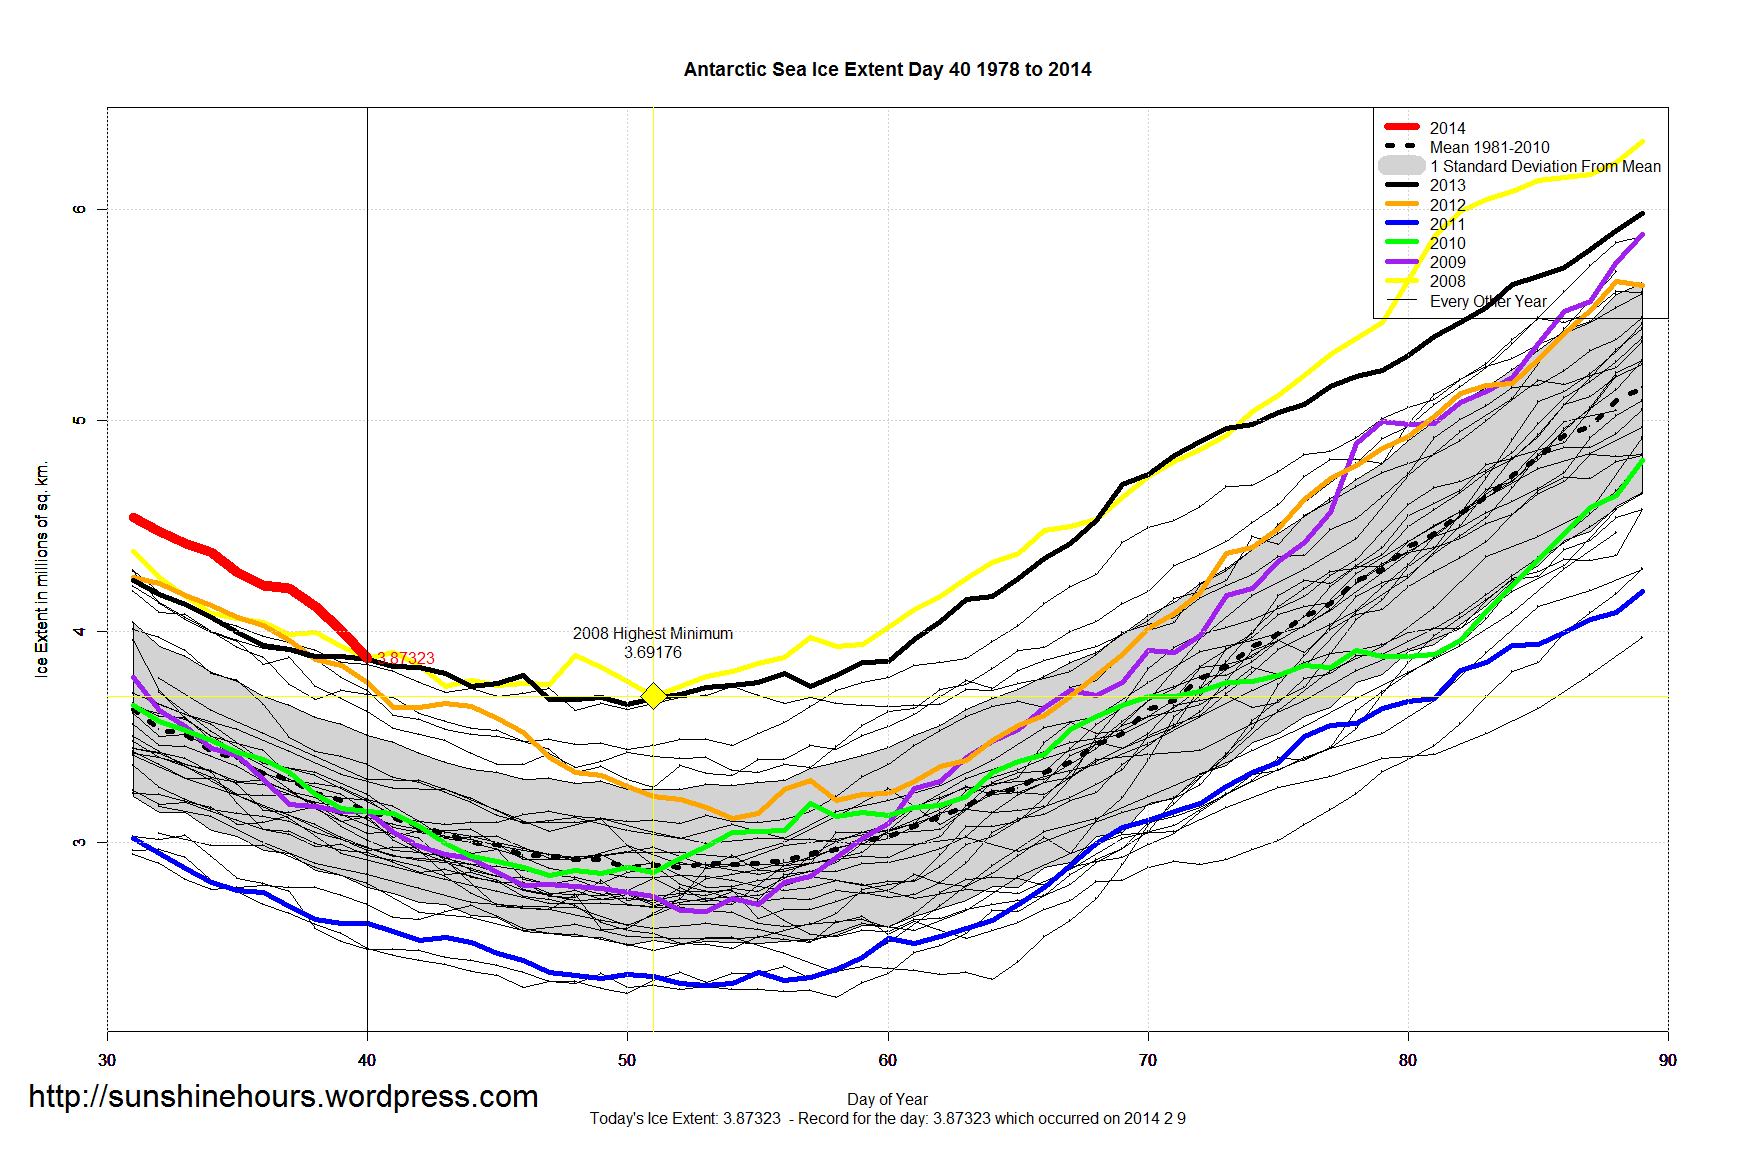
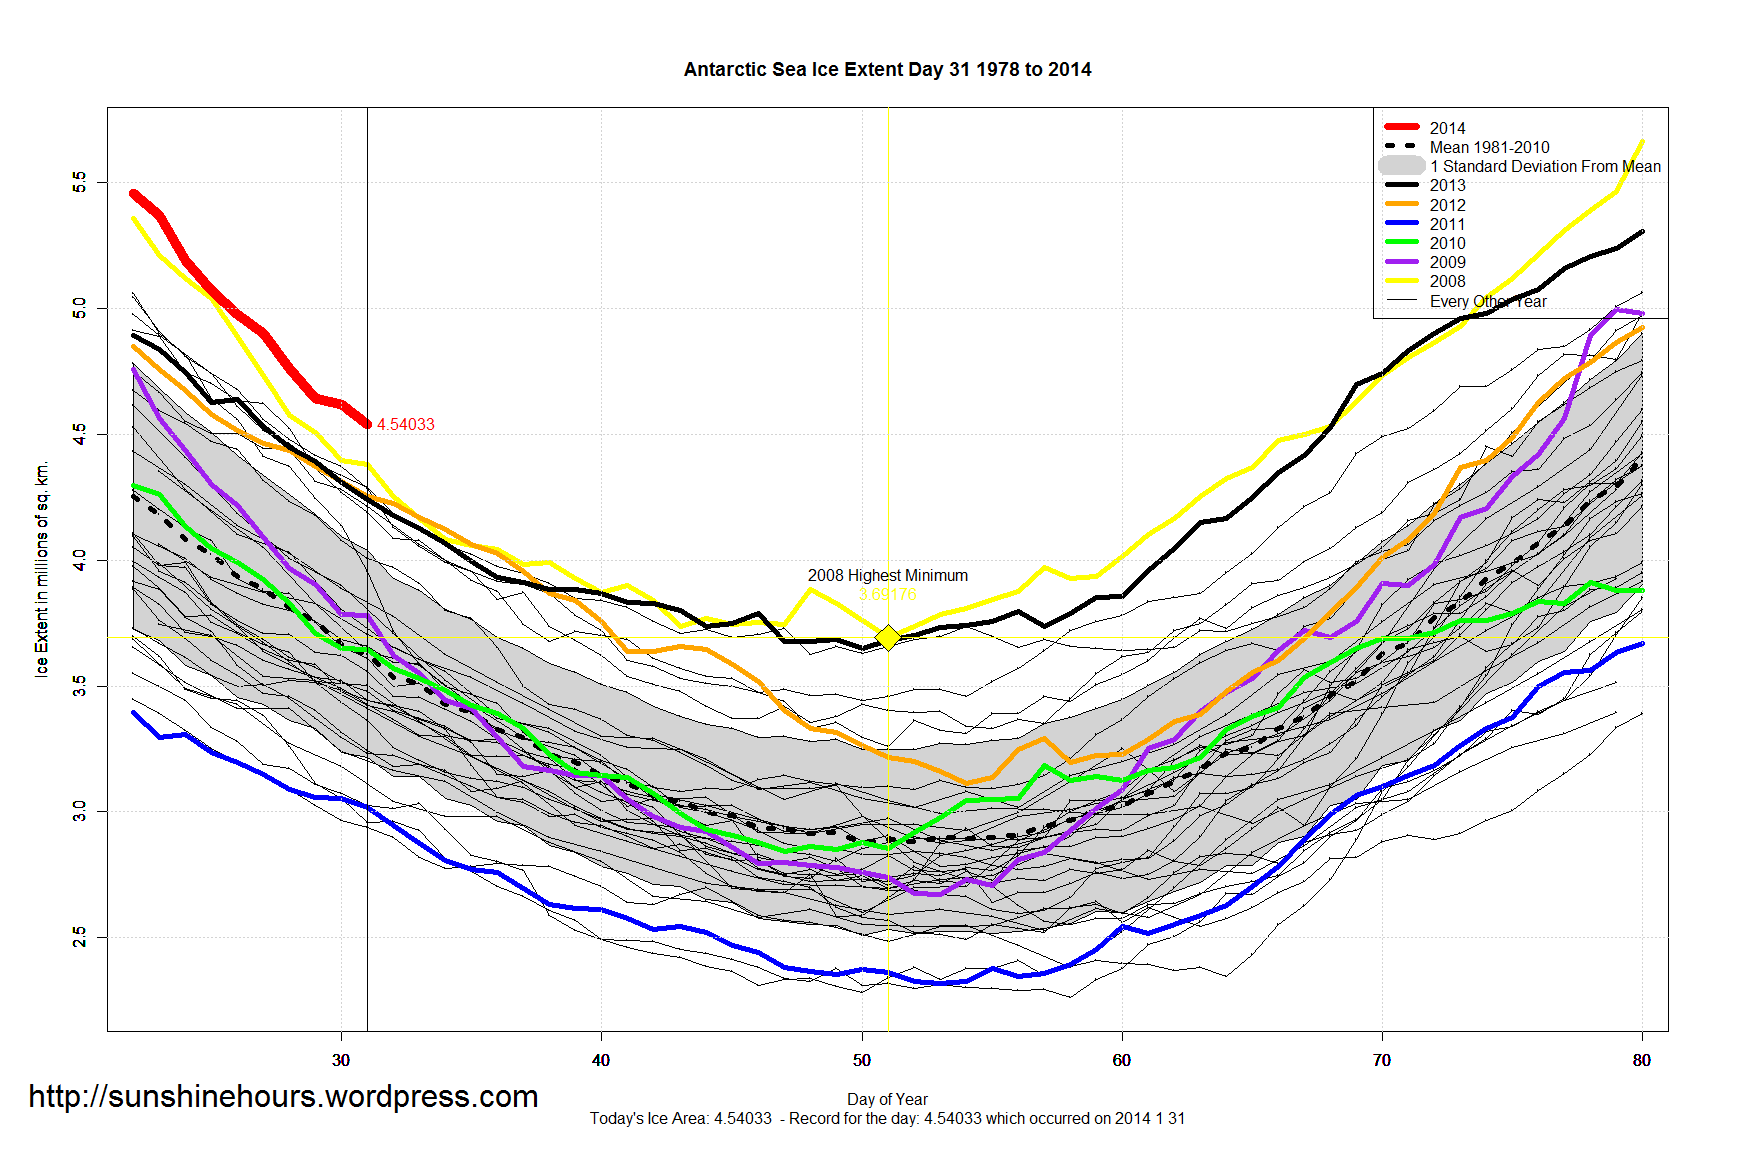
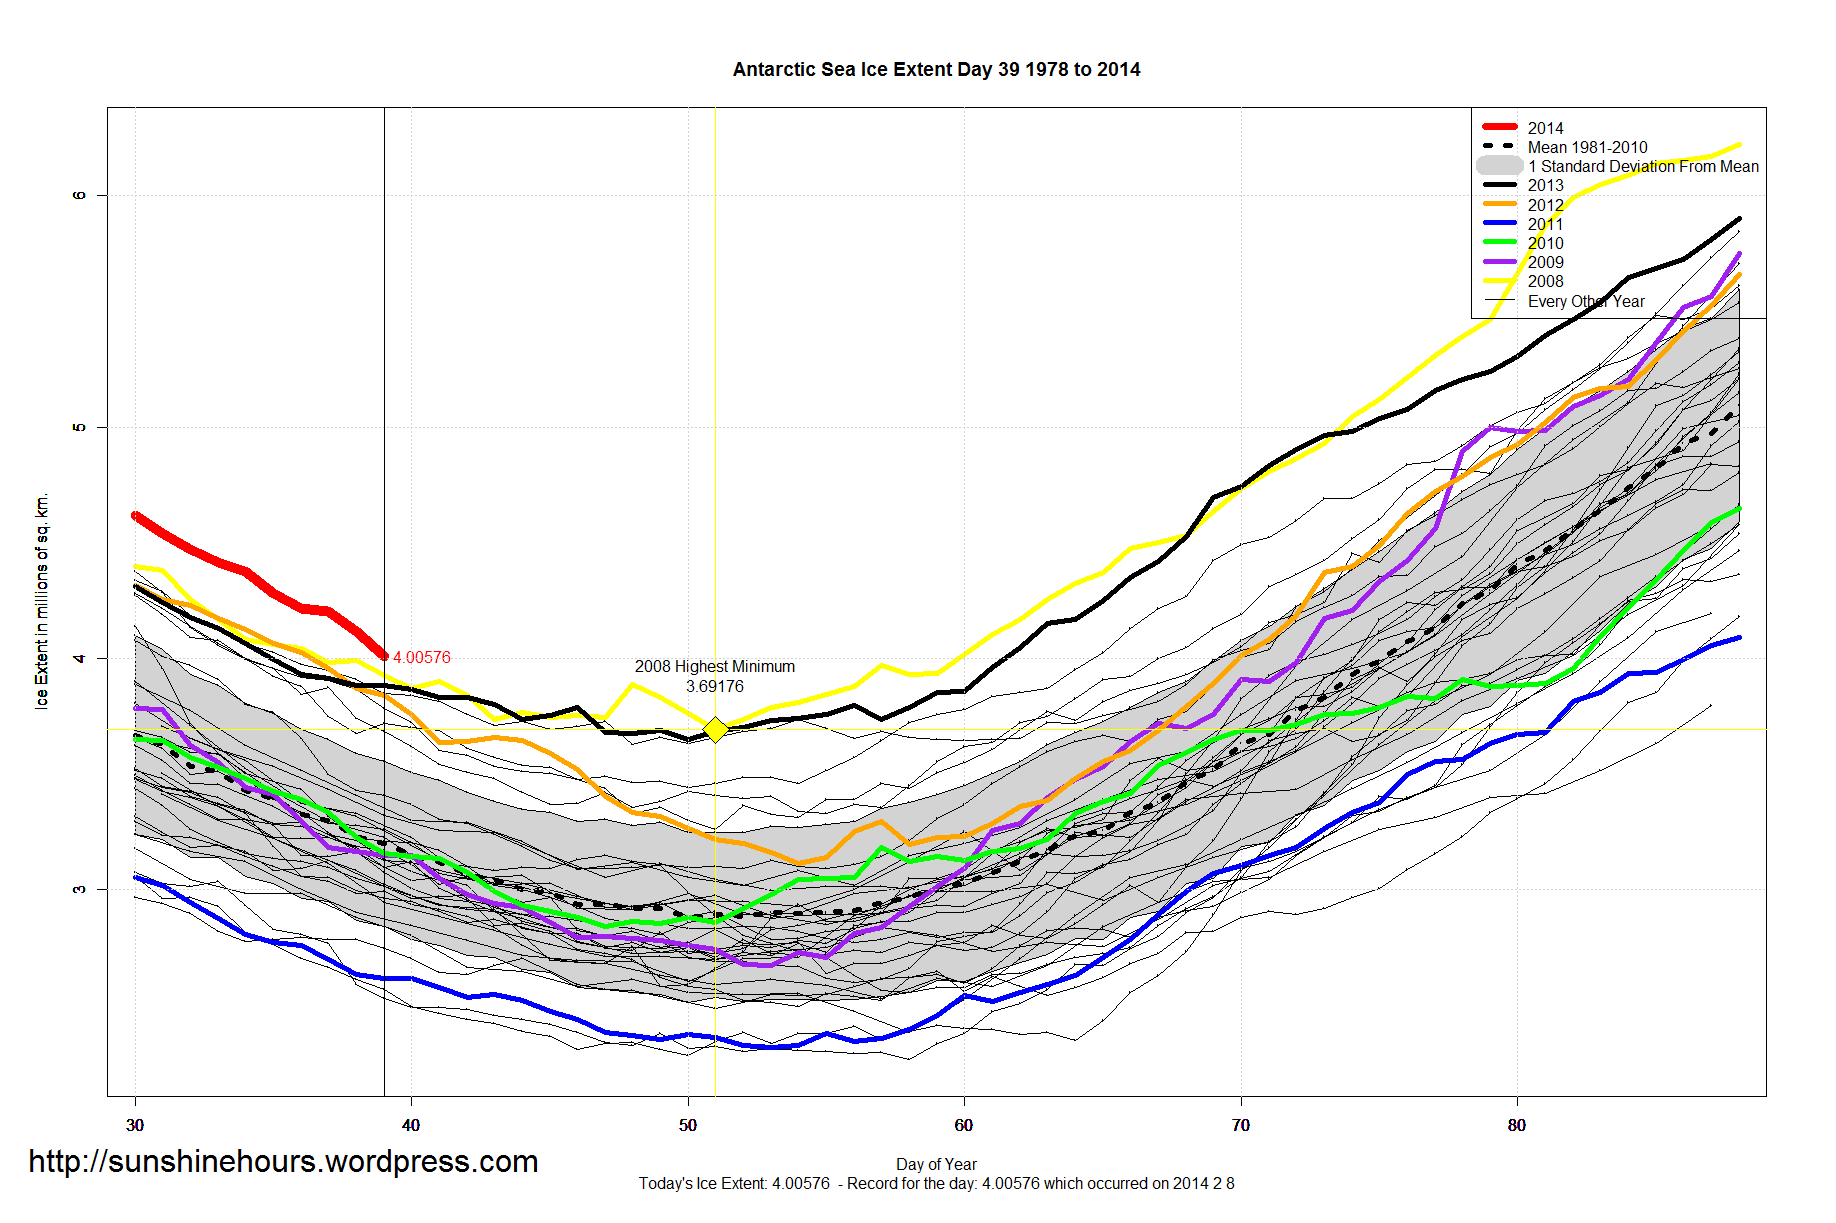
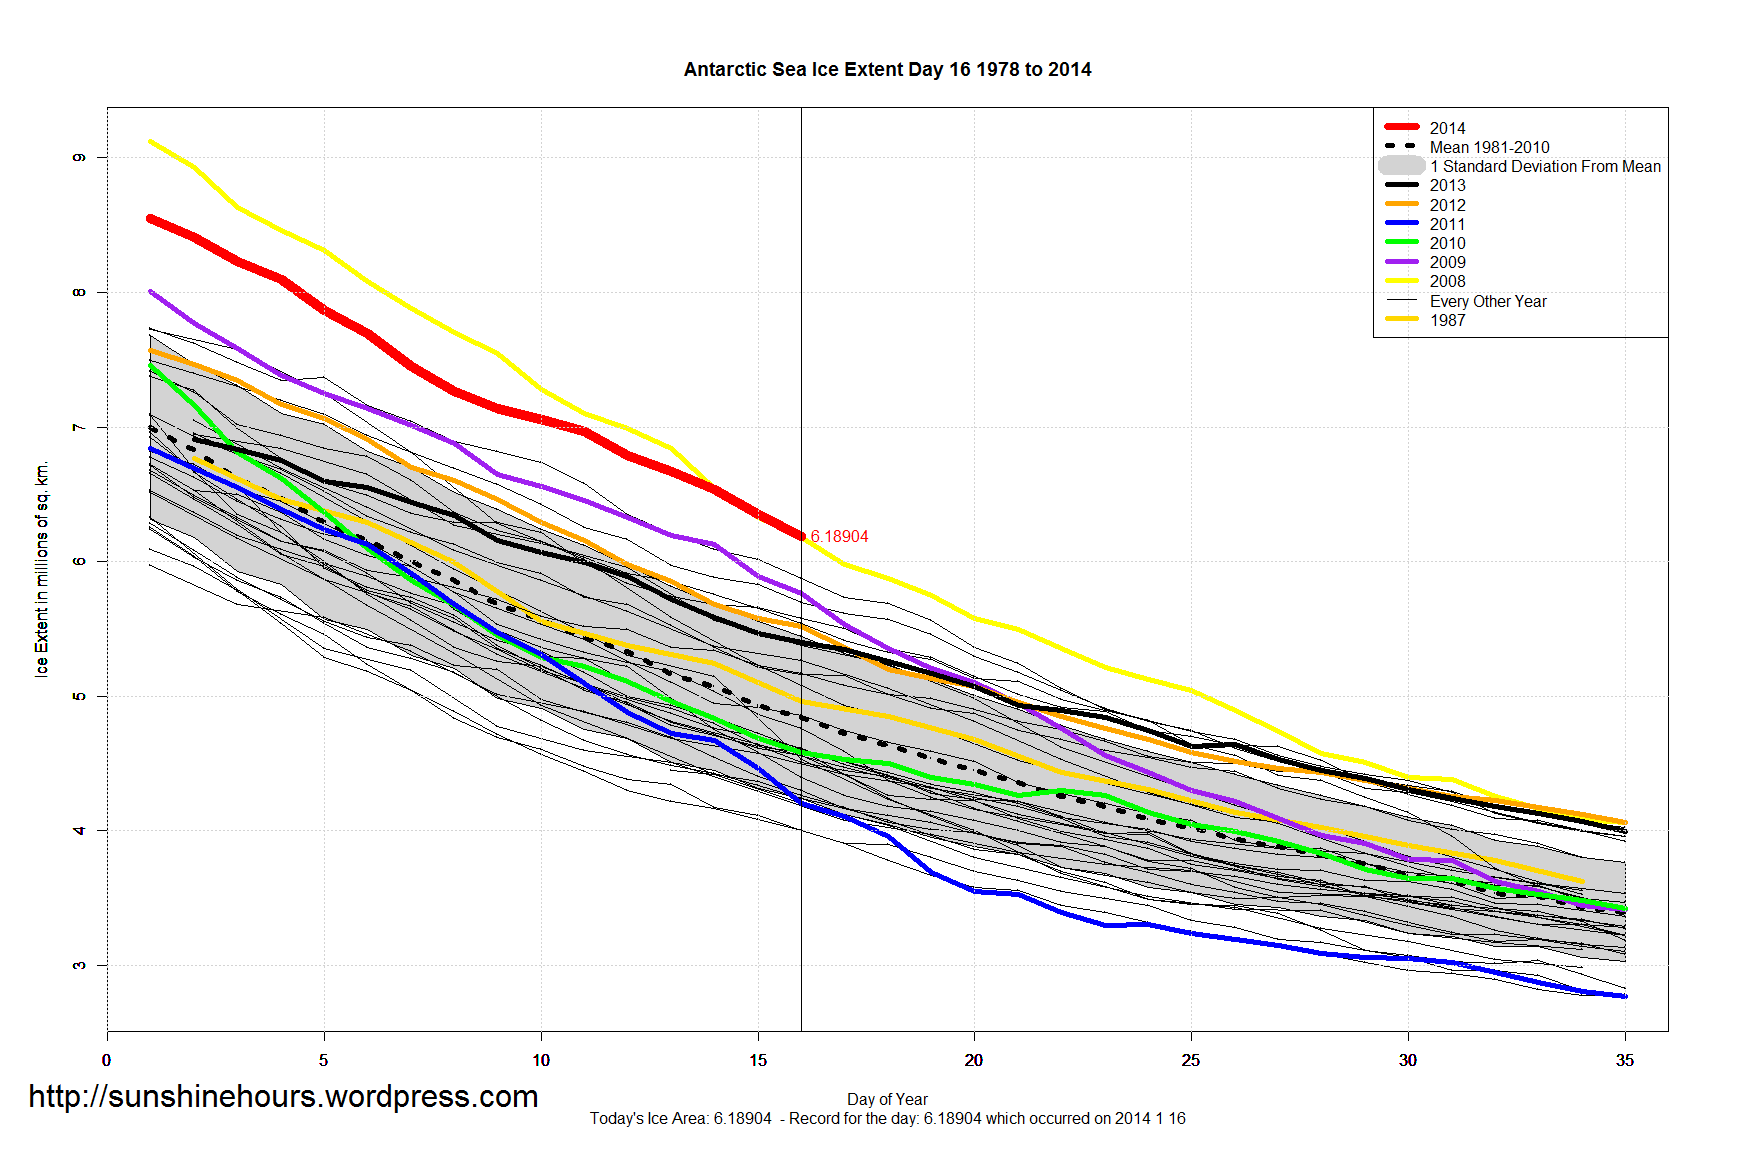
  • Antarctic Sea Ice is  706,000 sq km above the 1981-2010 mean. That is 25% above “normal”.  Antarctic Sea Ice Extent actually rose 38,000 sq km from day 46 to day 47. Minimum could be near.
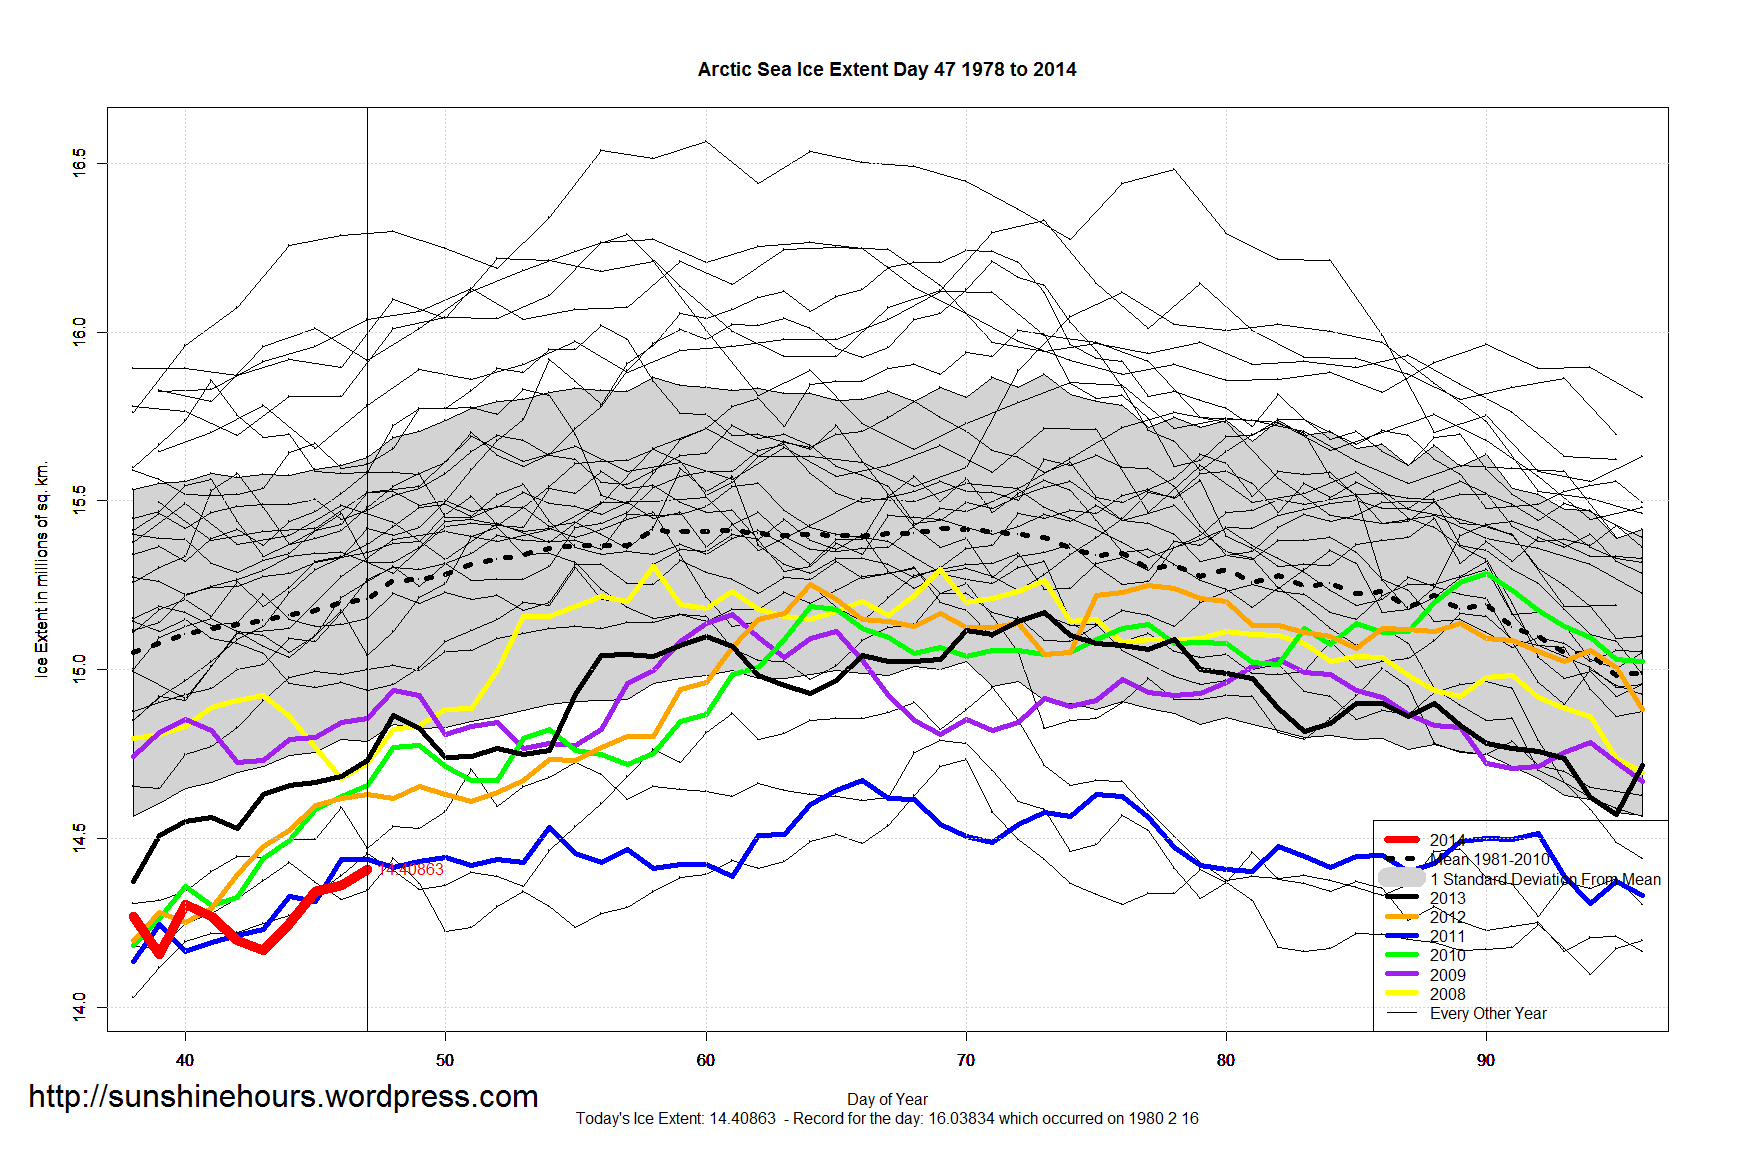
  • Arctic Sea Ice is 799,000 sq km below the 1981-2010 mean.  That is 5.25% below “normal”.

Data here. Graphs below. Click for bigger.

Global_Sea_Ice_Extent_Zoomed_2014_Day_47_1981-2010 Antarctic_Sea_Ice_Extent_Zoomed_2014_Day_47_1981-2010 Arctic_Sea_Ice_Extent_Zoomed_2014_Day_47_1981-2010

Canada is Cooling at -0.13C Per Decade Since 1998

Environment Canada publishes monthly summaries here. The data included Tmax, Tmean, Tmin and Normals (the D column). The Normals column is “Mean Temperature difference from Normal (1971-2000) (°C)”. These are supposedly the higher quality stations. Only some of the stations get a Normals value.

I could just look at the stations with Normals and summarize the data. But some of the stations are close together. So I thought why not summarize the data by 1×1 grid square and then summarize the grid squares. The green line is the count of grid squares with data in them. That is dropping like a stone. (I will discuss this in another post).

And why not see what happens from 1998. We know 1998 is a pivot point in climate.

The trend for the whole country from 1998 is cooling at -0.13C/decade. The big surprise is Ontario. The last time I did this it was warming. Here are the trends for each province.

All  -0.13
BC   -0.20 
ALTA -0.35 
SASK -0.53 
MAN  -0.56 
ONT  -0.13
QUE   0.25 
NS    0.12 
NB    0.23 
NFLD  0.35 
PEI   0.26 
NWT  -0.22 
YT   -0.22 
NU    0.54

And here are the graphs for each province and then one more for the whole country. Click For bigger.

Canada Monthly Summary Analysis - 1998 to 2014 - 'Normals' Anomaly - 1x1 Grid - All Provinces

Canada Monthly Summary Analysis - 1998 to 2014 - 'Normals' Anomaly - 1x1 Grid - BC
Canada Monthly Summary Analysis - 1998 to 2014 - 'Normals' Anomaly - 1x1 Grid - ALTA
Canada Monthly Summary Analysis - 1998 to 2014 - 'Normals' Anomaly - 1x1 Grid - SASK
Canada Monthly Summary Analysis - 1998 to 2014 - 'Normals' Anomaly - 1x1 Grid - MAN
Canada Monthly Summary Analysis - 1998 to 2014 - 'Normals' Anomaly - 1x1 Grid - ONT
Canada Monthly Summary Analysis - 1998 to 2014 - 'Normals' Anomaly - 1x1 Grid - QUE

Canada Monthly Summary Analysis - 1998 to 2014 - 'Normals' Anomaly - 1x1 Grid - NS
Canada Monthly Summary Analysis - 1998 to 2014 - 'Normals' Anomaly - 1x1 Grid - PEI
Canada Monthly Summary Analysis - 1998 to 2014 - 'Normals' Anomaly - 1x1 Grid - NFLD
Canada Monthly Summary Analysis - 1998 to 2014 - 'Normals' Anomaly - 1x1 Grid - NB
Canada Monthly Summary Analysis - 1998 to 2014 - 'Normals' Anomaly - 1x1 Grid - NU
Canada Monthly Summary Analysis - 1998 to 2014 - 'Normals' Anomaly - 1x1 Grid - YT
Canada Monthly Summary Analysis - 1998 to 2014 - 'Normals' Anomaly - 1x1 Grid - NWT

Antarctic Sea Ice Extent pdate February 14 2014 – 23.4% Above Normal

Antarctic Sea Ice Extent only dropped 5960 sq km from day 43 to day 44. Which brings it to within 9310 sq km of the 2008 record for highest minimum. That means at least one more day with the chance of a new record occurring. Maybe two. It isn’t impossible for this to be minimum, just unlikely. The earliest minimum was day 43 in 1996.

Antarctic Sea Ice Extent is still 702,000 sq km above the 1981-2010 mean, which is 23.4% above the mean.

Antarctic_Sea_Ice_Extent_Zoomed_2014_Day_44_1981-2010

NOAA USA January – 67 January’s Were Warmer

According to the NOAA, January was only the 53rd warmest out of 120. That means 67 January’s (out of 120) were warmer.

The lower 48 states were pretty much divided right down the middle. Very cold in the east, warm in the west and normal in the states directly above Texas.

Alabama had its 4th coldest January in 120 years. It was -8.3F colder than normal. Minnesota was the coldest state, averaging 2.3F. Brrr. Only 52.3F colder than Florida.

Here are the maps of average temperature, rank out of 120 (120 = warmest) and temperature anomaly from 1901-2000

Average Temperature in F

NOAA_JAN_2014_Map_Average_Temperature

Rank out of 120 (120 = warmest and 1 = coldest)

NOAA_JAN_2014_Map_Rank

Anomaly in F from 1901 – 2000 average.

NOAA_JAN_2014_Map_Anomaly

Antarctic Sea Ice – 24% and 738,000 sq km Above Normal – Day 42

A week ago I was sure a new record would be set for highest minimum. Two days ago I was sure the record would not be set. Now I’m not predicting.

Antarctic Sea Ice Extent is 738,000 sq km above the 1981-2010 mean. Which is 24% above. The anomaly was slightly higher today because of the minimal melt – 30,000 sq km.

Extent is 3.805 million sq km, and is still 110,000 sq km above the record highest minimum set in 2008.

I’ve added the 2008 Highest Minimum point to this graph. Data is here. Click for bigger.

Antarctic_Sea_Ice_Extent_Zoomed_2014_Day_42_1981-2010


Canada January 2014 – Monthly Anomalies Mapped

I have mapped the January 2014 anomalies in the Environment Canada monthly summaries that have “normals”. The anomalies are calculated from selected stations based on the 1971-2000 average.

The size if the dot represents the size of the anomaly. The 5C black dot in the top left hand corner represents 5C difference from “normal”. Red dots are warmer than normal. Blue are cooler. And Green are 0.

Not much sign of the Polar Vortex in BC and Alberta for January. A big change from December.

EC MonthlyNormalsTemperature2014-01

Antarctic Sea Ice – 717,000 sq km Above Normal – Day 41

Antarctic Sea Ice Extent is 717,000 sq km above the 1981-2010 mean. Which is 23% above. Today was the first non-record day in 18 days.

Extent is 3.83 million sq km, and is still 140,000 sq km above the record highest minimum set in 2008.

I’ve added the 2008 Highest Minimum point to this graph. (But it isn’t looking as good for a new record now). Data is here. Click for bigger.

Antarctic_Sea_Ice_Extent_Zoomed_2014_Day_41_1981-2010


Sea Ice Update February 10 2014

A quick update for sea ice extent:

  • Global Sea Ice is 70,000 sq km below the 1981-2010 mean.
  • Antarctic Sea Ice is  728,000 sq km above the 1981-2010 mean and probably NOT on track to break the record for highest minimum.  Day 40 was still a daily record (23rd of the year), but only by 2120 sq km.
  • Arctic Sea Ice is 798,000 sq km below the 1981-2010 mean.

Graphs below. Click for bigger.

Global_Sea_Ice_Extent_Zoomed_2014_Day_40_1981-2010 Antarctic_Sea_Ice_Extent_Zoomed_2014_Day_40_1981-2010 Arctic_Sea_Ice_Extent_Zoomed_2014_Day_40_1981-2010