Just a reminder for those AGW cult members. According to the NOAA, May in the Southeast USA has been cooling at -0.1F/decade since 1895.
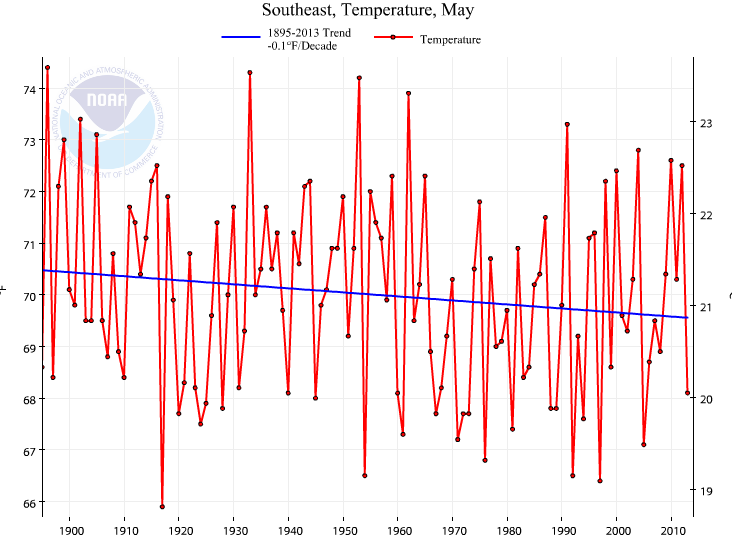
Just a reminder for those AGW cult members. According to the NOAA, May in the Southeast USA has been cooling at -0.1F/decade since 1895.
The Southeast states were cold in May 2013 according to the NOAA. Florida had the 11th coldest May in its history. Which means 108 were warmer.
Georgia had its 12th coldest, Louisiana 13th, South Carolina 14th and Alabama 15th.
Brrr.
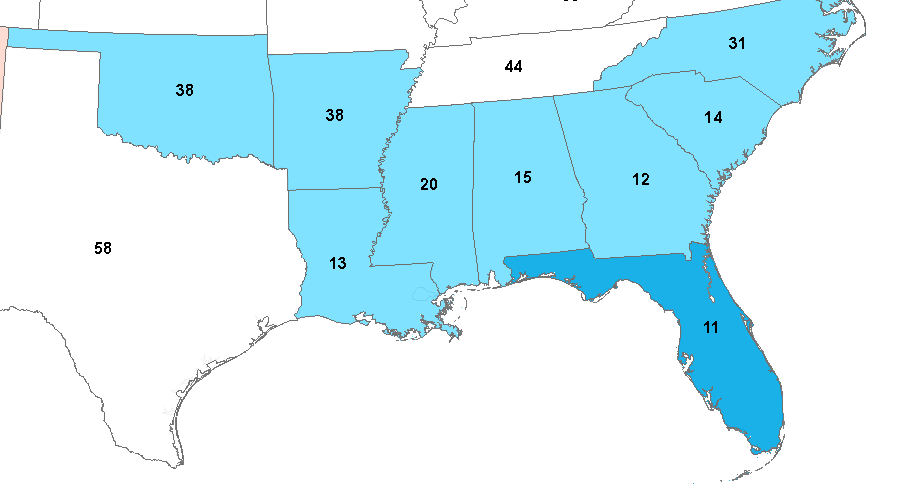
None of the states were ranked higher than 99 out of 119. Which means only California snuck into the top 20 warmest May’s.
Rank: (1=Coldest & 119 = Warmest)
| State | May_2013 | May Rank | Coldest May | Coldest May F |
| Florida | 73.9 | 11 | 1940 | 72.5 |
| Georgia | 68.6 | 12 | 1997 | 66.8 |
| Louisiana | 71.4 | 13 | 1917 | 69.2 |
| South Carolina | 67.6 | 14 | 1997 | 65.8 |
| Alabama | 68.3 | 15 | 1976 | 65.2 |
| Mississippi | 69.2 | 20 | 1976 | 66 |
| North Carolina | 65.2 | 31 | 1917 | 62.1 |
| Arkansas | 67.4 | 38 | 1917 | 63.2 |
| Oklahoma | 66.9 | 38 | 1907 | 61.5 |
| Minnesota | 53.1 | 44 | 1907 | 44.3 |
| Tennessee | 65.2 | 44 | 1917 | 60.2 |
| Virginia | 62.6 | 44 | 1917 | 58.4 |
| Missouri | 63.5 | 50 | 1924 | 58 |
| Missouri | 63.5 | 50 | 1917 | 58 |
| West Virginia | 60.4 | 55 | 1997 | 54.3 |
| Iowa | 59.2 | 56 | 1907 | 52.7 |
| Nebraska | 58.4 | 57 | 1935 | 51.8 |
| North Dakota | 53.2 | 57 | 1907 | 43.3 |
| Kansas | 63.2 | 58 | 1917 | 56.7 |
| South Dakota | 55.7 | 58 | 1907 | 47.9 |
| Texas | 72.5 | 58 | 1907 | 67.3 |
| Kentucky | 64.6 | 59 | 1917 | 58.1 |
| Wisconsin | 55 | 61 | 1907 | 46.9 |
| New Jersey | 60.6 | 63 | 1917 | 53.5 |
| Maryland | 62.6 | 68 | 1967 | 56.5 |
| Maryland | 62.6 | 68 | 1917 | 56.5 |
| Colorado | 53.2 | 70 | 1917 | 45.4 |
| Pennsylvania | 59.1 | 72 | 1967 | 51 |
| Illinois | 63.7 | 75 | 1917 | 55.9 |
| Nevada | 56.7 | 75 | 1896 | 47 |
| Utah | 56.8 | 75 | 1917 | 49.1 |
| Connecticut | 58.3 | 76 | 1917 | 49.8 |
| Maine | 52.5 | 80 | 1967 | 44.3 |
| Michigan | 55.9 | 80 | 1907 | 44.7 |
| Montana | 52.9 | 80 | 1916 | 46.4 |
| Montana | 52.9 | 80 | 1927 | 46.4 |
| New Hampshire | 55.2 | 82 | 1917 | 45 |
| New Mexico | 61.6 | 83 | 1917 | 52.4 |
| Massachusetts | 57.6 | 84 | 1917 | 48.8 |
| Oregon | 54.2 | 84 | 1933 | 47.9 |
| Wyoming | 51.5 | 85 | 1917 | 43.2 |
| Delaware | 64.3 | 87 | 1917 | 56.2 |
| Idaho | 53.1 | 88 | 1896 | 45.5 |
| Arizona | 67.8 | 90 | 1917 | 58.6 |
| Rhode Island | 57.8 | 90 | 1917 | 48.1 |
| Vermont | 55.8 | 90 | 1917 | 44.8 |
| Washington | 55.5 | 91 | 1955 | 49.4 |
| New York | 57.4 | 93 | 1917 | 46.9 |
| Indiana | 64.4 | 94 | 1917 | 54.7 |
| Ohio | 63.1 | 95 | 1917 | 53.4 |
| California | 65.3 | 99 | 1933 | 56.1 |
What a brutal Spring. in the USA according to the NOAA.
Look at all those single digit rankings. Rank: (1 = Coldest and 119 = Warmest)
3rd coldest Spring out of 119 in Minnesota.
4th coldest in North and South Dakota. 5th coldest in Arkansas.
This should not be possible if AGW was real.
| State | Spring_2013 | Spring Rank | Coldest Spring | Coldest Spring F |
| Minnesota | 35.9 | 3 | 1950 | 34.43 |
| North Dakota | 33.83 | 4 | 1899 | 31.33 |
| South Carolina | 59.3 | 4 | 1960 | 58.87 |
| Arkansas | 57.33 | 5 | 1960 | 56.47 |
| Alabama | 60.1 | 6 | 1960 | 59.07 |
| Georgia | 60.67 | 6 | 1960 | 59.77 |
| Mississippi | 60.53 | 6 | 1960 | 59.97 |
| Iowa | 43.87 | 7 | 1960 | 42.83 |
| Louisiana | 63.7 | 7 | 1931 | 61.9 |
| Missouri | 51.17 | 7 | 1960 | 49.77 |
| North Carolina | 55.93 | 7 | 1960 | 54.9 |
| Tennessee | 54.9 | 8 | 1960 | 52.93 |
| South Dakota | 40.23 | 9 | 1950 | 37.6 |
| Wisconsin | 38.8 | 9 | 1950 | 37.3 |
| Oklahoma | 56.27 | 11 | 1924 | 54.3 |
| Kansas | 50.5 | 12 | 1924 | 48.3 |
| Florida | 68.1 | 13 | 1931 | 66.4 |
| Kentucky | 52.8 | 14 | 1960 | 50.53 |
| Nebraska | 44.9 | 16 | 1917 | 42.97 |
| Illinois | 49.17 | 19 | 1960 | 46.6 |
| Virginia | 53.03 | 34 | 1960 | 51.03 |
| West Virginia | 49.87 | 34 | 1960 | 46.8 |
| Michigan | 40.97 | 39 | 1950 | 37.6 |
| Michigan | 40.97 | 39 | 1940 | 37.6 |
| Indiana | 50.03 | 40 | 1960 | 46.53 |
| Texas | 64.2 | 40 | 1931 | 60.13 |
| Colorado | 42.73 | 42 | 1917 | 37.23 |
| Montana | 40.57 | 45 | 1917 | 35.5 |
| Maryland | 51.77 | 50 | 1940 | 48.63 |
| Wyoming | 39.67 | 57 | 1917 | 32.37 |
| Ohio | 49.5 | 58 | 1926 | 45.07 |
| Pennsylvania | 47.47 | 62 | 1984 | 43.57 |
| New Jersey | 50.3 | 63 | 1940 | 46.27 |
| Connecticut | 47.1 | 71 | 1967 | 42.13 |
| New York | 43.83 | 75 | 1926 | 38.57 |
| Delaware | 53.33 | 76 | 1940 | 48.63 |
| Utah | 47.8 | 76 | 1917 | 39.47 |
| Massachusetts | 46.17 | 77 | 1967 | 40.97 |
| Washington | 48.07 | 82 | 1955 | 41.5 |
| Oregon | 47.4 | 83 | 1917 | 42 |
| Idaho | 43.97 | 85 | 1917 | 36.17 |
| Rhode Island | 47.5 | 85 | 1917 | 40.97 |
| New Mexico | 53.47 | 92 | 1917 | 47.53 |
| Maine | 40.83 | 93 | 1926 | 33.7 |
| Vermont | 42.67 | 94 | 1926 | 34.03 |
| Nevada | 49.93 | 97 | 1917 | 41.17 |
| New Hampshire | 43.43 | 98 | 1926 | 35.4 |
| Arizona | 60.87 | 108 | 1917 | 52.4 |
| California | 60.13 | 113 | 1917 | 52.37 |
The NOAA ranked May 2013 80th out of 119. Which means 39 other Mays were warmer.
Here they are: 1896,1897,1900,1902,1911,1914,1922,1928,1934,1936,1937,1939,1941,1944,1949,1955,1956,1958,1962,1964,1969,1970,1977,1985,1986,1987,1988,1991,1992,1996,1998,2000,2001,2003,2004,2006,2007,2009,2012
May of 2013 was 3.5F colder than 1934 and even 1.24F colder than 1896.
May in the USA has been cooling at -0.55F per decade.

Arctic Sea Ice Extent 800,000 sq km Higher Than 2010 and Only 130,000 sq km Below Average
Red Line is 2013. Blue Line is 2010 which had the lowest sea ice for this day
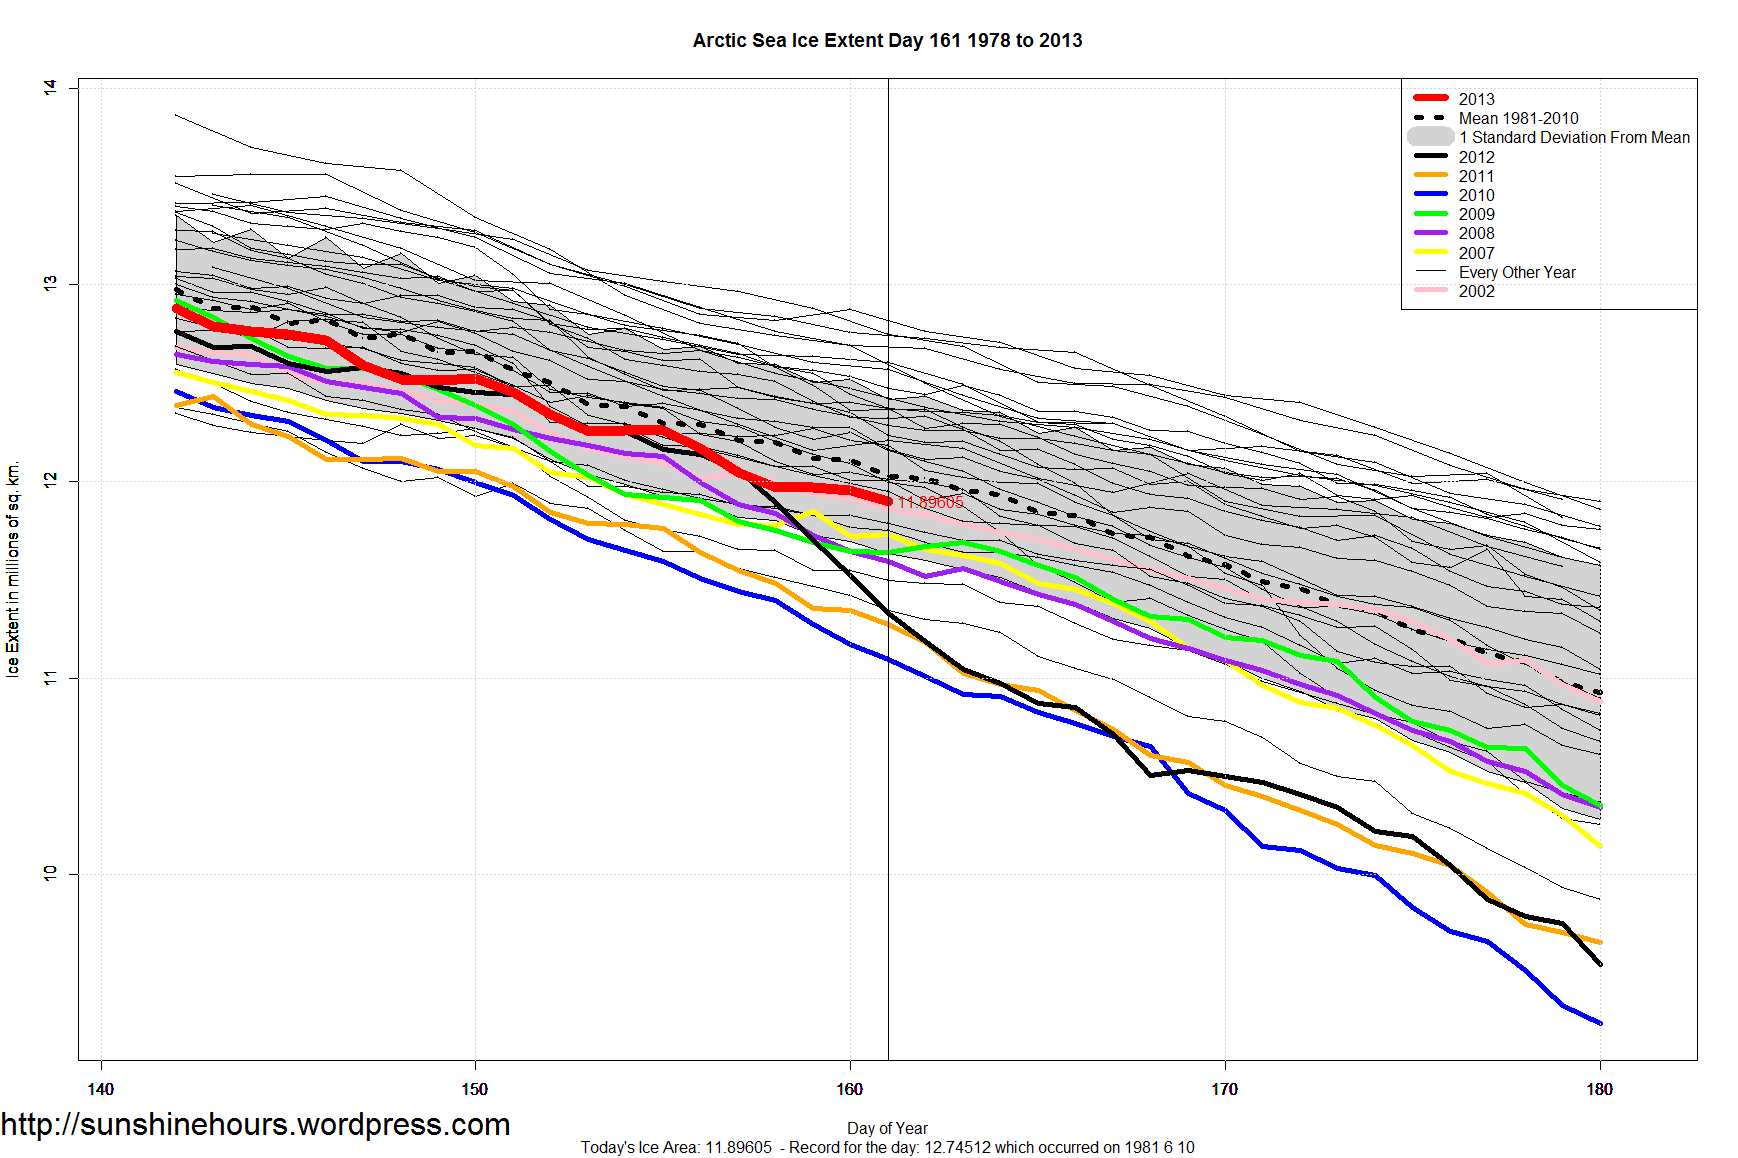
The Arctic Sea Ice Extent stubbornly is refusing to die in the alleged “Death Spiral”.

Update: See bottom map for fun.
Using the stations in Canada with Environment Canada calculated anomalies, here is the month of May visualized using the mean temperature for each station for each day.
You might have to click on the image or refresh the page to restart it.
The black circle in the top left corner represents a 5 Celsius anomaly from the 1971-2000 average.
Blue are below normal. Red above.
I thought I would map just the stations that were exactly average just for fun:
Doesn’t this sound ominous! “ice” retreat” has “sharply accelerated since 2004”.
“Across the Canadian Arctic Archipelago, widespread ice retreat during the 20th century has sharply accelerated since 2004.
In Sverdrup Pass, central Ellesmere Island, rapid glacier retreat is exposing intact plant communities
whose radiocarbon dates demonstrate entombment during the Little Ice Age (1550–1850 AD).”
Except …. doesn’t that mean the plant communities were thriving before 1550?
And that means the Medieval Warm Period existed. And that current ice melt is just a return to normal?
(h/t The Climate Scam)
http://www.pnas.org/content/early/2013/05/22/1304199110.abstract
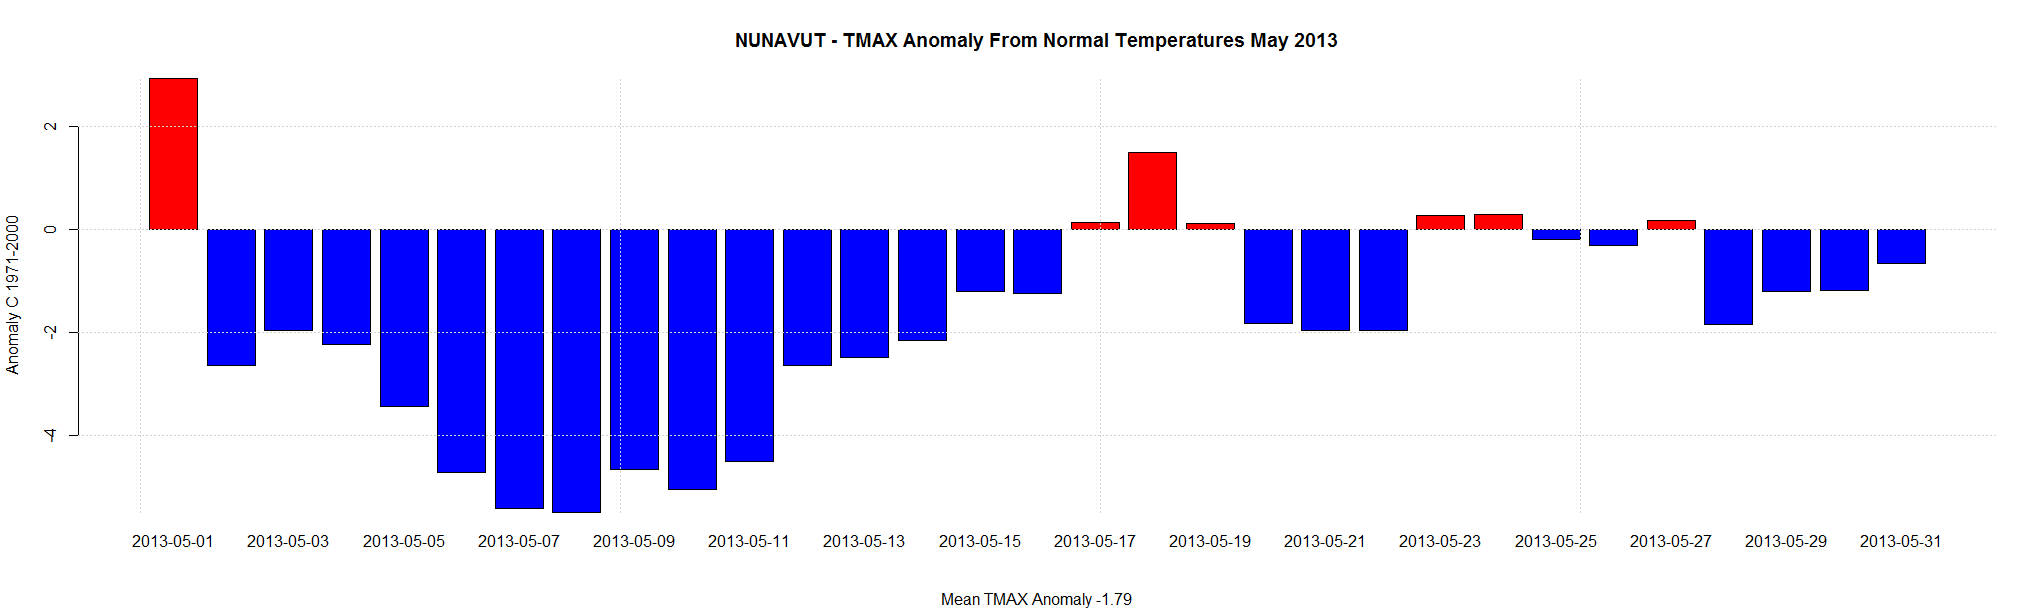
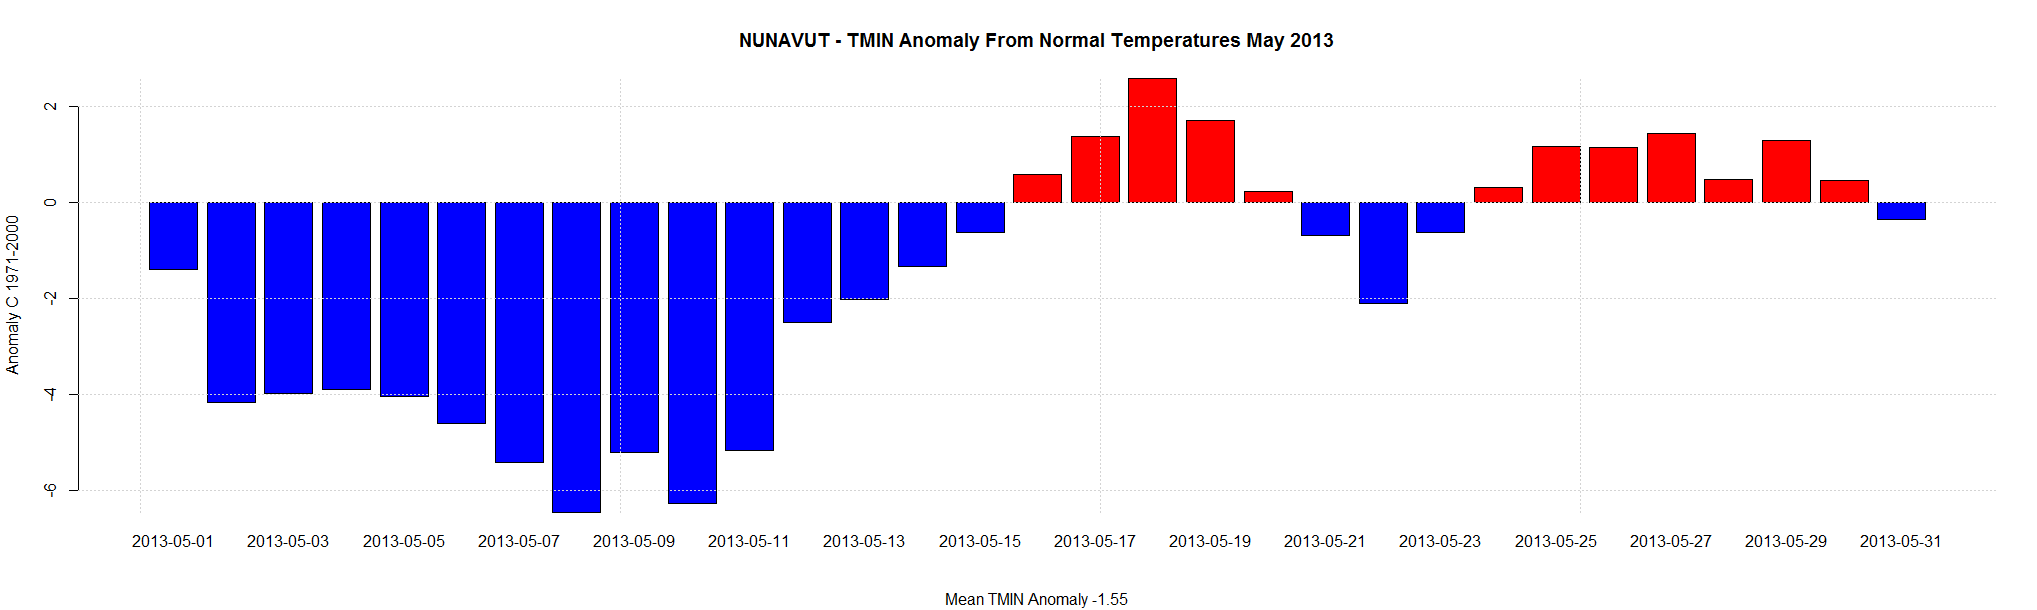
Nunavut (northern Canada) was the coldest Province/Territory in May.
Environment Canada calculates “Normals” for a subset of stations. Those are the anomalies from the 1971-2000 average.
The following barplots are of the daily anomalies (TMax and TMin) for each Nunavut station (that have Normals) averaged together.
The coldest part of the month was 6 to 7C below the 1971-2000 average. So much for the overheating Arctic.
Environment Canada calculates “Normals” for a subset of stations. Those are the anomalies from the 1971-2000 average.
I just started using the daily data this month. (The monthly summaries have proven to be unreliable)
So … using stations with Normals, here are the 100 stations with the coldest TMIN anomalies.
| PROVINCE | Name | DATE | MINTEMP | NORMAL MINTEMP | anomaly MIN |
| MANITOBA | GILBERT PLAINS | 2013-05-02 | -15 | 0.5 | -15.5 |
| SASKATCHEWAN | CYPRESS HILLS | 2013-05-01 | -15.5 | -0.2 | -15.3 |
| MANITOBA | GILBERT PLAINS | 2013-05-03 | -12.5 | 0.7 | -13.2 |
| ONTARIO | WELLAND | 2013-05-14 | -6 | 7.2 | -13.2 |
| MANITOBA | COWAN | 2013-05-02 | -14 | -1 | -13 |
| MANITOBA | WASAGAMING | 2013-05-02 | -14.3 | -1.3 | -13 |
| ONTARIO | WELLAND | 2013-05-13 | -6 | 7 | -13 |
| NUNAVUT | CORAL HARBOUR A | 2013-05-10 | -25.4 | -13 | -12.4 |
| SASKATCHEWAN | KEY LAKE | 2013-05-01 | -15.5 | -3.1 | -12.4 |
| NUNAVUT | KUGLUKTUK A | 2013-05-01 | -27.9 | -15.5 | -12.4 |
| YUKON TERRITORY | SHINGLE POINT A | 2013-05-01 | -27.3 | -14.9 | -12.4 |
| NUNAVUT | BAKER LAKE A | 2013-05-09 | -24.3 | -12.1 | -12.2 |
| SASKATCHEWAN | LAST MOUNTAIN CS | 2013-05-11 | -8.8 | 3.4 | -12.2 |
| YUKON TERRITORY | SHINGLE POINT A | 2013-05-03 | -26.1 | -13.9 | -12.2 |
| SASKATCHEWAN | BROADVIEW | 2013-05-02 | -10.6 | 1.2 | -11.8 |
| YUKON TERRITORY | SHINGLE POINT A | 2013-05-06 | -24.2 | -12.4 | -11.8 |
| NUNAVUT | BAKER LAKE A | 2013-05-02 | -26.8 | -15.1 | -11.7 |
| SASKATCHEWAN | PELLY | 2013-05-02 | -12 | -0.6 | -11.4 |
| NUNAVUT | KUGLUKTUK A | 2013-05-07 | -24 | -12.8 | -11.2 |
| BRITISH COLUMBIA | FT STEELE DANDY CRK | 2013-05-01 | -10 | 1.1 | -11.1 |
| ALBERTA | HIGH LEVEL A | 2013-05-01 | -11.5 | -0.4 | -11.1 |
| MANITOBA | INDIAN BAY | 2013-05-12 | -7.5 | 3.6 | -11.1 |
| SASKATCHEWAN | QUAPPELLE 1 | 2013-05-10 | -7.5 | 3.4 | -10.9 |
| SASKATCHEWAN | DUVAL | 2013-05-01 | -8 | 2.8 | -10.8 |
| NUNAVUT | BAKER LAKE A | 2013-05-01 | -26.3 | -15.6 | -10.7 |
| ALBERTA | CRAIGMYLE | 2013-05-01 | -10 | 0.6 | -10.6 |
| YUKON TERRITORY | SHINGLE POINT A | 2013-05-20 | -17 | -6.4 | -10.6 |
| ALBERTA | VEGREVILLE | 2013-05-01 | -9.4 | 1.2 | -10.6 |
| NUNAVUT | CORAL HARBOUR A | 2013-05-09 | -23.9 | -13.4 | -10.5 |
| ALBERTA | KANANASKIS | 2013-05-01 | -11.5 | -1 | -10.5 |
| SASKATCHEWAN | CLAYDON | 2013-05-01 | -9 | 1.4 | -10.4 |
| ALBERTA | LETHBRIDGE CDA | 2013-05-01 | -8.3 | 2.1 | -10.4 |
| MANITOBA | PINAWA WNRE | 2013-05-12 | -6.5 | 3.9 | -10.4 |
| NORTHWEST TERRITORIES | FORT SMITH A | 2013-05-01 | -11.9 | -1.6 | -10.3 |
| SASKATCHEWAN | INDIAN HEAD CDA | 2013-05-01 | -9 | 1.3 | -10.3 |
| SASKATCHEWAN | BEECHY | 2013-05-11 | -6.5 | 3.7 | -10.2 |
| SASKATCHEWAN | STEWART VALLEY | 2013-05-01 | -8 | 2.1 | -10.1 |
| MANITOBA | HODGSON 2 | 2013-05-02 | -10.5 | -0.5 | -10 |
| ONTARIO | KINGSVILLE MOE | 2013-05-13 | -1 | 9 | -10 |
| NUNAVUT | KUGLUKTUK A | 2013-05-08 | -22.4 | -12.4 | -10 |
| SASKATCHEWAN | LANGENBURG | 2013-05-02 | -9 | 1 | -10 |
| SASKATCHEWAN | MUENSTER | 2013-05-11 | -6.5 | 3.5 | -10 |
| SASKATCHEWAN | REGINA INTL A | 2013-05-01 | -8.4 | 1.6 | -10 |
| NUNAVUT | CAMBRIDGE BAY A | 2013-05-02 | -29.3 | -19.4 | -9.9 |
| ONTARIO | KINGSVILLE MOE | 2013-05-25 | 1.5 | 11.4 | -9.9 |
| ONTARIO | ST THOMAS WPCP | 2013-05-25 | -0.5 | 9.4 | -9.9 |
| SASKATCHEWAN | CORONACH | 2013-05-11 | -6.5 | 3.3 | -9.8 |
| SASKATCHEWAN | CORONACH SPC | 2013-05-11 | -6.5 | 3.3 | -9.8 |
| NUNAVUT | KUGLUKTUK A | 2013-05-04 | -23.9 | -14.1 | -9.8 |
| MANITOBA | MCCREARY | 2013-05-02 | -8.4 | 1.4 | -9.8 |
| ONTARIO | NEW GLASGOW | 2013-05-27 | 0.5 | 10.3 | -9.8 |
| SASKATCHEWAN | PARKERVIEW | 2013-05-02 | -8 | 1.8 | -9.8 |
| MANITOBA | PINAWA WNRE | 2013-05-03 | -8 | 1.8 | -9.8 |
| SASKATCHEWAN | SWIFT CURRENT CDA | 2013-05-01 | -8 | 1.8 | -9.8 |
| ALBERTA | COLD LAKE A | 2013-05-01 | -8.1 | 1.6 | -9.7 |
| SASKATCHEWAN | KEY LAKE | 2013-05-08 | -11 | -1.3 | -9.7 |
| SASKATCHEWAN | OUTLOOK PFRA | 2013-05-11 | -5.7 | 4 | -9.7 |
| ONTARIO | FOLDENS | 2013-05-25 | 0 | 9.6 | -9.6 |
| MANITOBA | HODGSON 2 | 2013-05-12 | -8 | 1.6 | -9.6 |
| SASKATCHEWAN | PARKERVIEW | 2013-05-01 | -8 | 1.6 | -9.6 |
| SASKATCHEWAN | BUFFALO POUND LAKE | 2013-05-01 | -7.5 | 2 | -9.5 |
| NUNAVUT | RESOLUTE CARS | 2013-05-10 | -26.1 | -16.6 | -9.5 |
| SASKATCHEWAN | BROADVIEW | 2013-05-01 | -8.4 | 1 | -9.4 |
| NUNAVUT | CAMBRIDGE BAY A | 2013-05-06 | -26.9 | -17.5 | -9.4 |
| ALBERTA | LLOYDMINSTER A | 2013-05-01 | -8.2 | 1.2 | -9.4 |
| ONTARIO | NEW GLASGOW | 2013-05-25 | 0.5 | 9.9 | -9.4 |
| MANITOBA | THOMPSON A | 2013-05-01 | -13.5 | -4.1 | -9.4 |
| SASKATCHEWAN | CORONACH | 2013-05-01 | -8 | 1.3 | -9.3 |
| MANITOBA | CROSS LAKE JENPEG | 2013-05-02 | -10.2 | -0.9 | -9.3 |
| SASKATCHEWAN | MANKOTA | 2013-05-01 | -8.7 | 0.6 | -9.3 |
| MANITOBA | WASAGAMING | 2013-05-01 | -10.9 | -1.6 | -9.3 |
| SASKATCHEWAN | BUFFALO POUND LAKE | 2013-05-02 | -7 | 2.2 | -9.2 |
| BRITISH COLUMBIA | FT STEELE DANDY CRK | 2013-05-02 | -8 | 1.2 | -9.2 |
| SASKATCHEWAN | LAST MOUNTAIN CS | 2013-05-02 | -7.6 | 1.6 | -9.2 |
| SASKATCHEWAN | ROCK POINT | 2013-05-01 | -7 | 2.2 | -9.2 |
| ONTARIO | CHAPLEAU A | 2013-05-13 | -7.1 | 2 | -9.1 |
| MANITOBA | FLIN FLON | 2013-05-01 | -8.5 | 0.6 | -9.1 |
| SASKATCHEWAN | MUENSTER | 2013-05-01 | -7.5 | 1.6 | -9.1 |
| ONTARIO | NEW GLASGOW | 2013-05-26 | 1 | 10.1 | -9.1 |
| SASKATCHEWAN | REGINA INTL A | 2013-05-11 | -5.4 | 3.7 | -9.1 |
| NUNAVUT | BAKER LAKE A | 2013-05-08 | -21.5 | -12.5 | -9 |
| NUNAVUT | CAMBRIDGE BAY A | 2013-05-03 | -27.9 | -18.9 | -9 |
| SASKATCHEWAN | QUAPPELLE 1 | 2013-05-01 | -7.5 | 1.5 | -9 |
| BRITISH COLUMBIA | CASTLEGAR A | 2013-05-01 | -4.7 | 4.2 | -8.9 |
| MANITOBA | GILBERT PLAINS | 2013-05-23 | -4 | 4.9 | -8.9 |
| ONTARIO | HARTINGTON IHD | 2013-05-24 | 0 | 8.9 | -8.9 |
| SASKATCHEWAN | LAST MOUNTAIN CS | 2013-05-01 | -7.5 | 1.4 | -8.9 |
| MANITOBA | PILOT MOUND (AUT) | 2013-05-12 | -4.9 | 4 | -8.9 |
| NUNAVUT | CAMBRIDGE BAY A | 2013-05-04 | -27.2 | -18.4 | -8.8 |
| MANITOBA | CROSS LAKE JENPEG | 2013-05-01 | -10 | -1.2 | -8.8 |
| MANITOBA | GRAND RAPIDS HYDRO | 2013-05-24 | -4 | 4.8 | -8.8 |
| MANITOBA | ARBORG | 2013-05-02 | -8 | 0.7 | -8.7 |
| NUNAVUT | BAKER LAKE A | 2013-05-06 | -22.1 | -13.4 | -8.7 |
| NUNAVUT | CORAL HARBOUR A | 2013-05-08 | -22.5 | -13.8 | -8.7 |
| NUNAVUT | BAKER LAKE A | 2013-05-10 | -20.3 | -11.7 | -8.6 |
| ALBERTA | EDMONTON STONY PLAIN | 2013-05-01 | -6 | 2.6 | -8.6 |
| QUEBEC | LASSOMPTION | 2013-05-14 | -2.1 | 6.5 | -8.6 |
| ONTARIO | OTTAWA CDA | 2013-05-14 | -0.9 | 7.7 | -8.6 |
| ONTARIO | KAPUSKASING A | 2013-05-25 | -4.6 | 3.9 | -8.5 |
| NUNAVUT | KUGLUKTUK A | 2013-05-03 | -23.1 | -14.6 | -8.5 |
