Climatologists Are No Einsteins

Understatement of the Decade.

Freeman Dyson:

“I just think they don’t understand the climate,” he said of climatologists. “Their computer models are full of fudge factors.”

“The models are extremely oversimplified,” he said. “They don’t represent the clouds in detail at all. They simply use a fudge factor to represent the clouds.”

William Happer:

“There are people who just need a cause that’s bigger than themselves,” said Happer. “Then they can feel virtuous and say other people are not virtuous.”

That reminds of the joke Judith Curry deleted from her blog the other day:

Q: Why did god invent phrenologists?

A: So climate scientists would have a profession to look down upon.

Canada March 2013 – Really Cold in the Middle

According to the Environment Canada “Normals” (the stations EC calculates anomalies for) , Canada was colder than the 1971-2000 average in March 2013.

The mean of all the “Normals” was -.55C colder than 1971-2000 average.

If you look in the top left corder of the anomaly map and note the black circle represents 5C anomalies. Blue is colder than normal. Red is warmer.

The middle of the country was really, really cold. The warmth was concentrated in the far east and a couple of arctic stations.

And many of the stations had values too small to really show up on the map.

The anomaly map for Mar 2013 follows. Click to make it bigger.

EC Normals 0x0 2013-03

Where do I get the data? From Environment Canada monthly summaries.

The URL for March 2013 BC data is here. You can replace BC with ALL or SASK of MAN etc.

I use the data with a D column  value because EC calculates the anomalies for me. And because they are supposed to be better/long stations.

HADCRUT4 Gridded Feb 2013 – Europe was COLDER than 1961-1990!!!

Using HADCRUT4 Gridded data for Feb 2013 , I thought it would be useful to map the 5×5 grid squares colder than 1961-1990.

For some strange reason HADCRUT4 uses the archaic 1961-1990 period as the baseline, rather than the accepted 1981-2010.

Please click on the maps to make them bigger. And make sure you get them to go full size. I made them pretty big (3200 x 2000 pixels).

The number in the boxes is the temperature difference between the 1961-90 average and Feb 2013.

Notice that most of Western Europe was colder than 1961-1990!!!!!!!

Why only the cold squares? Because the HADCRUT4 page colr choices tends to minimize the cold areas. And because I can.

HAD4_Grid_February_2013_v2

Warming In The Arctic Has Happened Before – Cambridge Bay Nunavut

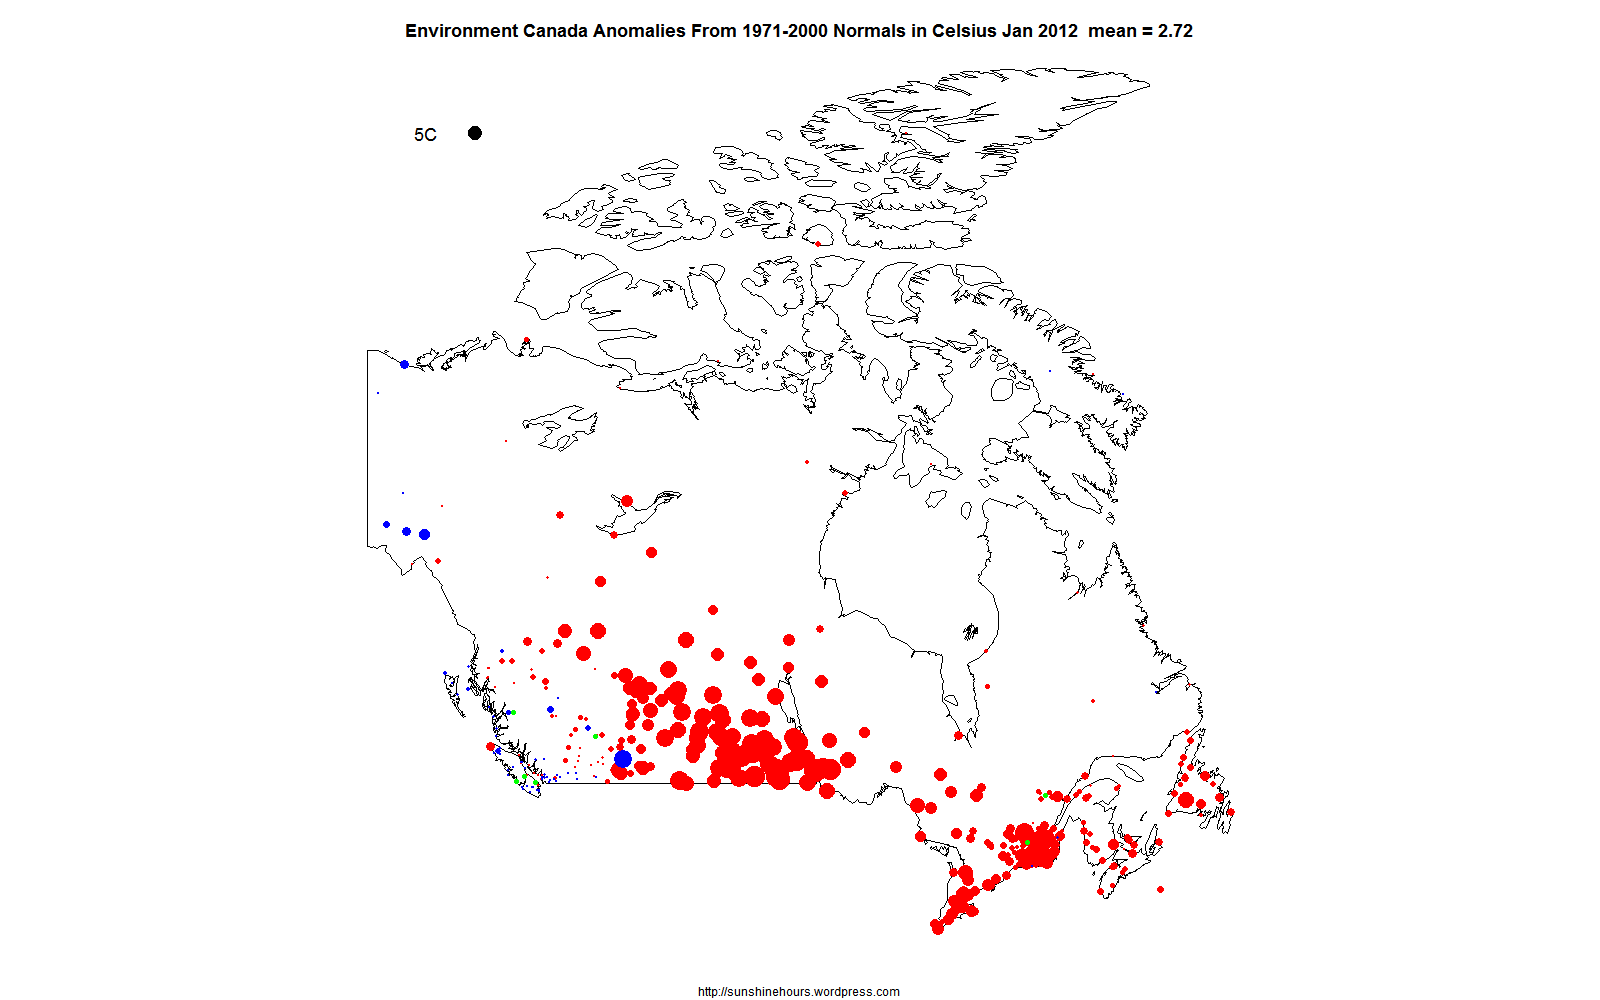
Some blogger named David Appell was sounding the AGW alarm yesterday (for the millionth time I think)  about dangerous Arctic Greening.

Aside from the fact that greening is probably a good thing and that greening may be caused by more CO2 (a plant food) and not necessarily warming I also thought I would take a look at some Environment Canada weather stations in the north.

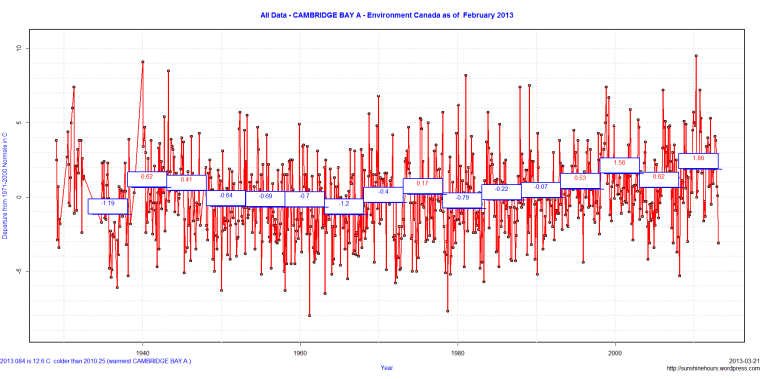
One of the stations with a long data record is Cambridge Bay Airport in Nunavut. The temperature anomalies are in relation to the 1971 – 2000 average.

The temperature in the boxes is the 5 year average. While it is true the temperature is 2.5C or so warmer than around 1980, it is also true it is only 1.2C warmer than around 1940. And who knows if the 20s or 30s were warmer or colder? Not enough data.

Do note that around 1965 it was 1.8C colder than the 1930s/40s.

Click to enlarge.

All Data - CAMBRIDGE BAY A - Environment Canada as of  February 2013

Since the latest data is from February, I thought I would show the warmest and coldest February’s for Cambridge Bay Airport.

Notice that 1931 was 4th warmest. 1941 and 1940 and 1929 made the top 11. etc/

Top 25 Warmest February’s

year Anomaly
1989 7.5
2006 7.2
1980 6.2
1931 6
1978 5.7
2012 5.3
2010 5
1941 3.8
1940 3.4
1969 3.2
1929 2.5
1986 2.5
2011 2.5
1935 2.4
1953 2.4
1984 2.1
2001 2.1
1963 2
2000 1.8
1981 1.7
1996 1.7
2007 1.7
1999 1.6
1945 1.5
2009 1.4

February 2013 was 3.1C below the 1971-2000 average. And 17th coldest.

Top 25 Coldest February’s

year Anomaly
1958 -6.3
1972 -5.8
1955 -5.2
1979 -5.2
1990 -5.2
1949 -5
1936 -4.9
1965 -4.6
1983 -4.4
1946 -4.3
1951 -4.2
1967 -3.9
1962 -3.7
1985 -3.6
1942 -3.5
1957 -3.1
2013 -3.1
1974 -2.8
1977 -2.8
1952 -2.7
1956 -2.7
2008 -2.7
1950 -2.3
1966 -2.3
1937 -2

Arctic Sea Ice Extent Only 1.4% Lower Than 1981-2010 Mean

Did you know that the Arctic Sea Ice Extent is only 1.4% lower than the 1981 – 2010 mean?

NSIDC data says that on March 19 (day 78) Arctic Sea Ice Extent was 15.09 million sq km. The mean for 1981-2010 for day 78 is 15.30 million sq km.

Wow. Only 1.4% below normal. Has that made the news?


Arctic_Sea_Ice_Extent_Anomaly_Pct

Arctic Data from here.

8th Antarctic Sea Ice Extent Daily Record For 2013 – 5th in a row

Day 73 (March 14) had Antarctic Sea Ice Extent set its 8th daily record – the 5th in a row.

2013 broke the old record from 2008 by 32,420 sq km.  2008 had broken the previous record (2001) by 240,070 sq km.

2008 was an amazing year for Antarctic Sea Ice. Did you know that on day 1 in 2008, the old record was broken by 1,391,120 sq km which had occurred in 1996?

Too bad the NSIDC “scientists” ignore Antarctica. It would have made a great story.


Antarctic_Sea_Ice_Extent_Zoomed_2013_Day_73_1981-2010

Canada Feb 2013

According to the Environment Canada “Normals”, Canada was warmer than the 1971-2000 average in Feb 2013.

The warmth was concentrated in the far west and the far east.

The middle was slightly warmer or slightly cooler. And the Arctic was mostly cooler than normal.

The anomaly map for Feb 2013 and an animated gif of Jan 2012 to Feb 2013. Click to make them bigger.

EC Normals 0x0 2013-02


EC_0x0_Map_Jan2012-Feb2013

Vancouver and Victoria Airports in BC Colder Thans 1940s/1960s

The next two graphs are anomaly data from Environment Canada up to Feb 2013. The data in the boxes is the 5 year average. Red for warmer than 1971-2000, blue for colder.

For Victoria, the last 5 years have been only .06C warmer than the 1971-2000 average. More importantly, it is the coldest 5 year period in the last 25 years. And colder than the period around 1960.  And it would probably be colder than the 1940s if the data went back that far,

For Vancouver, the last 5 years have been only .18C warmer than the 1971-2000 average. More importantly, it is the coldest 5 year period in the last 25 years. And colder than the period around 1960.  And colder than the 5 year period around 1940 .

Click to enlarge.

All Data - VICTORIA INTL A - Environment Canada as of  February 2013

All Data - VANCOUVER INTL A - Environment Canada as of  February 2013