NOAA – 184 Low Min Records Broken From Aug 1 to Aug 21. Some records demolished by 11F

184 Low Min Records Broken From Aug 1 to Aug 21 according to the NOAA.

Below is a screenshot showing location and the biggest difference between old record and new record.

Note that Stambaugh MI  has 91 years of data. And the record was demolished by 11F.

20F as a low on Aug 14. Wow.

LowMin_Aug_1_2014_to_Aug_21


NOAA – 1025 Low Max Records Broken From Aug 1 to Aug 21. Some records Smashed by 16F

1025 Low Max Records Broken From Aug 1 to Aug 21 according to the NOAA.

A “Low Max” means that the maximum temperatures for the day was the lowest it has ever been.

This indicates daytime cooling.

Below is a screenshot showing location and the biggest difference between old record and new record.

Note that Dyer NV has 111 years of data. And the record was smashed by 16F.

LowMax_Aug_1_2014_to_Aug_21


63% of Plants Prefer It To Be Warmer!!!!!!!

This is huge. And logical. Only idiots thought plants prefer freezing to death.

“Not all species flee rising temperatures. As the mercury has inched upward across western North America over the last 40 years, many plant species have moved downhill, toward—not away from—warmer climates, according to the results of a new study.

The finding adds to growing evidence that temperature isn’t the only factor influencing how Earth’s life will respond to climate change.”


Isn’t that last sentence hilarious? “Temperature isn’t the only factor …’ Well DUH! But unfortunately the AGW cult has twisted science so much that many are surprised that plants might like it warmer than colder.


“The results of the analysis were unexpected. More than 60% of plants shifted their distributions downward, toward warmer, lower elevations—despite significant climate warming across the regions under study, the team reported online on 24 July in Global Change Biology. Even more striking, all plants within a region—regardless of species—moved in the same direction.”

What a shocker eh? Given a choice between the cold of the 1970s, plants like it warmer. Who would have thought? …. Only people with a brain thought that!

http://www.thegwpf.org/plants-have-unexpected-response-to-climate-change/

http://onlinelibrary.wiley.com/doi/10.1111/gcb.12697/abstract

NOAA USA January – 67 January’s Were Warmer

According to the NOAA, January was only the 53rd warmest out of 120. That means 67 January’s (out of 120) were warmer.

The lower 48 states were pretty much divided right down the middle. Very cold in the east, warm in the west and normal in the states directly above Texas.

Alabama had its 4th coldest January in 120 years. It was -8.3F colder than normal. Minnesota was the coldest state, averaging 2.3F. Brrr. Only 52.3F colder than Florida.

Here are the maps of average temperature, rank out of 120 (120 = warmest) and temperature anomaly from 1901-2000

Average Temperature in F

NOAA_JAN_2014_Map_Average_Temperature

Rank out of 120 (120 = warmest and 1 = coldest)

NOAA_JAN_2014_Map_Rank

Anomaly in F from 1901 – 2000 average.

NOAA_JAN_2014_Map_Anomaly

Extreme Weather Alert: Canada February 1936

The AGW cult likes to talk about “extreme weather” as if that is a new thing and all was nice and calm in the past before that evil CO2 came along. What a load of bull.

Inspired by my own post about 1930 temperatures  in Canada and Steven Goddards post about “extreme weather” in Montana in 1936,  I thought I should take a quick look at 1936.

Imagine you are in the middle of the worst 10 year heatwave ever in North America — the dust bowl — and along comes February 1936. The data in the graph below are monthly averages based on the 1971-2000 normals Canada uses.

The black dot in the top left hand corner is about 5C of difference above or below the normal for that month.

Of the 184 stations, 3 were above 0. 81 were more than -10C colder than normal. Animated gif of whole year at bottom. Click for bigger.

EC MonthlyNormalsTemperature1936-02

MonthlyNormals_1936

Stations More Than -15C below normal

Prov Stn_Name Anomaly
ALTA SION -21.5
ALTA MEDICINE HAT A -20.4
ALTA VIKING -19.6
ALTA FORT MACLEOD -19.4
ALTA BEAVER MINES -19.4
ALTA GLEICHEN -19.3
ALTA LETHBRIDGE CDA -19.3
ALTA CALMAR -19
ALTA CARDSTON -18.9
SASK BEECHY -18.9
SASK PENNANT -18.7
ALTA CALGARY INT’L A -18.4
ALTA HIGH RIVER -18.2
SASK ANEROID -18.2
SASK GRAVELBOURG -18.2
ALTA MANYBERRIES CDA -18
BC FORT ST JAMES -17.8
ALTA OLDS -17.8
ALTA PEKISKO -17.7
ALTA BROOKS AHRC -17.5
SASK TUGASKE -17.4
SASK SCOTT CDA -17.4
SASK YELLOW GRASS -17.3
ALTA BEAVERLODGE CDA -17.2
SASK CHAPLIN -17.2
BC ATLIN -17.1
MAN PIERSON -17.1
ALTA LACOMBE CDA -17
SASK REGINA A -16.9
SASK WASECA -16.9
YT MAYO A -16.7
ALTA CAMPSIE -16.7
BC BALDONNEL -16.6
ALTA FAIRVIEW -16.6
SASK HARRIS -16.6
ALTA RANFURLY -16.5
SASK MIDALE -16.5
SASK KLINTONEL -16.5
ALTA ENTRANCE -16.4
ALTA CALDWELL -16.2
ALTA ELK POINT -16
SASK NOKOMIS -16
SASK SASKATOON A -16
SASK BIGGAR -15.7
SASK DAVIDSON -15.5
SASK LUMSDEN -15.5
MAN DELORAINE -15.5
SASK MUENSTER -15.4
SASK INDIAN HEAD CDA -15.3
SASK REGINA CDA -15.2
SASK PILGER -15

Polar vortex killed at least 21

Brrrrrrrrrr.

“Authorities reported at least 21 cold-related deaths across the country since Sunday, including seven in Illinois and six in Indiana. At least five people died after collapsing while shoveling snow, while several victims were identified as homeless people who either refused shelter or didn’t make it to a warm haven soon enough.

In Missouri on Monday, a 1-year-old boy was killed when the car he was riding in struck a snow plow, and a 20-year-old woman was killed in a separate crash after her car slid on ice and into the path of a tractor-trailer.

In a phenomenon that forecasters said is actually not all that unusual, all 50 states saw freezing temperatures at some point Tuesday. That included Hawaii, where it was 18 degrees atop Mauna Kea, a dormant volcano.


Northern Hemisphere Winter Doom By Latitude Band

Winter temperatures in the Northern Hemisphere are dropping as much as 2.5C / decade over the last 7 years.

Yesterday my post was a look at the northern hemisphere by month over the last 7 years.

Today I am looking at the same time frame, but I am using the gridded HADCRUT4 data for Dec/Jan/Feb only. You will have to click on the image to get the full effect.

There are 7 latitude bands with yellow highlighting. The trend in those is from -.44C/decade to -2.49C/decade. And note the green 0 line. 0 is the 1961-1990 average, Anywhere the graph or trend crosses the green line it is colder than the 1961-1990 average. It was pretty cold in the 60s and 70s.

I wish I didn’t live in the 50th parallel.

Highlighted Dec Jan Feb HADCRUT4 By Latitude Band - Last 7 Years as of 2013-7


HADCRUT4 Northern Hemisphere Winter Doom

Do you live in the Northern Hemisphere.? Did anyone tell you that in the midst of record CO2 levels HADCRUT4 shows massively dropping winter temperatures?

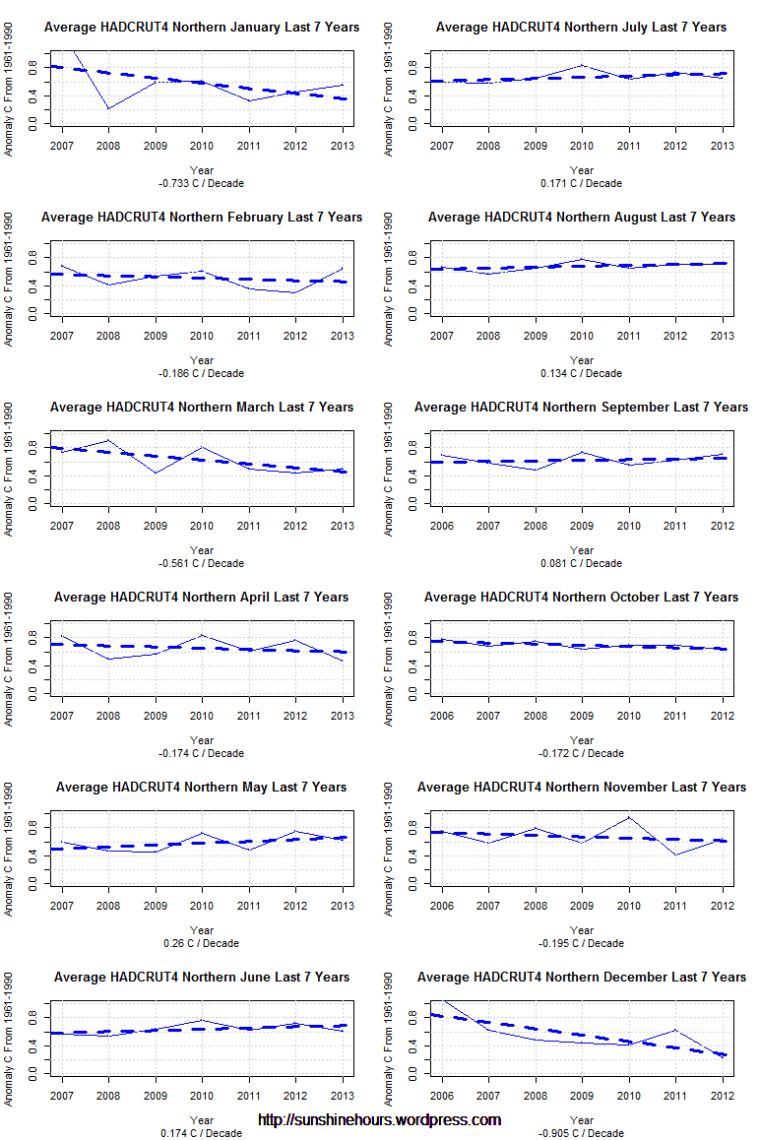
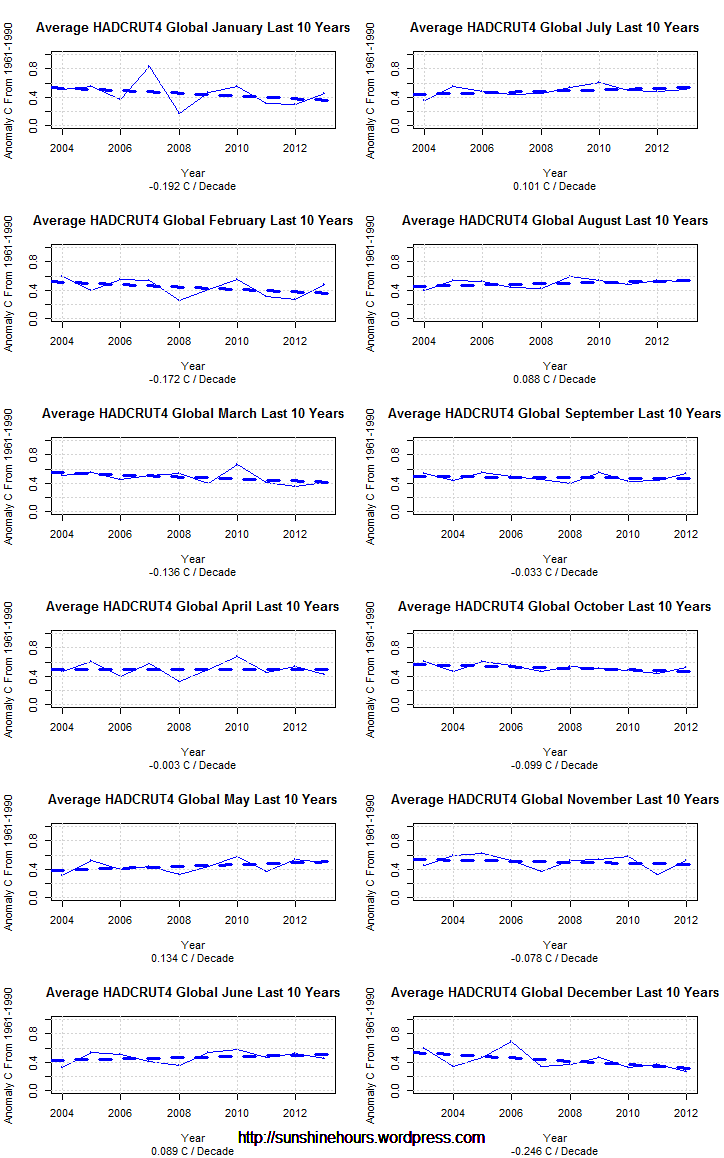
At the bottom of this post is a graph of HADCRUT4 Northern Hemisphere only temperatures for each month for the last 7 years.

Did you know December was cooling at -.9C per decade? By 2100 December could be 8C colder?

Did you know January was cooling at -.73C per decade?

Did you know March was cooling at -.56C per decade?

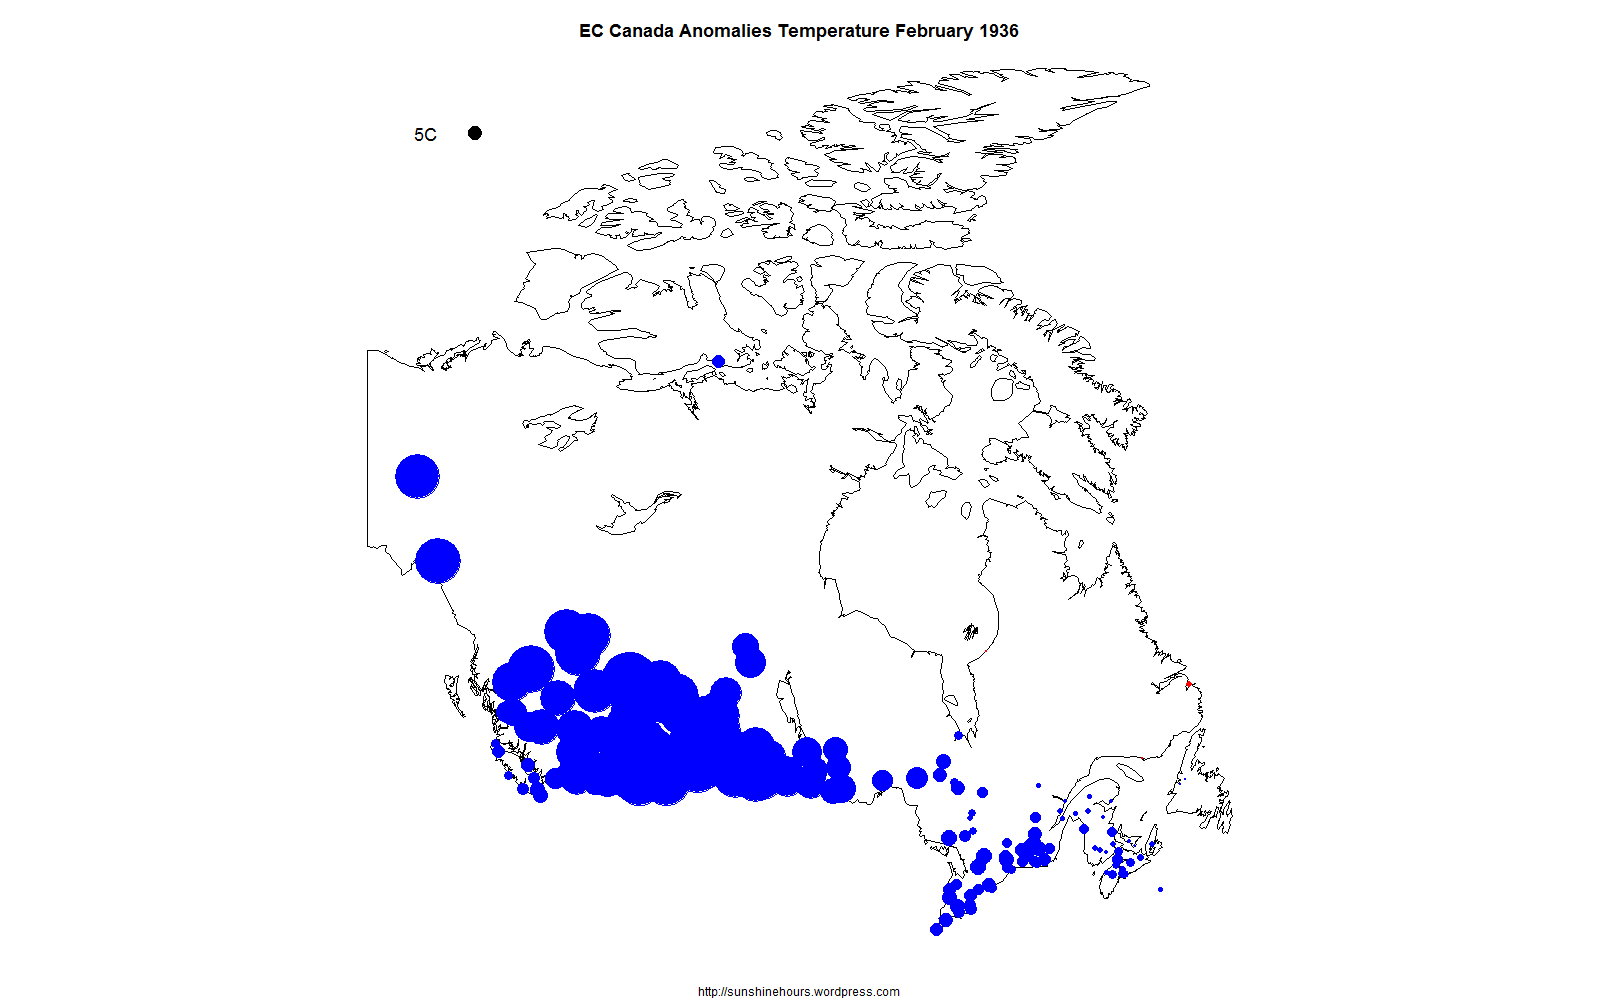
Did you know February was cooling at -.19C per decade?

Did you know November was cooling at -.2C per decade?

Did you know October was cooling at -.17C per decade?

Did you know April was cooling at -.17C per decade?

I’m glad I have a wood stove.

Average HADCRUT4 Northern  Last 7 Years