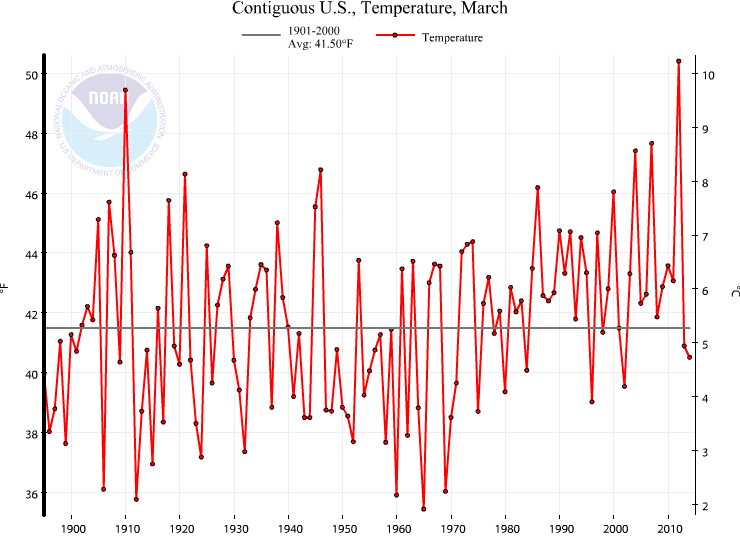
The graph is in thise post compares sea ice extent for just one day of each year – 138 to the AMO for the month day 138 is in – in this case May. There isn’t any AMO data for May 2014 yet.
AMO data comes from NOAA, Sea Ice data comes from NSIDC.
The red is the May AMO – Atlantic Multidecadal Oscillation. The blue is Antarctic Sea Ice Extent just for day 138.
The dashed lines are the liner trends for each.
Click on the graph for a larger size.

![cag_[ Statewide Precipitation Anomalies (accumulation between Mar 2014 and Apr 2014) ]](https://sunshinehours.net/wp-content/uploads/2014/05/cag_-statewide-precipitation-anomalies-accumulation-between-mar-2014-and-apr-2014.jpg)

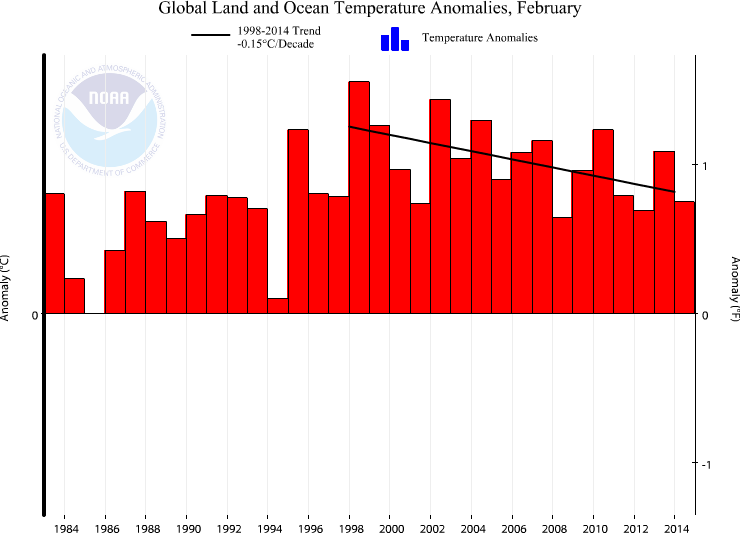
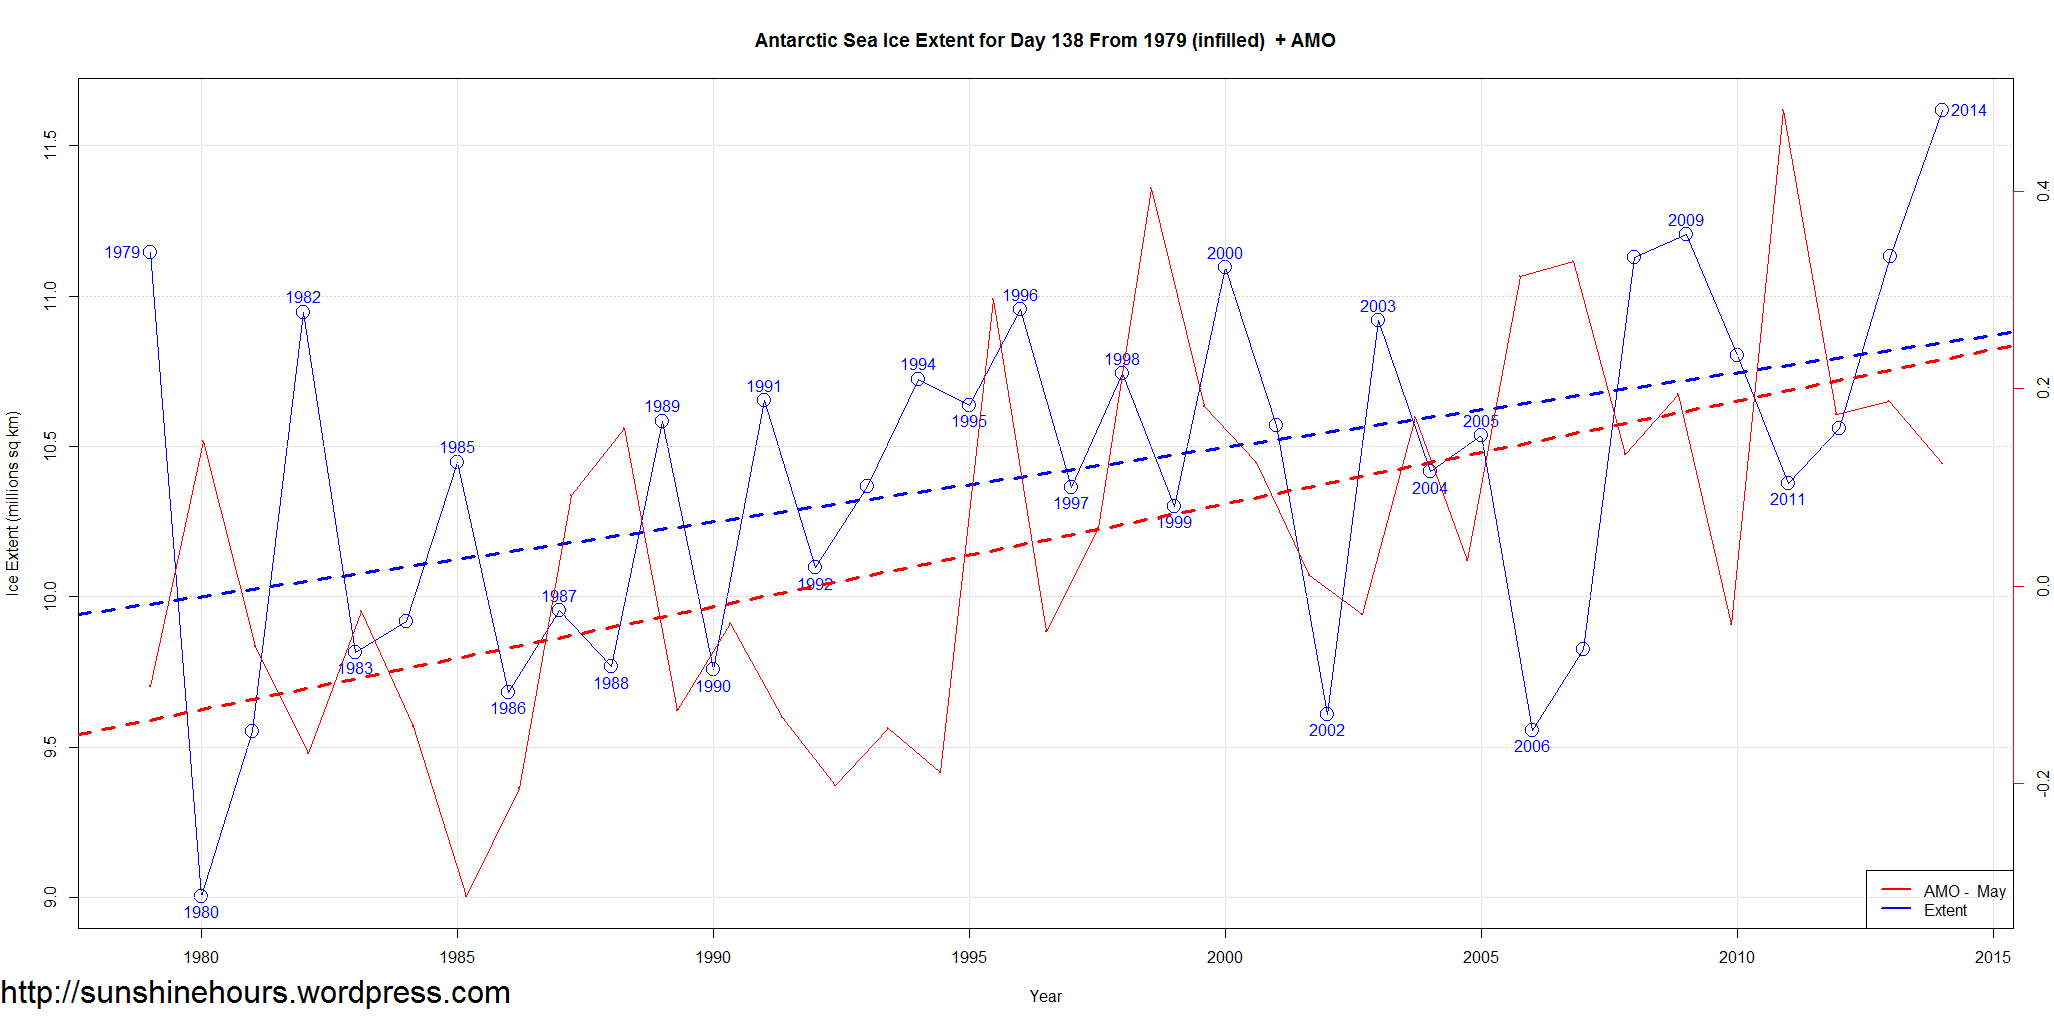
![cag_[ Statewide Temperature Anomalies (Feb 1936) ]](https://sunshinehours.net/wp-content/uploads/2014/04/cag_-statewide-temperature-anomalies-feb-1936.jpg)

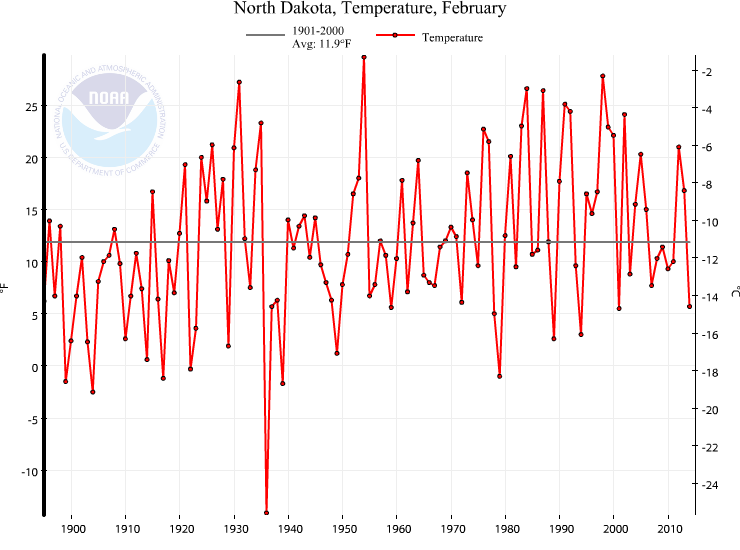
![cag_[ Statewide Temperature Anomalies (Feb 2014) ]](https://sunshinehours.net/wp-content/uploads/2014/04/cag_-statewide-temperature-anomalies-feb-2014.jpg)
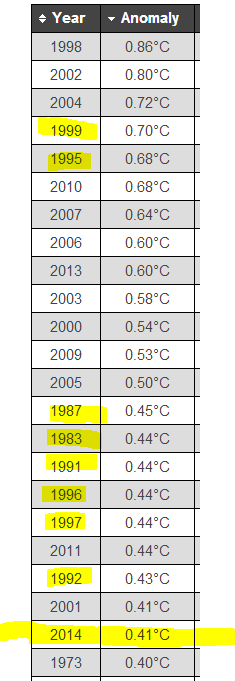
![cag_[ Divisional Temperature Anomalies (Mar 1910) ]](https://sunshinehours.net/wp-content/uploads/2014/04/cag_-divisional-temperature-anomalies-mar-1910.jpg)
![cag_[ Divisional Temperature Anomalies (Mar 2014) ]](https://sunshinehours.net/wp-content/uploads/2014/04/cag_-divisional-temperature-anomalies-mar-2014.jpg)
![cag_[ Divisional Temperature Anomalies (Mar 1934) ]](https://sunshinehours.net/wp-content/uploads/2014/04/cag_-divisional-temperature-anomalies-mar-1934.jpg)