NOAA USA October 2014 Max Temp – Tied For 8th With 1927! Only 1963,1947,1950,1953,1938,1934 and 2003 Were Hotter

Wow. According to the NOAA October 2014 was 8th Hottest Max Temperature.

Tied with 1927.

Only 1963, 1947, 1950, 1953, 1938, 1934 and 2003 Were Hotter.

October 1963 was 3.9F hotter. Sneaky global warming.

1963 73.47°F 120 6.67°F
1947 71.42°F 119 4.62°F
1950 70.72°F 118 3.92°F
1953 70.34°F 117 3.54°F
1938 70.00°F 116 3.20°F
1934 69.75°F 115 2.95°F
2003 69.71°F 114 2.91°F
1927 69.57°F 113 2.77°F
2014 69.57°F 113 2.77°F


NOAA_USA_2014_October_Maximum


HADCRUT4 1930 to 1949 by Month – Dangerous pre-CO2 Global Warming

HADCRUT4 1930 to 1949 by Month.

Normally you see this part of the graph with 2 or 3 red ticks because it is done annually.

Keep in mind the highest red tick is an anomaly of 0.355C for August 1945. The anomaly for August 2012 was 0.532C. Which is only 0.177C warmer. (Corrected)

Click to see bigger.

HADCRUT4 1930 to 1949

Canada – Dec 2012 – 25 Coldest Stations – Whitehorse was 13.2C colder than normal

Update: See comments. Whitehorse was closer to -7C  to -8C colder than normal. Still top 3 in Canada for December 2012.


These are the 25 coldest stations (of the ones Environment Canada thinks are worth calculating anomalies for) in Canada for Dec 2012. The anomaly is calculated from the 1971-2000 normals.

13.2C colder than normal for Whitehorse Airport. Yukon data scraped from here.

Any mention in the news? You would think it would make the news wouldn’t you?

Stn Name Prov Anomaly in C
WHITEHORSE A YT -13.2
MAYO ROAD YT -8.6
FORT ST JOHN A BC -8
CHETWYND A BC -6.6
GRANDE PRAIRIE A ALTA -6.6
ATLIN BC -6.3
WHITECOURT A ALTA -5.8
PEACE RIVER A ALTA -5.7
FORT SASKATCHEWAN ALTA -5.6
CAMPSIE ALTA -5.5
CRAIGMYLE ALTA -5.4
CAMROSE ALTA -5
TOFIELD NORTH ALTA -5
EDMONTON WOODBEND ALTA -4.9
GRAND RAPIDS HYDRO MAN -4.9
SIMONETTE ALTA -4.7
EDMONTON STONY PLAIN ALTA -4.6
HAY RIVER A NWT -4.5
DAKOTA WEST ALTA -4.3
PLEASANT CAMP BC -3.9
VEGREVILLE ALTA -3.9
COWAN MAN -3.9
FORESTBURG PLANT SITE ALTA -3.7
LAST MOUNTAIN CS SASK -3.7
KINDERSLEY A SASK -3.7

Are we cooling the planet with SO2?

Today I am going to ask a provocative question. Are we cooling the planet with Sulfur Dioxide (SO2)?

Cooling you might say? I thought we were warming? It could be that we are keeping the planet 4C cooler than it would have been (and still appear to be warming).

Sulfur dioxide “is the chemical compound with the formula SO2. It is a toxic gas with a pungent, irritating smell, that is released by volcanoes and in various industrial processes. ”

USGS: “The most significant climate impacts from volcanic injections into the stratosphere come from the conversion of sulfur dioxide to sulfuric acid, which condenses rapidly in the stratosphere to form fine sulfate aerosols. The aerosols increase the reflection of radiation from the Sun back into space, cooling the Earth’s lower atmosphere or troposphere. Several eruptions during the past century have caused a decline in the average temperature at the Earth’s surface of up to half a degree (Fahrenheit scale) for periods of one to three years. The climactic eruption of Mount Pinatubo on June 15, 1991, was one of the largest eruptions of the twentieth century and injected a 20-million ton (metric scale) sulfur dioxide cloud into the stratosphere at an altitude of more than 20 miles. ”

From 1850 to 1980 SO2 emissions rose from almost 0 to 140,000 Gigagrams per year in 1980 and then dropped down to 110,000 Gigagrams around 2000 and then it started to rise again as China began to burn a lot more coal.

Illustration from Atmos. Chem. Phys., 11, 1101–1116, 2011 pg 1107 Anthropogenic sulfur dioxide emissions: 1850–2005 S. J. Smith1, J. van Aardenne2,*, Z. Klimont3, R. J. Andres4, A. Volke1, and S. Delgado Arias1

Pinatubo released 20 million metric tons of SO2 into the atmosphere.

20 million metric tons = 20,000 Gigagrams.

Therefore, around 1980, humans were releasing the equivalent of 7 Pinatubo’s worth of SO2 each year into the atmosphere.

Seven Pinatubo’s per year!

Depending on which reference, the cooling of one Pinatubo = .5F or .5C or even .6C.

That would mean human produced SO2 should be cooling the earth by about 3.5C.

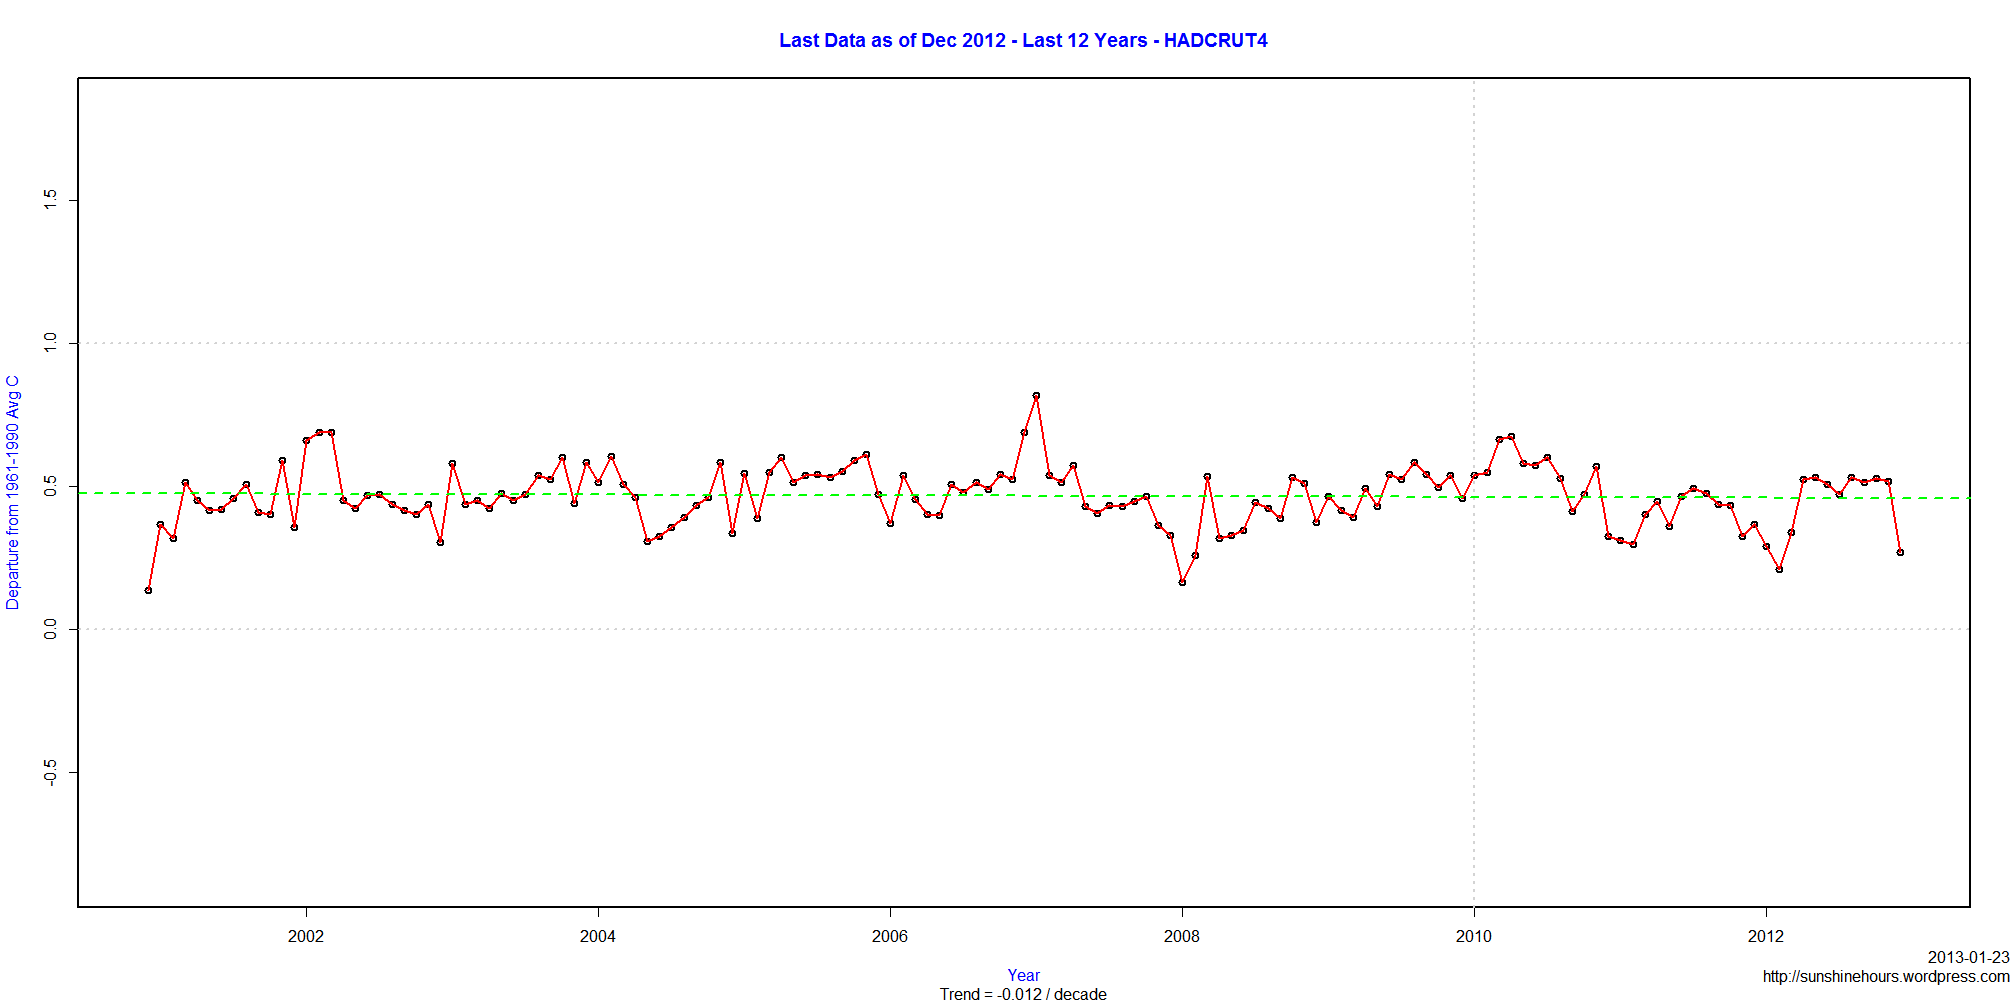
Yet temperature went up over .5C from 1980 to 2000.

Oh wait, SO2 went down from 1980 to 2000 the equivalent of one Pinatubo.

Could it be that if there was no human SO2 in the atmosphere the temperature recovery from the Little Ice Age could have been as high as 4C instead of the .8C claimed?

Maybe all that coal China is burning is saving our planet!

(Yes I know low level SO2 is supposedly not as bad as SO2 at 30,000 feet, but high altitude SO2 also causes some stratospheric warming – look it up)

USA States Months Ranked 10th Coldest or Colder Occuring This Century

Using data up to Aug 2012 from the NOAA, these are the months ranked in the coldest 10 for a state that occurred this supposedly warm century (2000 – Aug 2012).

If Rank = 1,  it is the coldest. The Anomaly is the difference from the 1981 to 2010 30 year average.

For example, Nov 2000 was the coldest November in Arizona as long as NOAA has put out data (since 1895). The average temp was 44.2 which was -6.5F colder than the 30 year average.

At the bottom is a list of anomalies -10F or colder that occurred since 2000.

Amazingly, North Dakota 2002 Mar had an -11.1F anomaly and it was only ranked as the 9th coldest March with an average temperature of 16.2F. Brrr.

State Year Month Average F Anomaly F Rank
Alabama 2000 Dec 39.1 -7.6 3
Alabama 2004 Aug 76.4 -3.1 3
Alabama 2010 Feb 40.1 -8.3 6
Alabama 2010 Dec 40.2 -6.5 5
Arizona 2000 Nov 44.2 -6.5 1
Arkansas 2000 Dec 31.6 -9.9 2
Arkansas 2003 Jun 73.4 -3.3 7
Arkansas 2004 Jul 77.9 -2.5 10
Arkansas 2004 Aug 75.3 -4.5 4
Arkansas 2006 Sep 69.2 -3.1 7
Arkansas 2007 Apr 57.3 -3.4 10
Arkansas 2007 Jul 77.6 -2.8 6
Arkansas 2009 Jul 77.6 -2.8 7
Arkansas 2009 Oct 56.4 -4.9 4
Arkansas 2010 Feb 35.8 -8.1 7
California 2000 Nov 47.4 -4.3 3
California 2003 Apr 52.3 -4.5 9
California 2006 Mar 46 -6.5 2
Colorado 2000 Nov 27.7 -7.1 5
Colorado 2006 Sep 54.1 -4.1 5
Colorado 2007 Jan 18.3 -6.8 8
Colorado 2009 Oct 41 -5.6 2
Connecticut 2000 Jul 67.8 -4 5
Connecticut 2004 Jan 18.7 -7.6 10
Connecticut 2005 May 53.2 -4.5 4
Connecticut 2009 Jul 68.2 -3.6 6
Delaware 2000 Jul 73.2 -3.8 3
Delaware 2001 Jul 73.1 -3.9 2
Delaware 2003 May 58.5 -4.5 6
Delaware 2005 May 58.2 -4.8 5
Florida 2001 Sep 77.6 -1.9 7
Florida 2003 Jan 52.4 -5.3 6
Florida 2005 Apr 66.6 -2.7 6
Florida 2008 Nov 61.4 -4.6 9
Florida 2010 Jan 52.4 -5.3 7
Florida 2010 Feb 52.3 -8.2 4
Florida 2010 Mar 58.7 -6.1 4
Florida 2010 Dec 50 -9.9 1
Georgia 2000 Sep 72.2 -1.8 9
Georgia 2000 Dec 40.4 -7.4 4
Georgia 2001 Sep 71.8 -2.2 4
Georgia 2005 May 68 -2.7 7
Georgia 2008 Nov 51.5 -4.3 9
Georgia 2010 Feb 41.5 -8 6
Georgia 2010 Mar 51.4 -4.8 10
Georgia 2010 Dec 39.5 -8.3 1
Idaho 2000 Nov 27.3 -6 4
Idaho 2002 Oct 42.2 -3.3 10
Idaho 2008 Apr 38.3 -5.6 7
Idaho 2009 Oct 41.1 -4.4 7
Idaho 2010 May 46.8 -5.2 4
Illinois 2000 Dec 17.6 -12.3 2
Illinois 2003 Jun 67.8 -4 10
Illinois 2004 Aug 68.5 -5 4
Illinois 2009 Jul 70.2 -5.1 1
Illinois 2009 Oct 49.6 -4.5 7
Indiana 2000 Jul 71.8 -2.4 10
Indiana 2000 Dec 19.3 -11.8 2
Indiana 2004 Aug 68.6 -4.1 4
Indiana 2006 Sep 62.4 -3.1 10
Indiana 2007 Feb 20.4 -10.9 5
Indiana 2007 Jul 71.7 -2.5 9
Indiana 2009 Jul 69 -5.2 1
Indiana 2009 Oct 50.3 -3.6 10
Iowa 2000 Dec 10 -13.1 2
Iowa 2002 Oct 45.8 -4.8 6
Iowa 2004 Aug 66.2 -5.2 3
Iowa 2009 Jul 68 -5.6 1
Iowa 2009 Oct 44.4 -6.2 3
Kansas 2000 Nov 36.8 -6.1 5
Kansas 2000 Dec 24.3 -7.7 5
Kansas 2002 Oct 50.3 -5.5 4
Kansas 2004 Jul 75 -3.7 7
Kansas 2004 Aug 72.3 -4.8 6
Kansas 2006 Sep 63.9 -4.1 5
Kansas 2009 Oct 48.2 -7.6 2
Kentucky 2000 Dec 26.9 -10 4
Kentucky 2003 Jun 69 -3.8 7
Kentucky 2004 Aug 71.2 -4.1 6
Kentucky 2006 Sep 64.6 -3.6 7
Kentucky 2009 Jul 71.7 -4.6 2
Kentucky 2009 Oct 53.4 -3.6 10
Kentucky 2010 Dec 28.6 -8.3 5
Louisiana 2000 Dec 43.8 -7.2 3
Louisiana 2004 Aug 79.6 -2.5 6
Louisiana 2007 Jul 80.2 -2 8
Louisiana 2010 Feb 44.4 -8.5 5
Maine 2000 Jul 63 -3 5
Maine 2002 Oct 41.6 -2.7 8
Maine 2003 Apr 35.7 -4 8
Maine 2004 Jan 6.6 -7.3 4
Maine 2004 Jun 57.4 -3.4 7
Maine 2005 May 46.9 -4.3 7
Maine 2008 Mar 22.6 -4.2 10
Maine 2009 Jan 7.5 -6.4 8
Maine 2009 Jul 63.2 -2.8 7
Maine 2009 Oct 40.9 -3.4 4
Maryland 2000 Jul 71.7 -4.2 2
Maryland 2000 Dec 28.7 -7.9 7
Maryland 2001 Jul 71.9 -4 4
Maryland 2005 May 58.2 -4.3 7
Maryland 2009 Jul 72.7 -3.2 9
Massachusetts 2000 Jul 67.3 -3.2 6
Massachusetts 2001 Jul 67.6 -2.9 9
Massachusetts 2004 Jan 17.5 -7.7 6
Massachusetts 2005 May 51.1 -5 6
Massachusetts 2009 Jul 67.3 -3.2 7
Michigan 2000 Dec 16.5 -8.8 4
Michigan 2004 Aug 63 -4 5
Michigan 2009 Jan 12.9 -7.3 10
Michigan 2009 Jul 63.2 -5.3 2
Minnesota 2000 Dec 3 -12.1 3
Minnesota 2002 Mar 18.9 -9.2 9
Minnesota 2002 May 49.8 -5.4 10
Minnesota 2002 Oct 37.5 -7.5 3
Minnesota 2004 Aug 60.8 -6.3 1
Minnesota 2009 Jul 64.3 -5 3
Minnesota 2009 Oct 39.8 -5.2 5
Mississippi 2000 Dec 38.3 -8.5 3
Mississippi 2001 Oct 60.7 -3.4 10
Mississippi 2004 Aug 76.4 -3.9 3
Mississippi 2010 Feb 40 -8.6 5
Mississippi 2010 Dec 41.8 -5 10
Missouri 2000 Dec 21.3 -11.8 2
Missouri 2003 Jun 69.1 -3.8 8
Missouri 2004 Jul 74.4 -2.9 10
Missouri 2004 Aug 70.7 -5.4 5
Missouri 2009 Jul 72.9 -4.4 4
Missouri 2009 Oct 50.5 -5.6 5
Montana 2000 Nov 22.2 -8.5 4
Montana 2002 Mar 19.9 -13.5 5
Montana 2002 Oct 37.3 -6.6 4
Montana 2003 Nov 24.2 -6.5 10
Montana 2009 Oct 37.2 -6.7 3
Montana 2009 Dec 11.6 -9.3 5
Montana 2010 May 47.9 -4.1 10
Nebraska 2000 Nov 28.3 -8.4 3
Nebraska 2000 Dec 18.5 -7.3 7
Nebraska 2002 Oct 44.1 -6 4
Nebraska 2004 Aug 68.3 -4.1 4
Nebraska 2006 Sep 58.4 -4.4 5
Nebraska 2009 Jul 70.1 -4.3 6
Nebraska 2009 Aug 69.1 -3.3 10
Nebraska 2009 Oct 41.9 -8.2 2
Nebraska 2009 Dec 18.7 -7.1 9
Nevada 2000 Nov 33.3 -5.6 3
Nevada 2009 Dec 24.7 -6.1 8
Nevada 2010 May 50 -6.5 10
New Hampshire 2000 Jul 64.3 -3.5 6
New Hampshire 2004 Jan 10.7 -7.9 8
New Hampshire 2005 May 49 -4.8 8
New Hampshire 2009 Jul 64.2 -3.6 4
New Hampshire 2009 Oct 43 -3.2 8
New Jersey 2000 Jul 70.9 -4 2
New Jersey 2001 Jul 71.3 -3.6 7
New Jersey 2003 May 56.8 -3.9 6
New Jersey 2005 May 56.5 -4.2 5
New Mexico 2000 Nov 37.1 -6.2 2
New Mexico 2006 Sep 60.9 -4.3 2
New York 2000 Jul 65.1 -3.7 2
New York 2001 Jul 66.2 -2.6 10
New York 2009 Jul 65.6 -3.2 4
North Carolina 2000 Dec 35.7 -7 6
North Carolina 2001 Jul 74.9 -2.8 5
North Carolina 2001 Sep 67.9 -2.2 10
North Carolina 2004 Aug 74.1 -2.3 9
North Carolina 2005 May 63.3 -3.1 8
North Carolina 2009 Jul 75.3 -2.4 10
North Carolina 2010 Dec 33.7 -9 3
North Dakota 2000 Dec 2.9 -11.1 7
North Dakota 2002 Mar 16.2 -11.1 9
North Dakota 2002 May 48.6 -5.4 8
North Dakota 2002 Oct 34.5 -8.7 4
North Dakota 2003 Nov 19.7 -7.7 10
North Dakota 2004 Aug 61.2 -6.3 2
North Dakota 2009 Jul 64.4 -4.6 6
North Dakota 2009 Oct 37.7 -5.5 6
Ohio 2000 Jul 70 -3 6
Ohio 2000 Dec 21.6 -10.1 4
Ohio 2007 Feb 19.4 -11.4 4
Ohio 2009 Jul 68.8 -4.2 1
Oklahoma 2000 Nov 43.2 -6.1 4
Oklahoma 2000 Dec 30.9 -8.1 4
Oklahoma 2002 Oct 56.6 -4.3 8
Oklahoma 2003 Jun 73.4 -3.1 8
Oklahoma 2003 Sep 68.8 -3.4 7
Oklahoma 2004 Jul 77.9 -3.5 6
Oklahoma 2004 Aug 75.7 -5.1 5
Oklahoma 2006 Sep 68.9 -3.3 8
Oklahoma 2007 Apr 55.2 -4 8
Oklahoma 2009 Oct 54.4 -6.5 2
Oregon 2000 Nov 34.7 -4.6 9
Oregon 2008 Apr 42.3 -4.3 7
Oregon 2009 Oct 46 -3.2 10
Oregon 2010 May 49.4 -4 10
Oregon 2011 Apr 42.2 -4.4 5
Oregon 2011 May 48.9 -4.5 7
Pennsylvania 2000 Jul 67.3 -3.5 2
Pennsylvania 2000 Dec 22.9 -7.8 5
Pennsylvania 2001 Jul 68.1 -2.7 6
Pennsylvania 2005 May 53.3 -4.5 4
Pennsylvania 2007 Feb 20 -9.1 8
Pennsylvania 2008 May 53.6 -4.2 7
Pennsylvania 2009 Jul 66.7 -4.1 1
Rhode Island 2004 Jan 20.4 -8.7 3
Rhode Island 2005 May 52.6 -4.2 6
South Carolina 2000 Dec 38.3 -7.9 4
South Carolina 2001 Sep 71 -2.1 8
South Carolina 2004 Aug 76.8 -2.3 9
South Carolina 2005 May 67 -2.8 7
South Carolina 2008 Nov 50.1 -4.3 10
South Carolina 2010 Feb 40.4 -7.3 6
South Carolina 2010 Dec 37.8 -8.4 2
South Dakota 2000 Nov 24.5 -7.9 7
South Dakota 2000 Dec 10.7 -9.8 6
South Dakota 2002 Mar 22.1 -10.9 8
South Dakota 2002 Oct 39.5 -7.7 4
South Dakota 2004 Aug 65.9 -5 3
South Dakota 2009 Jul 67.8 -4.9 6
South Dakota 2009 Oct 39.2 -8 2
Tennessee 2000 Dec 30.6 -9 4
Tennessee 2003 Jun 70.7 -3.2 7
Tennessee 2004 Aug 72.1 -4.3 3
Tennessee 2009 Jul 73.6 -3.8 3
Tennessee 2010 Feb 32.8 -8.3 9
Tennessee 2010 Dec 32.2 -7.4 5
Texas 2000 Nov 51 -5.1 6
Texas 2000 Dec 42.3 -5 6
Texas 2004 Aug 79.2 -2.9 6
Texas 2007 Apr 61.6 -3.6 8
Texas 2007 Jul 79.1 -3.3 2
Texas 2008 Sep 73 -2.7 10
Texas 2009 Dec 42.9 -4.4 9
Texas 2010 Feb 43.2 -7.3 6
Utah 2000 Nov 30.5 -6.6 2
Utah 2009 Dec 20.2 -7.1 8
Utah 2010 May 51.7 -5.1 9
Vermont 2000 Jul 63.8 -3.4 5
Vermont 2001 Jul 64.2 -3 6
Vermont 2004 Jan 7.3 -9.4 6
Vermont 2005 May 49.2 -4.2 10
Virginia 2000 Jul 72.3 -3 7
Virginia 2000 Dec 30 -7.8 4
Virginia 2001 Jul 71.9 -3.4 3
Virginia 2005 May 59.5 -3.5 7
Virginia 2009 Jul 71.9 -3.4 4
Virginia 2010 Dec 30.1 -7.7 5
Washington 2000 Nov 34.2 -4.4 6
Washington 2008 Apr 42.7 -4.9 4
Washington 2009 Oct 45.7 -2.9 6
Washington 2011 Apr 42.3 -5.3 2
West Virginia 2000 Jul 69.1 -2.9 4
West Virginia 2000 Dec 25.8 -8.2 6
West Virginia 2005 May 55.9 -4.1 8
West Virginia 2007 Feb 23.7 -10.2 4
West Virginia 2009 Jul 67.8 -4.2 1
West Virginia 2010 Dec 24.9 -9.1 4
Wisconsin 2000 Dec 9.1 -10.8 6
Wisconsin 2002 Oct 41.9 -4.6 7
Wisconsin 2004 Aug 62.1 -5.2 3
Wisconsin 2009 Jul 63.7 -5.5 2
Wisconsin 2009 Oct 41.9 -4.6 8
Wyoming 2000 Nov 19.3 -11 1
Wyoming 2002 Oct 37.7 -5.4 7
Wyoming 2009 Oct 35.7 -7.4 3
Wyoming 2009 Dec 13.6 -6.9 8
Wyoming 2010 May 45.2 -5 8
Wyoming 2011 May 45.4 -4.8 10

Anomalies since 2000 of -10 or colder.

State Year Month Average F Anomaly F Rank
Illinois 2000 Dec 17.6 -12.3 2
Indiana 2000 Dec 19.3 -11.8 2
Indiana 2007 Feb 20.4 -10.9 5
Iowa 2000 Dec 10 -13.1 2
Kentucky 2000 Dec 26.9 -10 4
Minnesota 2000 Dec 3 -12.1 3
Missouri 2000 Dec 21.3 -11.8 2
Montana 2002 Mar 19.9 -13.5 5
North Dakota 2000 Dec 2.9 -11.1 7
North Dakota 2002 Mar 16.2 -11.1 9
Ohio 2000 Dec 21.6 -10.1 4
Ohio 2007 Feb 19.4 -11.4 4
South Dakota 2002 Mar 22.1 -10.9 8
West Virginia 2007 Feb 23.7 -10.2 4
Wisconsin 2000 Dec 9.1 -10.8 6
Wyoming 2000 Nov 19.3 -11 1

NOAA Aug 2012 – States With a Negative Temperature Trend Over Last 15 Years

As of Aug 2012, using NOAA data, this is a list of States with a negative (or zero)  temperature trend (in Fahrenheit per decade)  from Sept 1997 to Aug 2012 (15 years).

State Trend F/Decade
Washington -1.23
South Dakota -1.02
North Dakota -0.99
Montana -0.98
Idaho -0.79
Nebraska -0.78
Minnesota -0.72
Oregon -0.67
Iowa -0.63
Utah -0.57
Wisconsin -0.57
Colorado -0.31
Kansas -0.28
Michigan -0.24
Arizona -0.21
Florida -0.21
Nevada -0.2
Kentucky -0.16
Wyoming -0.16
Georgia -0.07
Illinois -0.05
Pennsylvania -0.03
Arkansas -0.01
Texas -0.01