According to the NOAA, August 2014 ranked 28th coldest out of 120 using the Maximum temperature. Average temperature is ranked 68th out of 120.

According to the NOAA, August 2014 ranked 28th coldest out of 120 using the Maximum temperature. Average temperature is ranked 68th out of 120.
I only have 166 days of MASIE data. These two graphs are NSIDC and MASIE for the same period.
Minimum is close.


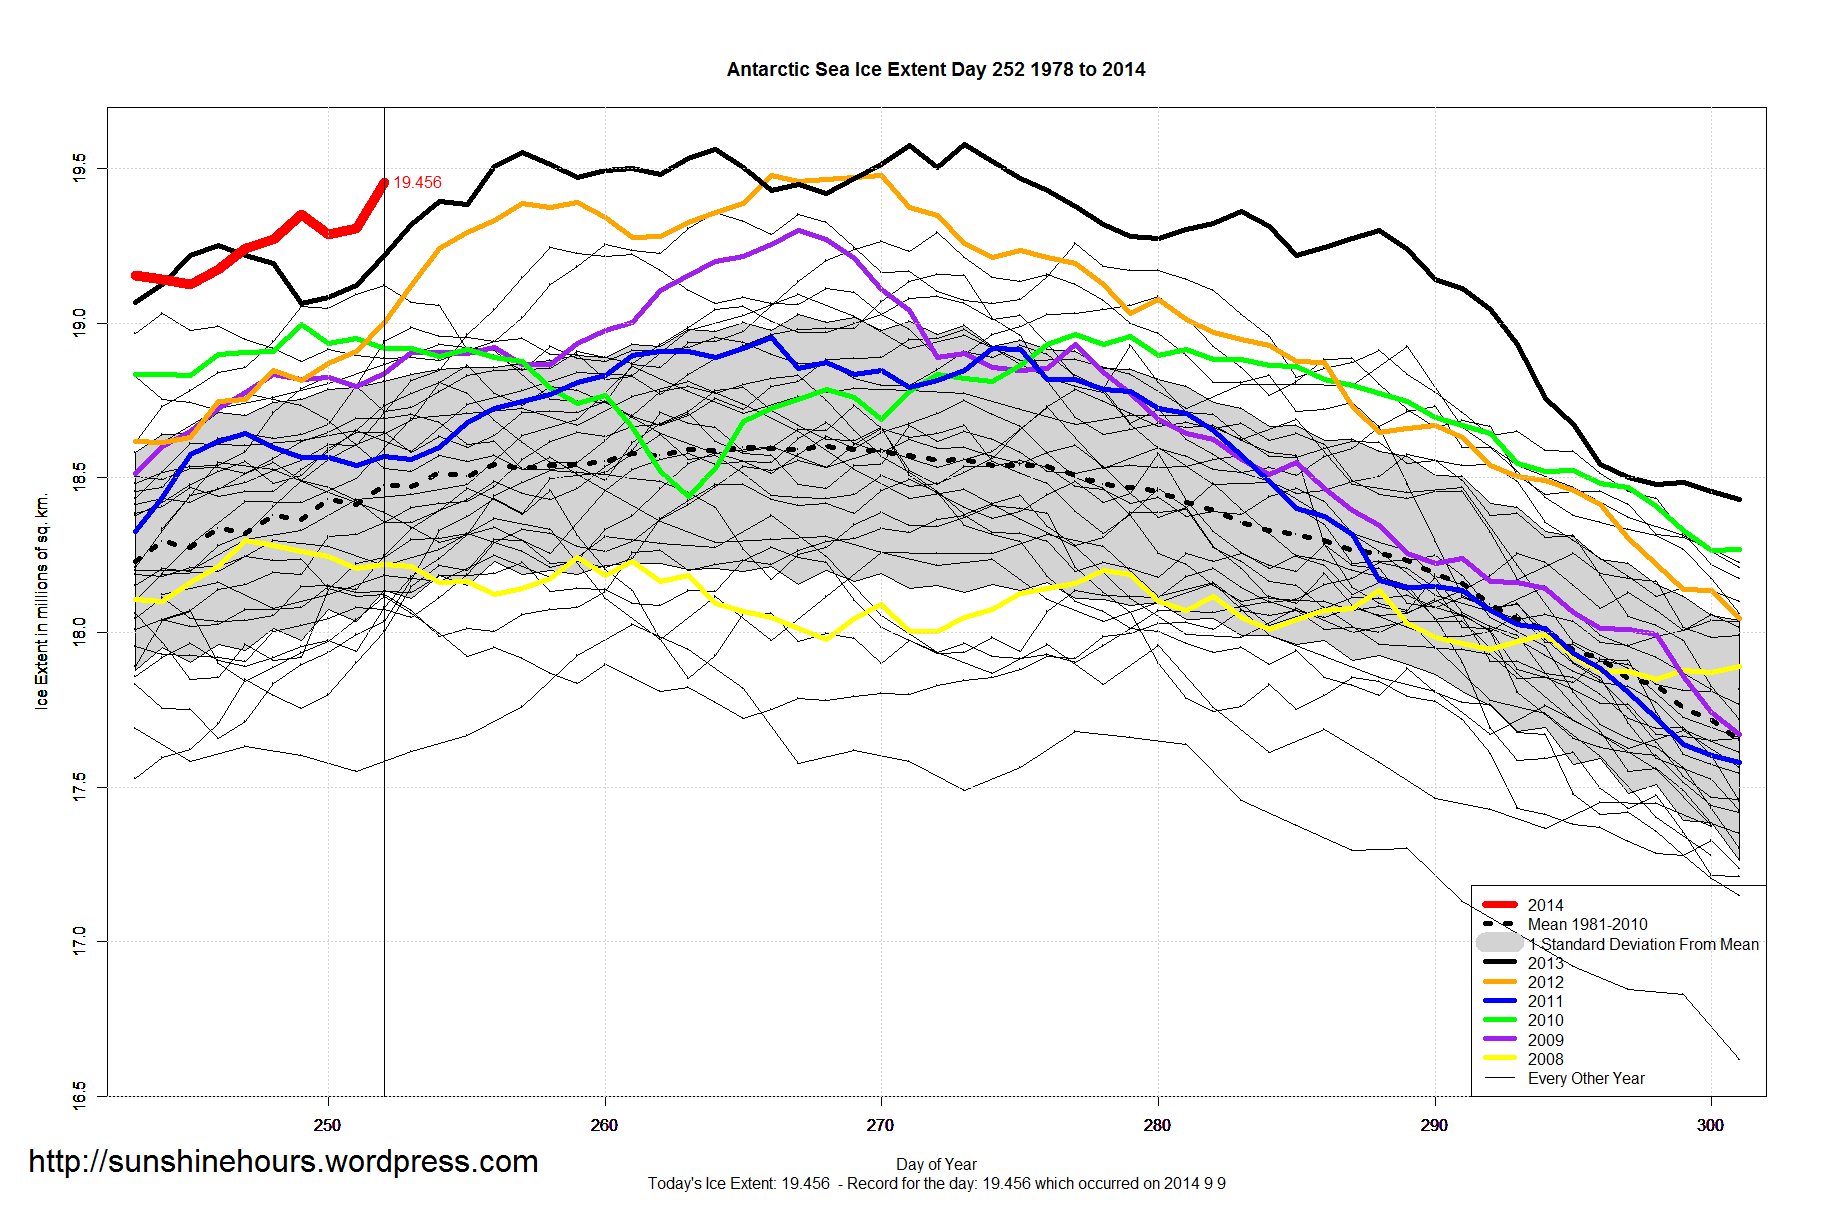
Antarctic Sea Ice Extent Sep 11 2014 – 1,017,000 sq km above the 1981-2010 mean. Data for Day 253. Data here.
This is now the 14th Highest All-Time Extent. Only 13 days in 2013 were higher.
Only 90,110 sq km from a new all-time record.
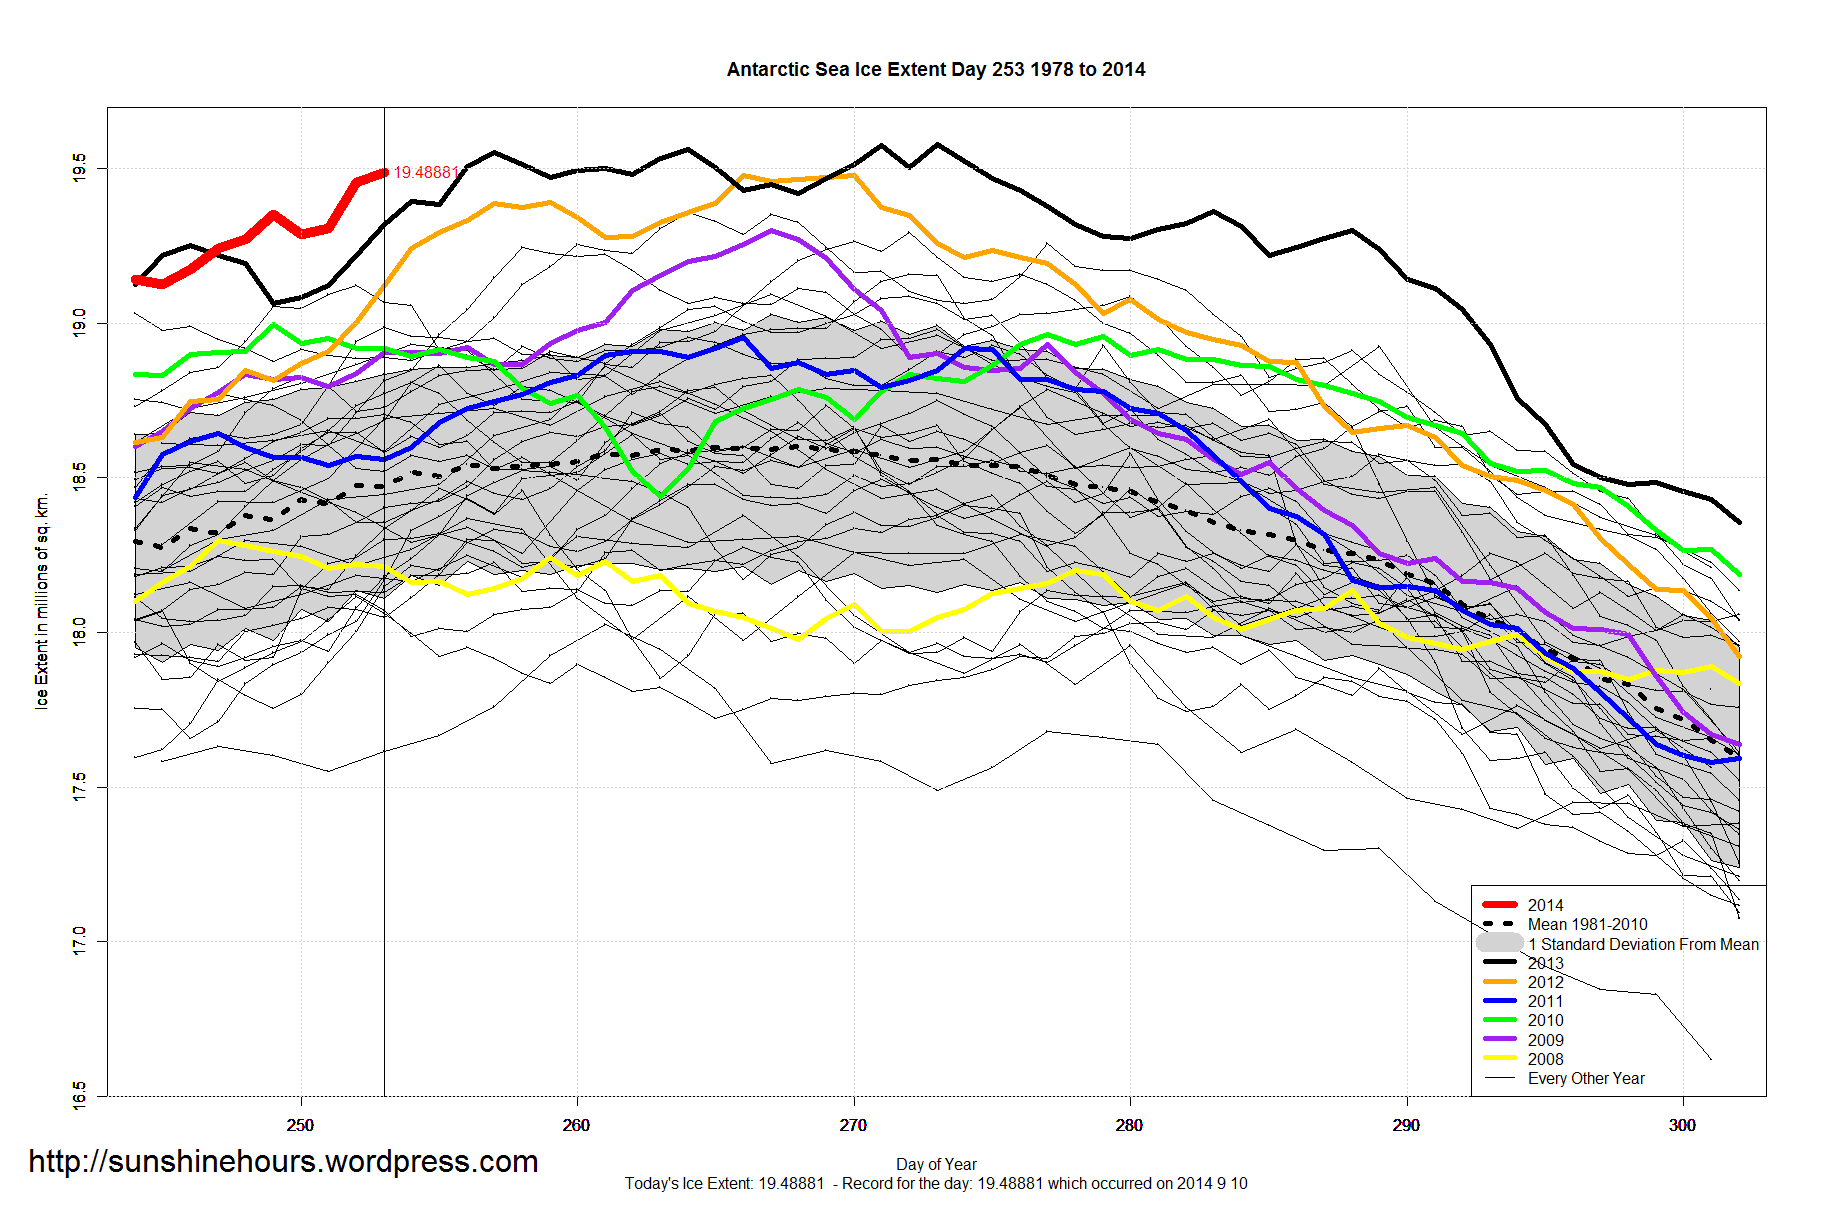

2nd Update: New All-Time Record Set
Update: Now at 5th highest all time.
All the maximums for Antarctica. Of course 2014 may (or may not) climb higher. Click for full size.

Sept 10 2014 MASIE Update – Tiny Changes
Data here. Click for bigger.
| Region | 165 days ago | End | Last 164 | Last 28 | Last 14 | Last 7 | Last 3 | Last 1 |
| Greenland Sea | 603,416 | 162,018 | -441,397 | -120,946 | -81,417 | -54,501 | -39,440 | -14,866 |
| Beaufort Sea | 1,070,445 | 726,746 | -343,699 | -62,719 | 9,384 | 19,833 | 11,948 | -5,306 |
| Laptev Sea | 897,845 | 2,411 | -895,434 | -87,910 | -12,750 | -15,057 | -4,000 | -3,145 |
| Canadian Archipelago | 853,214 | 495,091 | -358,123 | -70,948 | -9,063 | -19,862 | 1,066 | -2,867 |
| Hudson Bay | 1,260,903 | 11,503 | -1,249,401 | -95,643 | -33,774 | -16,122 | -9,270 | 0 |
| Bering Sea | 697,324 | 0 | -697,324 | 0 | 0 | 0 | 0 | 0 |
| Baltic Sea | 15,337 | 0 | -15,337 | 0 | 0 | 0 | 0 | 0 |
| Sea of Okhotsk | 853,240 | 0 | -853,240 | 0 | 0 | 0 | 0 | 0 |
| Yellow Sea | 0 | 0 | 0 | 0 | 0 | 0 | 0 | 0 |
| Baffin Bay Gulf of St. Lawrence | 1,688,530 | 14,436 | -1,674,094 | -6,488 | -2,478 | -311 | -1,820 | 21 |
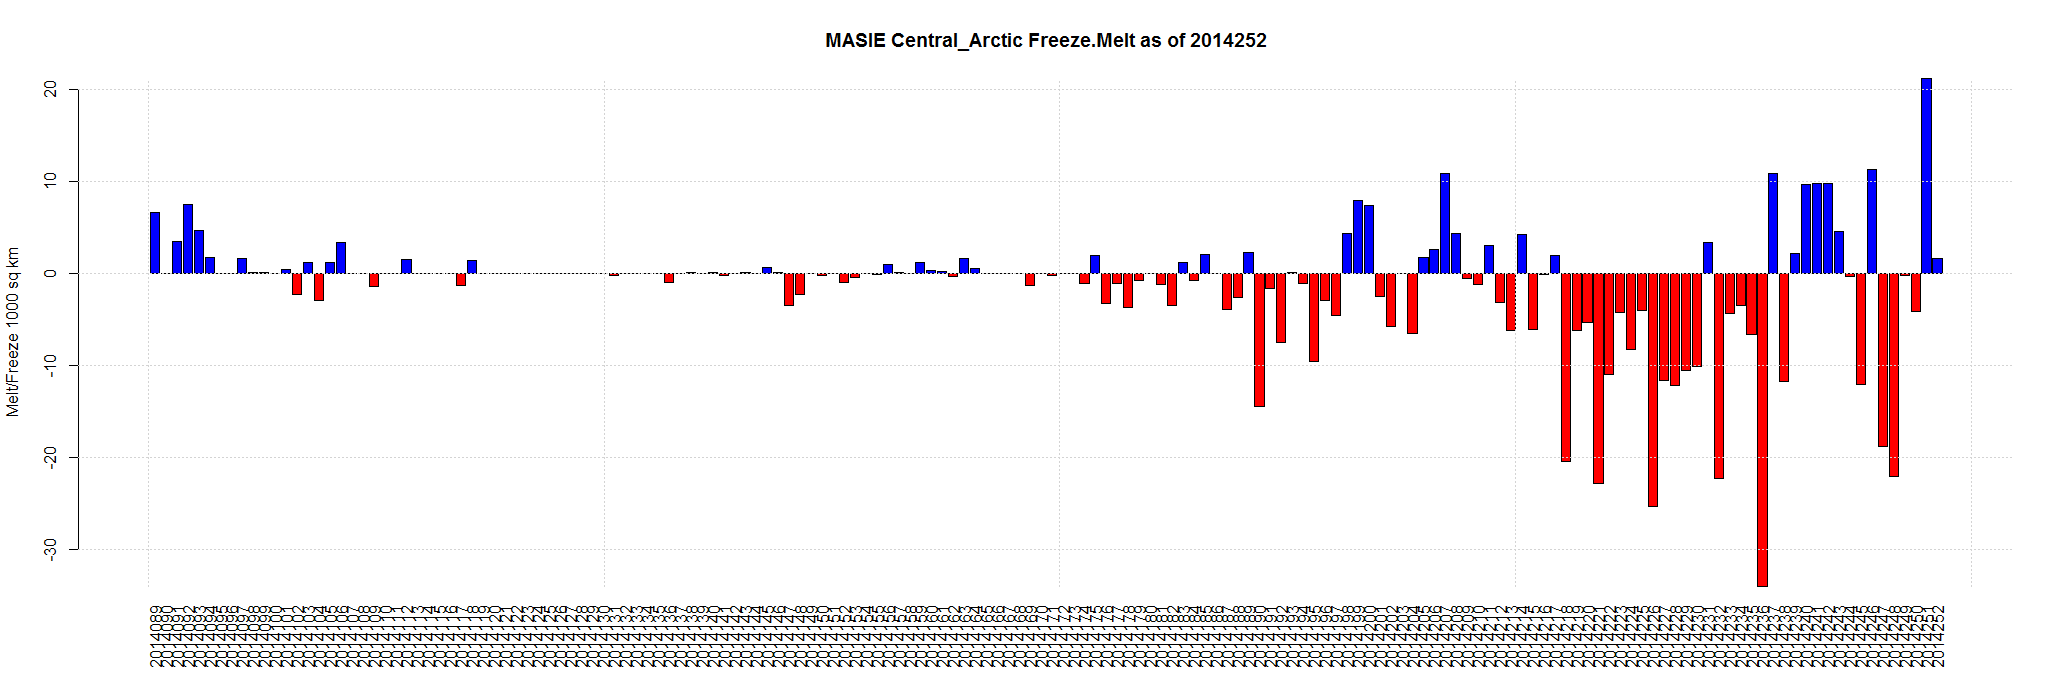
| Central Arctic | 3,221,921 | 2,991,516 | -230,406 | -130,612 | 11,927 | -11,337 | 18,578 | 1,593 |
| Chukchi Sea | 966,006 | 279,621 | -686,385 | -225,800 | -94,086 | -25,880 | -1,513 | 2,045 |
| Barents Sea | 645,917 | 130,065 | -515,852 | 16,633 | -13,591 | -4,555 | 3,968 | 2,932 |
| Kara Sea | 933,859 | 98,293 | -835,566 | -113,221 | -60,184 | -30,611 | 1,083 | 5,243 |
| East Siberian Sea | 1,087,137 | 532,439 | -554,698 | -171,482 | -8,728 | -11,118 | 7,029 | 6,288 |
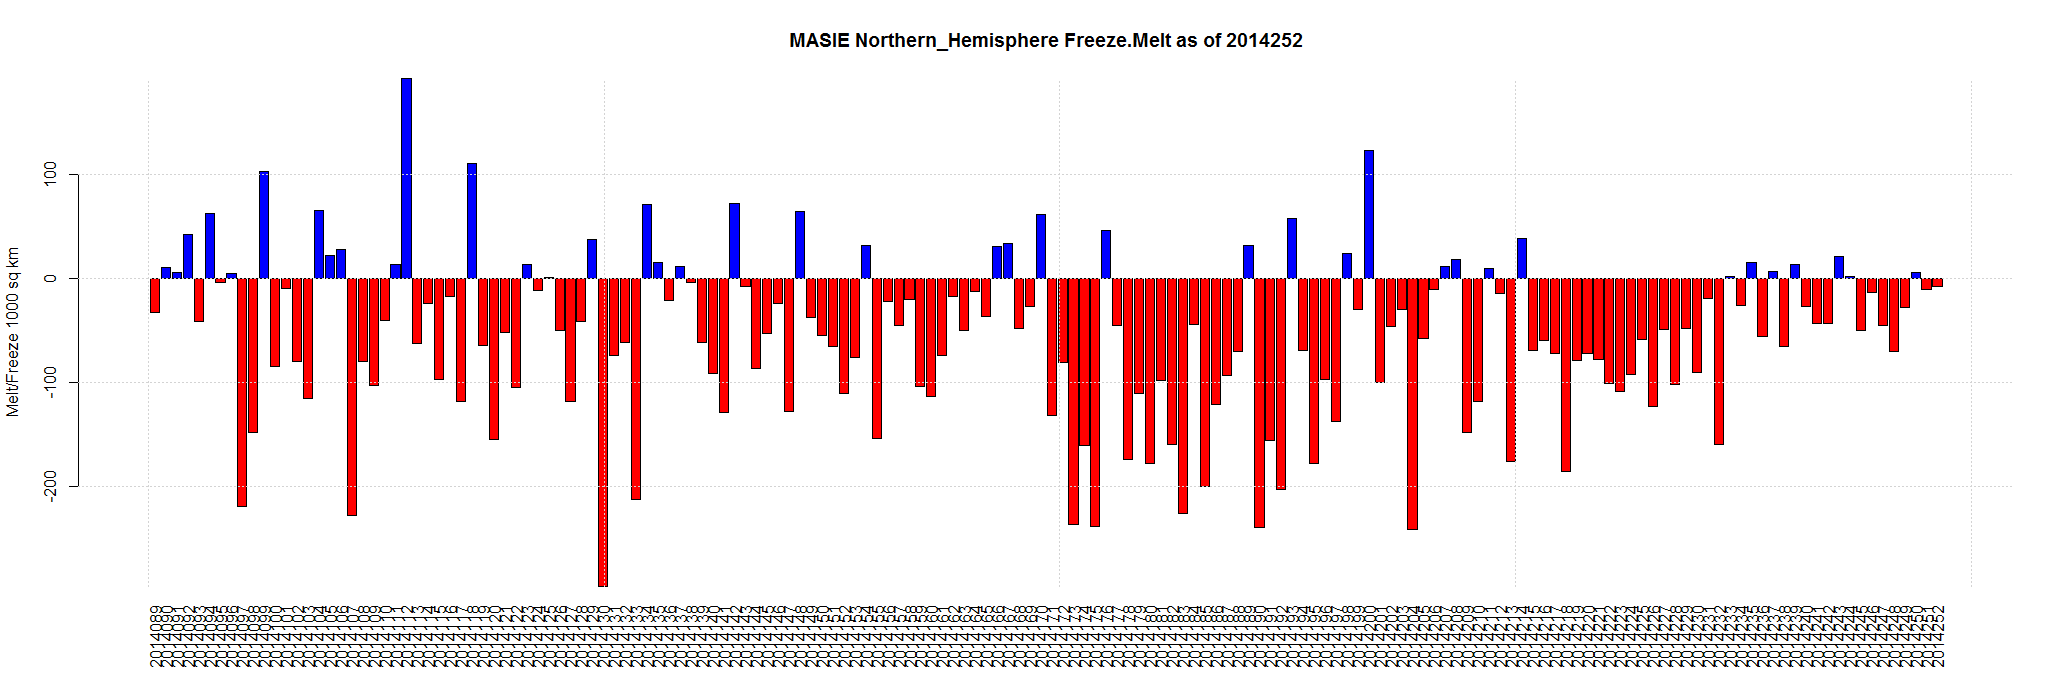
| Northern Hemisphere (Total) | 14,805,115 | 5,445,009 | -9,360,105 | -1,069,407 | -295,031 | -169,795 | -12,644 | -7,864 |
| NH (Average Loss per Day) | -56,728 | -38,193 | -21,074 | -24,256 | -4,215 | -7,864 |
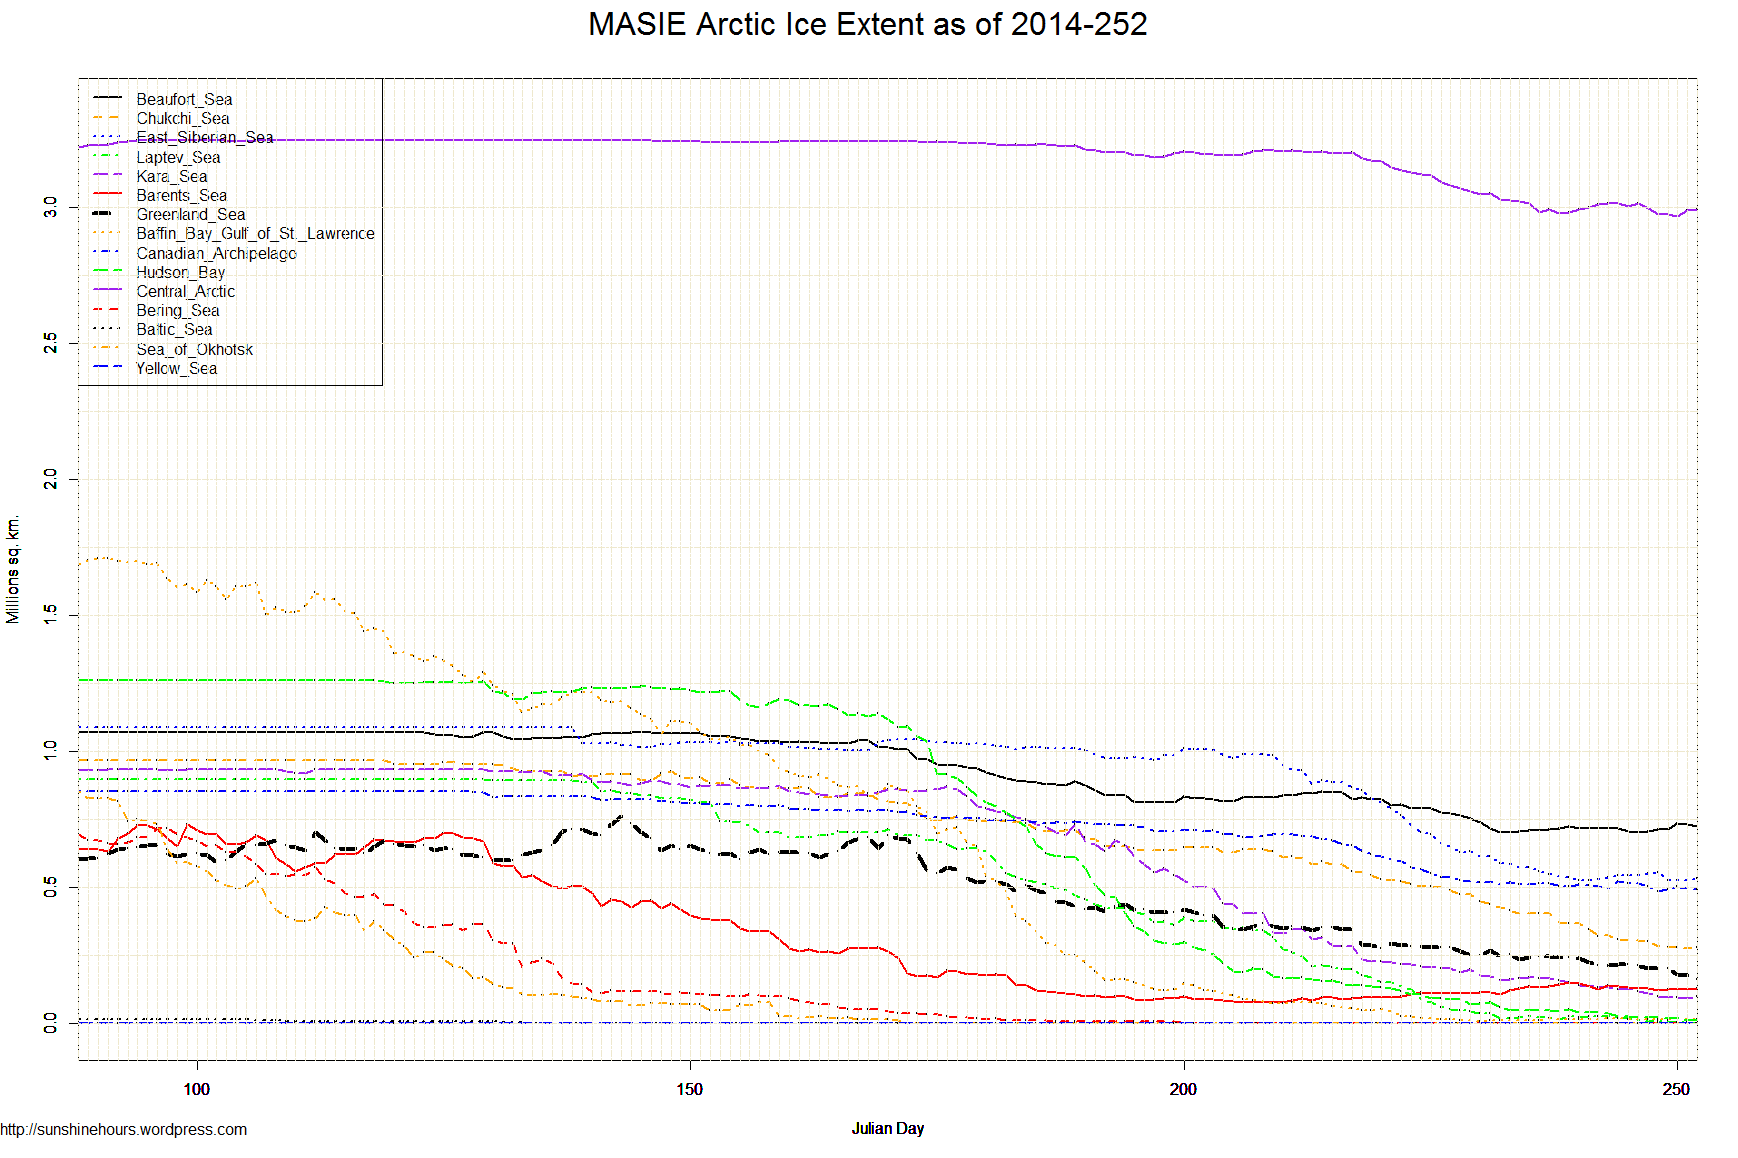
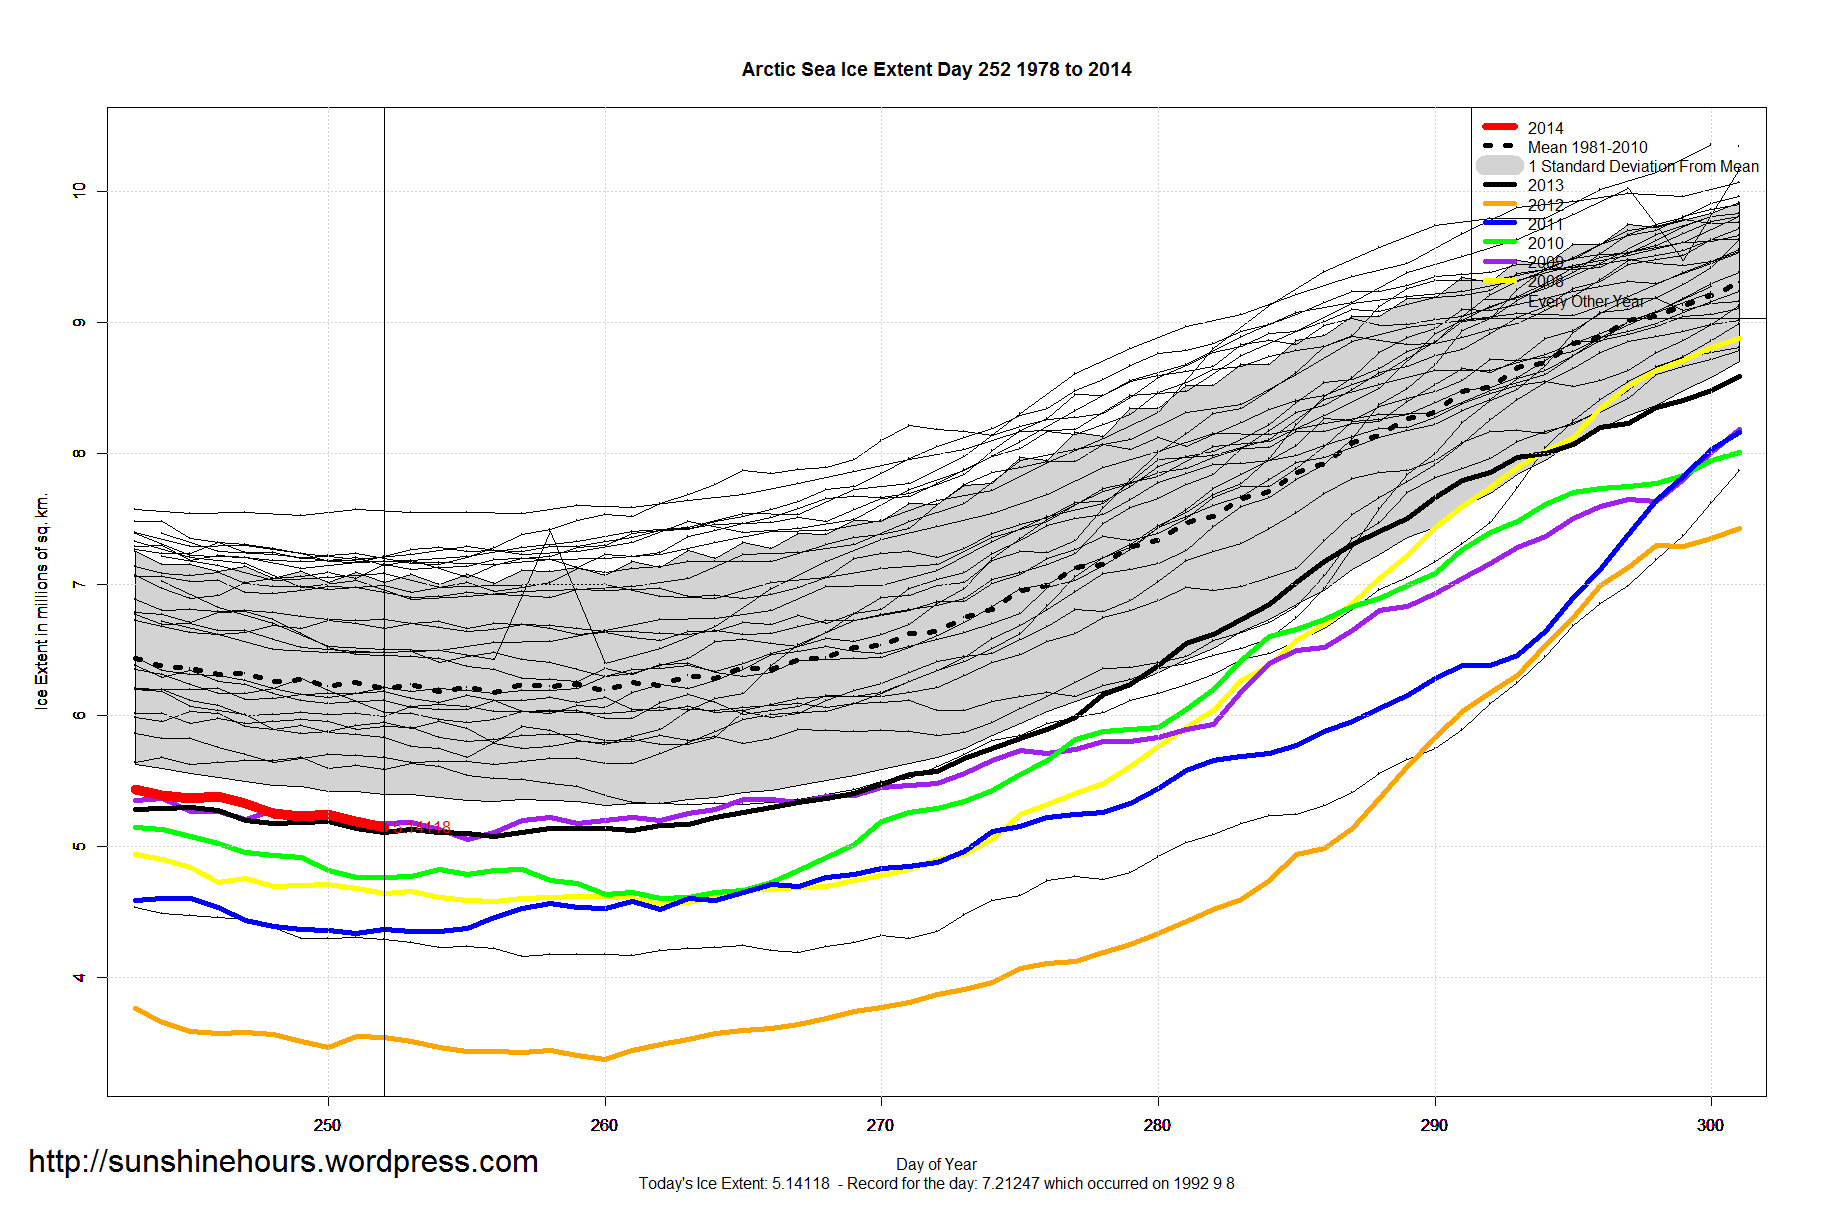
Arctic Sea Ice Extent Sept 10 2014 – -1,062,000 sq km below the 1981-2010 mean. Data for Day 252. Data here.

Antarctic Sea Ice Extent Sep 10 2014 – 982,000 sq km above the 1981-2010 mean. Data for Day 252. Data here.
23rd Highest Extent of All-Time – Only 120,000 to go to set an all-time record.

Sept 9 2014 MASIE Update – Tiny Gain – Central Arctic Losses Shrink
Data here. Click for bigger.


| Region | 164 days ago | End | Last 163 | Last 28 | Last 14 | Last 7 | Last 3 | Last 1 |
| Hudson Bay | 1,260,903 | 11,503 | -1,249,401 | -95,692 | -38,235 | -15,934 | -12,048 | -8,847 |
| Canadian Archipelago | 853,214 | 497,958 | -355,256 | -76,552 | -15,992 | -24,983 | 10,821 | -5,817 |
| Greenland Sea | 603,416 | 176,884 | -426,531 | -107,827 | -68,946 | -39,815 | -24,575 | -4,166 |
| Chukchi Sea | 966,006 | 277,576 | -688,430 | -233,955 | -127,985 | -33,205 | -6,625 | -3,955 |
| Baffin Bay Gulf of St. Lawrence | 1,688,530 | 14,415 | -1,674,115 | -10,961 | -3,007 | -3,805 | -736 | -3,595 |
| Kara Sea | 933,859 | 93,050 | -840,809 | -125,545 | -71,504 | -33,588 | -8,074 | -3,166 |
| Beaufort Sea | 1,070,445 | 732,053 | -338,392 | -57,889 | 19,934 | 12,633 | 16,566 | -2,138 |
| East Siberian Sea | 1,087,137 | 526,151 | -560,986 | -203,109 | -20,576 | -18,785 | -29,432 | -1,390 |
| Laptev Sea | 897,845 | 5,557 | -892,288 | -120,778 | -14,166 | -18,412 | -854 | -528 |
| Bering Sea | 697,324 | 0 | -697,324 | 0 | 0 | 0 | 0 | 0 |
| Baltic Sea | 15,337 | 0 | -15,337 | 0 | 0 | 0 | 0 | 0 |
| Sea of Okhotsk | 853,240 | 0 | -853,240 | 0 | 0 | 0 | 0 | 0 |
| Yellow Sea | 0 | 0 | 0 | 0 | 0 | 0 | 0 | 0 |
| Barents Sea | 645,917 | 127,133 | -518,784 | 19,488 | -10,125 | -10,199 | 5,926 | 2,435 |
| Central Arctic | 3,221,921 | 2,989,922 | -231,999 | -140,522 | -1,478 | -25,007 | 16,690 | 21,122 |
| Northern Hemisphere (Total) | 14,805,115 | 5,452,873 | -9,352,242 | -1,153,814 | -352,551 | -211,571 | -32,813 | -10,515 |
| NH (Average Loss per Day) | -57,026 | -41,208 | -25,182 | -30,224 | -10,938 | -10,515 |
Arctic Sea Ice Extent Sep 09 2014 – -1,063,000 sq km below the 1981-2010 mean. Data for Day 251. Data here.


