October 2013 in the USA Was The 37th Coldest! These Octobers were warmer: 1897,1899,1900,1901,1902,1903,1904,1907,1910,1914,1915,1918 …

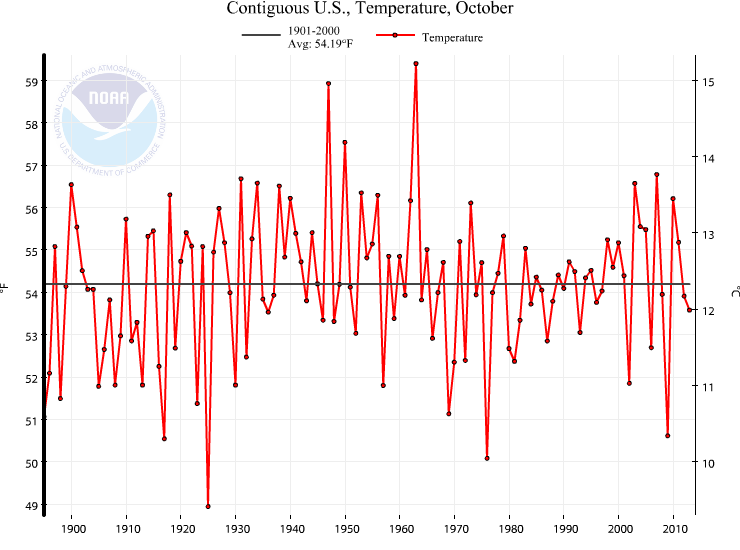
According to the NOAA, October 2013 was the 37th coldest since 1895. It was -0.61°F colder than the 1901-2000 average.

The warmest October was 1963 when it was 5.21F warmer than the 1901-2000 average. That means October 2013 was 5.83F colder than 1963!

These Octobers were warmer: 1897,1899,1900,1901,1902,1903,1904,1907,1910,1914,1915,1918

and 1920,1921,1922,1924,1926,1927,1928,1929,1931,1933,1934,1935,1937,1938,1939

and 1940,1941,1942,1943,1944,1945,1947,1949,1950,1951,1953,1954,1955,1956,1958,1960,1961,1962,1963,1964,1965,1967,1968

and 1971,1973,1974,1975,1977,1978,1979,1983,1984,1985,1986,1988,1989,1990,1991,1992,1994,1995,1996,1997,1998,1999

and 2000,2001,2003,2004,2005,2007,2008,2010,2011,2012.

NOAA_October_2013

Biofuels Kill

“Based on current technologies, higher biofuel production
necessarily means greater diversion of crops and/or cropland to
the production of fuel rather than food. The iron law of supply
and demand dictates that this would almost unavoidably
increase global food prices over what they would otherwise be.”


“Results derived from World Bank and World Health Organization (WHO)
studies suggest that for every million people living in absolute
poverty in developing countries, there are annually at least 5,270
deaths and 183,000 Disability-Adjusted Life Years (DALYs) lost to
disease. Combining these estimates with estimates of the
increase in poverty owing to growth in biofuels production over
2004 levels leads to the conclusion that additional biofuel
production may have resulted in at least 192,000 excess deaths
and 6.7 million additional lost DALYs in 2010. These exceed
WHO’s estimated annual toll of 141,000 deaths and 5.4 million
lost DALYs attributable to global warming.


Thus, policies intended to mitigate global warming may actually have increased death and disease in developing countries.”

Journal of American Physicians and Surgeons Volume 16 Number 1 Spring 2011

( Hat tip to commenter David L Hagen from here. )


HADCET – How Far Can You Go Back? June 1663 to June 2013 has a flat trend

I was looking at the HADCET data by month out of curiousity and I noticed that the month of June had a pretty flat trend for a long, long time.

So I thought to myself, how far can I go back with HADCET and get a flat or just slightly flat trend for individual months?

The graph below (click for full size) has a graph for each month. The months are grouped by season. And the data for each month is the the furthest back you can go with a trend of 0C/decade or lower.

The grand champion is June. The trend is 0C/decade from 1663 to 2013.

Wow.  Not much of a “Global Warming Signal” in a 350 year flat trend is there?

2nd longest is February with 0C/Decade trend from 1846 to 2013.

3rd longest is December with a -0.003C/Decade trend from 1907 to 2012.

4th is July from 1981. 5th is March from 1986. 6th and 7th is January and August from 1987.  May from 1988. October and November from 1994, September from 1995, And April from 2001,

I always wonder why CO2 is such a selective month.

HADCET How Far Can You Go Back 1663 to September 2013  Less Than or Equal to 0C. per Dec.

Northern Hemisphere Winter Doom By Latitude Band

Winter temperatures in the Northern Hemisphere are dropping as much as 2.5C / decade over the last 7 years.

Yesterday my post was a look at the northern hemisphere by month over the last 7 years.

Today I am looking at the same time frame, but I am using the gridded HADCRUT4 data for Dec/Jan/Feb only. You will have to click on the image to get the full effect.

There are 7 latitude bands with yellow highlighting. The trend in those is from -.44C/decade to -2.49C/decade. And note the green 0 line. 0 is the 1961-1990 average, Anywhere the graph or trend crosses the green line it is colder than the 1961-1990 average. It was pretty cold in the 60s and 70s.

I wish I didn’t live in the 50th parallel.

Highlighted Dec Jan Feb HADCRUT4 By Latitude Band - Last 7 Years as of 2013-7


HADCRUT4 Northern Hemisphere Winter Doom

Do you live in the Northern Hemisphere.? Did anyone tell you that in the midst of record CO2 levels HADCRUT4 shows massively dropping winter temperatures?

At the bottom of this post is a graph of HADCRUT4 Northern Hemisphere only temperatures for each month for the last 7 years.

Did you know December was cooling at -.9C per decade? By 2100 December could be 8C colder?

Did you know January was cooling at -.73C per decade?

Did you know March was cooling at -.56C per decade?

Did you know February was cooling at -.19C per decade?

Did you know November was cooling at -.2C per decade?

Did you know October was cooling at -.17C per decade?

Did you know April was cooling at -.17C per decade?

I’m glad I have a wood stove.

Average HADCRUT4 Northern  Last 7 Years


HADCRUT4 10 Years By Month = AMO

Over the last 10 years HADCRUT4 has had a slightly negative trend. But the months each have their own trend.

September to April have been cooling, while May – August have been warning, All 12 months with trends are below.

I wonder why CO2 has forsaken the winter months?

The interesting thing is this matches the AMO as you can see in the post I did in January. (I would do a new post but the US shutdown has shutdown the page I got the AMO data from).

When the AMO finishes going negative this will be very bad news for the CO2/Warmist Cult.. And even worse news for the world’s agriculture.

Right now, Dec/Jan/Feb are cooling at -0.17C/decade to -0.25C/decade. Brr.  Germany is already off to the coldest start of winter in 200 years.

Average HADCRUT4 Global  Last 10 Years

Cold weather produces more heart attacks

“Cold weather leads to more heart attacks, according to research presented at ESC Congress 2013 today by professor Marc Claeys from Belgium. The multifactorial study of nearly 16,000 patients found no relationship between heart attacks and air pollution.”

“AMI counts were correlated with average weekly meteorological data obtained from daily measurements in 73 meteorological sites, equally distributed in Belgium. The following meteorological measures were investigated: air pollution expressed as particulate matter both less than 10µM (PM10) and less than 2.5µM (PM2.5), black smoke, temperature and relative humidity.”

“Multivariate analysis showed that only temperature was significantly correlated with AMI, which increased by 7% for each 10°C decrease in minimal temperature (odds ratio [OR]=1.07, 95% confidence interval [CI]=1.04-1.11), and that there was no significant effect of air pollution (OR=1.01, 95%CI=1.00-1.02).”


http://medicalxpress.com/news/2013-09-cold-weather-heart.html


(h/t Tom Nelson)


Undertakers Business Dead Due To Warm Winter

Tim Blair: “Global warming is killing the death industry

“Sydney’s unseasonably mild winter, the warmest on record, might be a joy for most of us but it’s making life tough for funeral directors, who are experiencing their slowest season in 25 years.

‘’We’ve seen the biggest drop in business in a generation,’’ said Andrew Smith, chief executive of InvoCare, the largest private funeral, cemetery and crematorium operator in the Asia-Pacific region. ‘’Winter is usually our busiest time, but there’s been no real flu season this year and no real cold snaps, and that’s being reflected in a big drop in business.’’

We’ve had a 10 to 15 per cent drop in the death rate. Talking to other people in the industry, suppliers and coffin makers, they are all saying they have been affected.”

Read it all here.

NOAA 2013 – Brutally Cold Spring

What a brutal Spring. in the USA according to the NOAA.

Look at all those single digit rankings. Rank: (1 = Coldest and 119 = Warmest)

3rd coldest Spring out of 119 in Minnesota.

4th coldest in North and South Dakota. 5th coldest in Arkansas.

This should not be possible if AGW was real.

State Spring_2013 Spring Rank Coldest Spring Coldest Spring F
Minnesota 35.9 3 1950 34.43
North Dakota 33.83 4 1899 31.33
South Carolina 59.3 4 1960 58.87
Arkansas 57.33 5 1960 56.47
Alabama 60.1 6 1960 59.07
Georgia 60.67 6 1960 59.77
Mississippi 60.53 6 1960 59.97
Iowa 43.87 7 1960 42.83
Louisiana 63.7 7 1931 61.9
Missouri 51.17 7 1960 49.77
North Carolina 55.93 7 1960 54.9
Tennessee 54.9 8 1960 52.93
South Dakota 40.23 9 1950 37.6
Wisconsin 38.8 9 1950 37.3
Oklahoma 56.27 11 1924 54.3
Kansas 50.5 12 1924 48.3
Florida 68.1 13 1931 66.4
Kentucky 52.8 14 1960 50.53
Nebraska 44.9 16 1917 42.97
Illinois 49.17 19 1960 46.6
Virginia 53.03 34 1960 51.03
West Virginia 49.87 34 1960 46.8
Michigan 40.97 39 1950 37.6
Michigan 40.97 39 1940 37.6
Indiana 50.03 40 1960 46.53
Texas 64.2 40 1931 60.13
Colorado 42.73 42 1917 37.23
Montana 40.57 45 1917 35.5
Maryland 51.77 50 1940 48.63
Wyoming 39.67 57 1917 32.37
Ohio 49.5 58 1926 45.07
Pennsylvania 47.47 62 1984 43.57
New Jersey 50.3 63 1940 46.27
Connecticut 47.1 71 1967 42.13
New York 43.83 75 1926 38.57
Delaware 53.33 76 1940 48.63
Utah 47.8 76 1917 39.47
Massachusetts 46.17 77 1967 40.97
Washington 48.07 82 1955 41.5
Oregon 47.4 83 1917 42
Idaho 43.97 85 1917 36.17
Rhode Island 47.5 85 1917 40.97
New Mexico 53.47 92 1917 47.53
Maine 40.83 93 1926 33.7
Vermont 42.67 94 1926 34.03
Nevada 49.93 97 1917 41.17
New Hampshire 43.43 98 1926 35.4
Arizona 60.87 108 1917 52.4
California 60.13 113 1917 52.37

Canada May 2013 – 100 Coldest Daily Anomalies

Environment Canada calculates “Normals” for a subset of stations. Those are the anomalies from the 1971-2000 average.

I just started using the daily data this month. (The monthly summaries have proven to be unreliable)

So … using stations with Normals, here are the 100 stations with the coldest TMIN anomalies.

PROVINCE Name DATE MINTEMP NORMAL MINTEMP anomaly MIN
MANITOBA GILBERT PLAINS 2013-05-02 -15 0.5 -15.5
SASKATCHEWAN CYPRESS HILLS 2013-05-01 -15.5 -0.2 -15.3
MANITOBA GILBERT PLAINS 2013-05-03 -12.5 0.7 -13.2
ONTARIO WELLAND 2013-05-14 -6 7.2 -13.2
MANITOBA COWAN 2013-05-02 -14 -1 -13
MANITOBA WASAGAMING 2013-05-02 -14.3 -1.3 -13
ONTARIO WELLAND 2013-05-13 -6 7 -13
NUNAVUT CORAL HARBOUR A 2013-05-10 -25.4 -13 -12.4
SASKATCHEWAN KEY LAKE 2013-05-01 -15.5 -3.1 -12.4
NUNAVUT KUGLUKTUK A 2013-05-01 -27.9 -15.5 -12.4
YUKON TERRITORY SHINGLE POINT A 2013-05-01 -27.3 -14.9 -12.4
NUNAVUT BAKER LAKE A 2013-05-09 -24.3 -12.1 -12.2
SASKATCHEWAN LAST MOUNTAIN CS 2013-05-11 -8.8 3.4 -12.2
YUKON TERRITORY SHINGLE POINT A 2013-05-03 -26.1 -13.9 -12.2
SASKATCHEWAN BROADVIEW 2013-05-02 -10.6 1.2 -11.8
YUKON TERRITORY SHINGLE POINT A 2013-05-06 -24.2 -12.4 -11.8
NUNAVUT BAKER LAKE A 2013-05-02 -26.8 -15.1 -11.7
SASKATCHEWAN PELLY 2013-05-02 -12 -0.6 -11.4
NUNAVUT KUGLUKTUK A 2013-05-07 -24 -12.8 -11.2
BRITISH COLUMBIA FT STEELE DANDY CRK 2013-05-01 -10 1.1 -11.1
ALBERTA HIGH LEVEL A 2013-05-01 -11.5 -0.4 -11.1
MANITOBA INDIAN BAY 2013-05-12 -7.5 3.6 -11.1
SASKATCHEWAN QUAPPELLE 1 2013-05-10 -7.5 3.4 -10.9
SASKATCHEWAN DUVAL 2013-05-01 -8 2.8 -10.8
NUNAVUT BAKER LAKE A 2013-05-01 -26.3 -15.6 -10.7
ALBERTA CRAIGMYLE 2013-05-01 -10 0.6 -10.6
YUKON TERRITORY SHINGLE POINT A 2013-05-20 -17 -6.4 -10.6
ALBERTA VEGREVILLE 2013-05-01 -9.4 1.2 -10.6
NUNAVUT CORAL HARBOUR A 2013-05-09 -23.9 -13.4 -10.5
ALBERTA KANANASKIS 2013-05-01 -11.5 -1 -10.5
SASKATCHEWAN CLAYDON 2013-05-01 -9 1.4 -10.4
ALBERTA LETHBRIDGE CDA 2013-05-01 -8.3 2.1 -10.4
MANITOBA PINAWA WNRE 2013-05-12 -6.5 3.9 -10.4
NORTHWEST TERRITORIES FORT SMITH A 2013-05-01 -11.9 -1.6 -10.3
SASKATCHEWAN INDIAN HEAD CDA 2013-05-01 -9 1.3 -10.3
SASKATCHEWAN BEECHY 2013-05-11 -6.5 3.7 -10.2
SASKATCHEWAN STEWART VALLEY 2013-05-01 -8 2.1 -10.1
MANITOBA HODGSON 2 2013-05-02 -10.5 -0.5 -10
ONTARIO KINGSVILLE MOE 2013-05-13 -1 9 -10
NUNAVUT KUGLUKTUK A 2013-05-08 -22.4 -12.4 -10
SASKATCHEWAN LANGENBURG 2013-05-02 -9 1 -10
SASKATCHEWAN MUENSTER 2013-05-11 -6.5 3.5 -10
SASKATCHEWAN REGINA INTL A 2013-05-01 -8.4 1.6 -10
NUNAVUT CAMBRIDGE BAY A 2013-05-02 -29.3 -19.4 -9.9
ONTARIO KINGSVILLE MOE 2013-05-25 1.5 11.4 -9.9
ONTARIO ST THOMAS WPCP 2013-05-25 -0.5 9.4 -9.9
SASKATCHEWAN CORONACH 2013-05-11 -6.5 3.3 -9.8
SASKATCHEWAN CORONACH SPC 2013-05-11 -6.5 3.3 -9.8
NUNAVUT KUGLUKTUK A 2013-05-04 -23.9 -14.1 -9.8
MANITOBA MCCREARY 2013-05-02 -8.4 1.4 -9.8
ONTARIO NEW GLASGOW 2013-05-27 0.5 10.3 -9.8
SASKATCHEWAN PARKERVIEW 2013-05-02 -8 1.8 -9.8
MANITOBA PINAWA WNRE 2013-05-03 -8 1.8 -9.8
SASKATCHEWAN SWIFT CURRENT CDA 2013-05-01 -8 1.8 -9.8
ALBERTA COLD LAKE A 2013-05-01 -8.1 1.6 -9.7
SASKATCHEWAN KEY LAKE 2013-05-08 -11 -1.3 -9.7
SASKATCHEWAN OUTLOOK PFRA 2013-05-11 -5.7 4 -9.7
ONTARIO FOLDENS 2013-05-25 0 9.6 -9.6
MANITOBA HODGSON 2 2013-05-12 -8 1.6 -9.6
SASKATCHEWAN PARKERVIEW 2013-05-01 -8 1.6 -9.6
SASKATCHEWAN BUFFALO POUND LAKE 2013-05-01 -7.5 2 -9.5
NUNAVUT RESOLUTE CARS 2013-05-10 -26.1 -16.6 -9.5
SASKATCHEWAN BROADVIEW 2013-05-01 -8.4 1 -9.4
NUNAVUT CAMBRIDGE BAY A 2013-05-06 -26.9 -17.5 -9.4
ALBERTA LLOYDMINSTER A 2013-05-01 -8.2 1.2 -9.4
ONTARIO NEW GLASGOW 2013-05-25 0.5 9.9 -9.4
MANITOBA THOMPSON A 2013-05-01 -13.5 -4.1 -9.4
SASKATCHEWAN CORONACH 2013-05-01 -8 1.3 -9.3
MANITOBA CROSS LAKE JENPEG 2013-05-02 -10.2 -0.9 -9.3
SASKATCHEWAN MANKOTA 2013-05-01 -8.7 0.6 -9.3
MANITOBA WASAGAMING 2013-05-01 -10.9 -1.6 -9.3
SASKATCHEWAN BUFFALO POUND LAKE 2013-05-02 -7 2.2 -9.2
BRITISH COLUMBIA FT STEELE DANDY CRK 2013-05-02 -8 1.2 -9.2
SASKATCHEWAN LAST MOUNTAIN CS 2013-05-02 -7.6 1.6 -9.2
SASKATCHEWAN ROCK POINT 2013-05-01 -7 2.2 -9.2
ONTARIO CHAPLEAU A 2013-05-13 -7.1 2 -9.1
MANITOBA FLIN FLON 2013-05-01 -8.5 0.6 -9.1
SASKATCHEWAN MUENSTER 2013-05-01 -7.5 1.6 -9.1
ONTARIO NEW GLASGOW 2013-05-26 1 10.1 -9.1
SASKATCHEWAN REGINA INTL A 2013-05-11 -5.4 3.7 -9.1
NUNAVUT BAKER LAKE A 2013-05-08 -21.5 -12.5 -9
NUNAVUT CAMBRIDGE BAY A 2013-05-03 -27.9 -18.9 -9
SASKATCHEWAN QUAPPELLE 1 2013-05-01 -7.5 1.5 -9
BRITISH COLUMBIA CASTLEGAR A 2013-05-01 -4.7 4.2 -8.9
MANITOBA GILBERT PLAINS 2013-05-23 -4 4.9 -8.9
ONTARIO HARTINGTON IHD 2013-05-24 0 8.9 -8.9
SASKATCHEWAN LAST MOUNTAIN CS 2013-05-01 -7.5 1.4 -8.9
MANITOBA PILOT MOUND (AUT) 2013-05-12 -4.9 4 -8.9
NUNAVUT CAMBRIDGE BAY A 2013-05-04 -27.2 -18.4 -8.8
MANITOBA CROSS LAKE JENPEG 2013-05-01 -10 -1.2 -8.8
MANITOBA GRAND RAPIDS HYDRO 2013-05-24 -4 4.8 -8.8
MANITOBA ARBORG 2013-05-02 -8 0.7 -8.7
NUNAVUT BAKER LAKE A 2013-05-06 -22.1 -13.4 -8.7
NUNAVUT CORAL HARBOUR A 2013-05-08 -22.5 -13.8 -8.7
NUNAVUT BAKER LAKE A 2013-05-10 -20.3 -11.7 -8.6
ALBERTA EDMONTON STONY PLAIN 2013-05-01 -6 2.6 -8.6
QUEBEC LASSOMPTION 2013-05-14 -2.1 6.5 -8.6
ONTARIO OTTAWA CDA 2013-05-14 -0.9 7.7 -8.6
ONTARIO KAPUSKASING A 2013-05-25 -4.6 3.9 -8.5
NUNAVUT KUGLUKTUK A 2013-05-03 -23.1 -14.6 -8.5