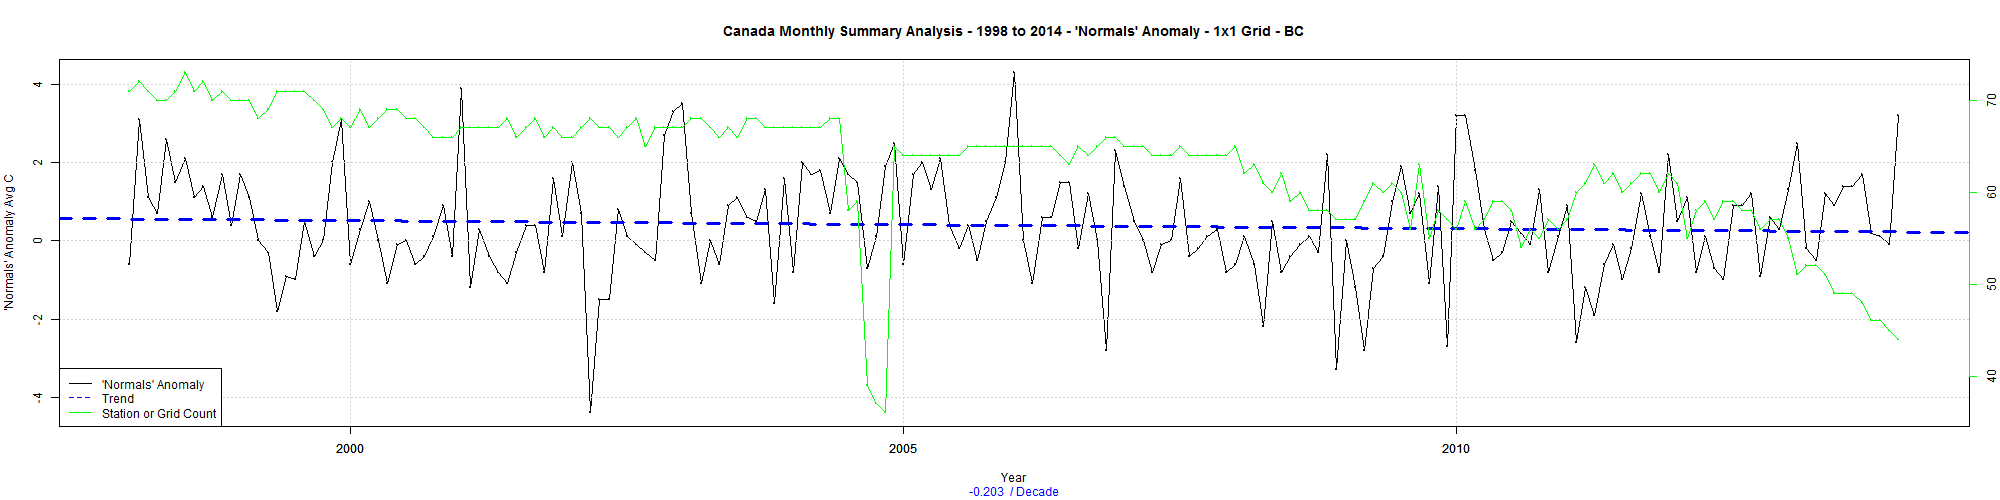
The province of BC in Canada has really cooled off in the last 5 years. This post is an attempt to quantify it.
I am using data from Environment Canada monthly summaries. An example is here.
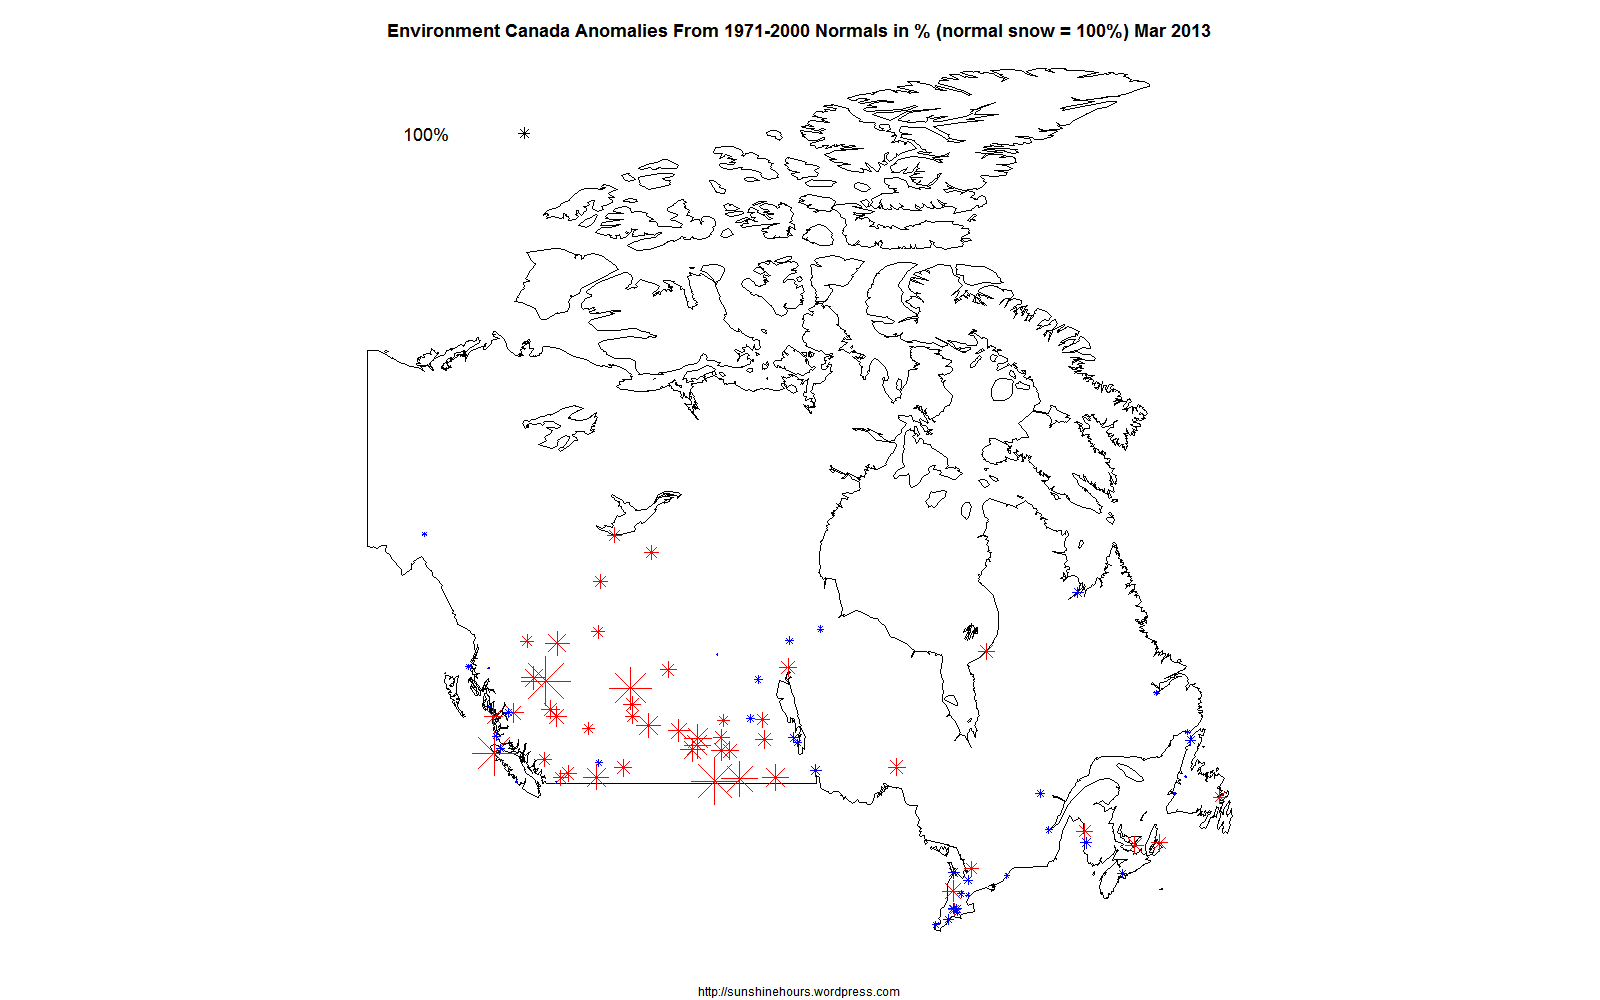
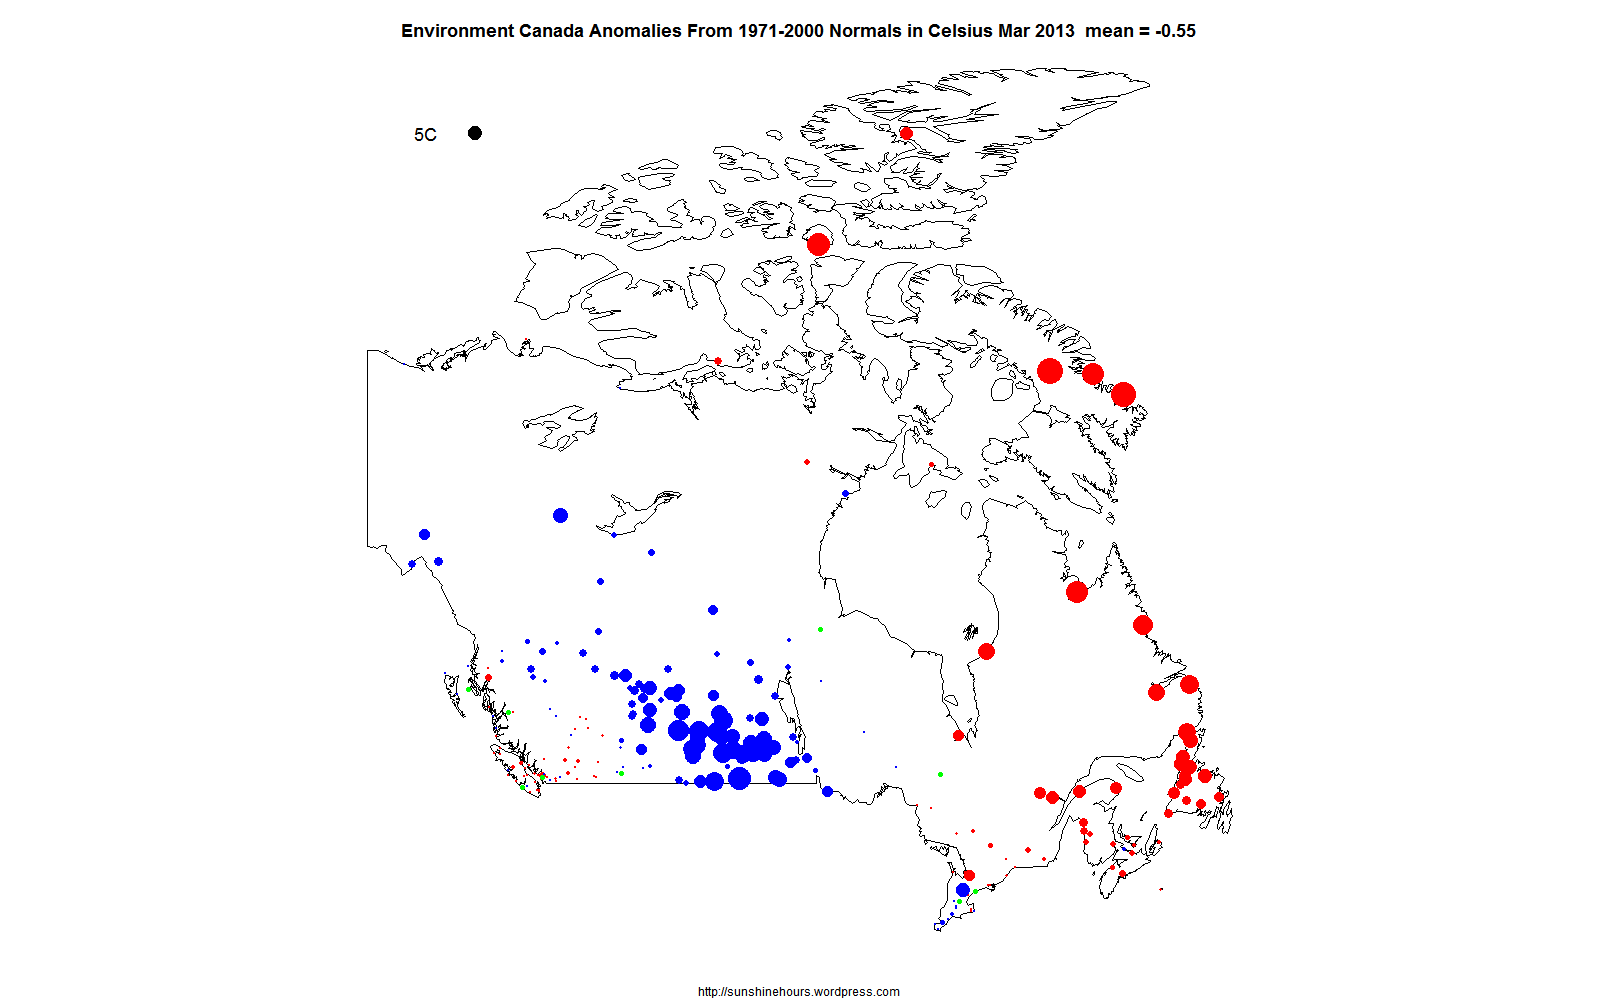
Some of the BC stations have “normals” (anomalies) calculated by EC based on the 1971-2000 average. (The D column in the summaries).
In 2013, there are 661 stations in BC reporting in the monthly summaries. 237 have normals calculated. 143 of those have data in all five of the 5 year periods from 1988 to 2012.
I calculated 5 year averages for each 5 year period : 1988-1992, 1993-1997, 1998-2002, 2003-2007 and 2008 to 2012.
And then I ranked them so that 1 would be the warmest and 5 would be the coldest. If there had been steadily rising temperatures from 1988 to 2012, the rank would be 5 4 3 2 1.
An example with a rank of 4 5 3 2 1 is Wardner Ktny Hatchery. Not quite a 5 4 3 2 1 ranking because it cooled a bit in 1993-1997 compared to 1988-1992.
The anomaly rose from .62C in 1988-1992 to 1.28C in 2008-2012.
| Prov |
Stn_Name |
1988-1992 |
1993-1997 |
1998-2002 |
2003-2007 |
2008-2012 |
Rank |
| BC |
WARDNER KTNY HATCHERY |
0.62 |
0.07 |
0.79 |
1.07 |
1.28 |
4 5 3 2 1 |
So, how many of the 143 have a rank of 5 4 3 2 1? None.
Ok, how many of the 143 have a rank ending with 1 (meaning 2008-2012 was the warmest 5 year period)? One. Wardner Ktny Hatchery. As shown above.
How about those with a rank ending in 2 (meaning the most current 5 year period is the 2nd warmest? Two out of 143.
16 end with a 3 (meaning the most current 5 year period is the 3rd warmest).
42 end with a 4 (meaning the most current 5 year period is the 4th warmest).
82 end with a 5 (meaning the most current 5 year period is the coldest in the last 25 years)!!!!
124 out of 143 stations have the coldest or 2nd coldest 5 year period.
All 143 below:
| Prov |
Stn Name |
1988-1992 |
1993-1997 |
1998-2002 |
2003-2007 |
2008-2012 |
Rank |
| BC |
ABBOTSFORD A |
0.47 |
0.54 |
0.57 |
1 |
0.31 |
4 3 2 1 5 |
| BC |
ADDENBROKE ISLAND |
0 |
0.05 |
0.16 |
0.67 |
-0.18 |
4 3 2 1 5 |
| BC |
AGASSIZ CDA |
0.41 |
0.42 |
0.29 |
0.77 |
0.16 |
3 2 4 1 5 |
| BC |
ALBERNI ROBERTSON CREEK |
0.41 |
0.46 |
0.44 |
0.49 |
0.25 |
4 2 3 1 5 |
| BC |
ATLIN |
0.58 |
0.19 |
1.01 |
1.01 |
0.05 |
3 4 2 1 5 |
| BC |
BABINE LAKE PINKUT CREEK |
0.84 |
0.04 |
0.66 |
0.99 |
0.85 |
3 5 4 1 2 |
| BC |
BARKERVILLE |
0.28 |
-0.09 |
0.09 |
0.44 |
-1.08 |
2 4 3 1 5 |
| BC |
BELLA COOLA A |
0.31 |
-0.43 |
-0.12 |
0.23 |
-0.25 |
1 5 3 2 4 |
| BC |
BLUE RIVER A |
0.48 |
-0.03 |
0.46 |
0.82 |
0.36 |
2 5 3 1 4 |
| BC |
BOAT BLUFF |
0.18 |
0.26 |
-0.27 |
0.28 |
-0.15 |
3 2 5 1 4 |
| BC |
BONILLA ISLAND |
0.24 |
0.63 |
0.17 |
0.74 |
-0.12 |
3 2 4 1 5 |
| BC |
BRIDGE LAKE 2 |
0.34 |
-0.37 |
-0.05 |
0.24 |
-0.26 |
1 5 3 2 4 |
| BC |
BURNABY SIMON FRASER U |
0.44 |
0.44 |
-0.06 |
0.46 |
-0.13 |
3 2 4 1 5 |
| BC |
CAMPBELL RIVER A |
0.51 |
0.46 |
0.44 |
0.87 |
0.41 |
2 3 4 1 5 |
| BC |
CAPE BEALE LIGHT |
0.02 |
0.18 |
-0.2 |
0.41 |
-0.23 |
3 2 4 1 5 |
| BC |
CAPE MUDGE |
0.37 |
-0.18 |
0.17 |
0.54 |
0.27 |
2 5 4 1 3 |
| BC |
CAPE SCOTT |
0.23 |
0.66 |
0.08 |
0.4 |
-0.31 |
3 1 4 2 5 |
| BC |
CARIBOO LODGE |
0.35 |
-0.21 |
0.29 |
0.47 |
-0.63 |
2 4 3 1 5 |
| BC |
CASTLEGAR A |
0.35 |
0.06 |
0.56 |
0.8 |
0.1 |
3 5 2 1 4 |
| BC |
CASTLEGAR BCHPA DAM |
0.28 |
0.06 |
0.98 |
1.28 |
0.74 |
4 5 2 1 3 |
| BC |
CHATHAM POINT |
0.29 |
0.27 |
0.46 |
0.77 |
0.17 |
3 4 2 1 5 |
| BC |
CHETWYND A |
0.44 |
-0.69 |
0.16 |
0.44 |
-0.02 |
2 5 3 1 4 |
| BC |
CHILLIWACK |
0.19 |
0.04 |
0.13 |
0.57 |
-0.09 |
2 4 3 1 5 |
| BC |
CHILLIWACK R HATCHERY |
0.12 |
0.11 |
0.08 |
0.41 |
-0.36 |
2 3 4 1 5 |
| BC |
COMOX A |
0.38 |
0.31 |
0.32 |
0.66 |
0.06 |
2 4 3 1 5 |
| BC |
COOMBS |
0.01 |
0.22 |
0.23 |
0.78 |
0.46 |
5 4 3 1 2 |
| BC |
COWICHAN LAKE FORESTRY |
0.35 |
0.32 |
0.22 |
0.6 |
-0.67 |
2 3 4 1 5 |
| BC |
CRANBROOK A |
0.48 |
-0.14 |
0.52 |
0.74 |
0.18 |
3 5 2 1 4 |
| BC |
CRESTON |
0.24 |
0.17 |
0.74 |
1.13 |
0.27 |
4 5 2 1 3 |
| BC |
DARFIELD |
0.26 |
-0.24 |
0.5 |
0.74 |
0.14 |
3 5 2 1 4 |
| BC |
DAWSON CREEK A |
0.7 |
-0.36 |
0.42 |
0.55 |
0.01 |
1 5 3 2 4 |
| BC |
DEASE LAKE |
0.44 |
0.24 |
0.52 |
0.66 |
0.08 |
3 4 2 1 5 |
| BC |
DRYAD POINT |
0.16 |
0.3 |
-0.01 |
0.41 |
-0.39 |
3 2 4 1 5 |
| BC |
DUNCAN LAKE DAM |
0.37 |
0.09 |
0.57 |
0.81 |
0.11 |
3 5 2 1 4 |
| BC |
EGG ISLAND |
0.26 |
0.56 |
0.3 |
0.45 |
-0.11 |
4 1 3 2 5 |
| BC |
ESTEVAN POINT |
0.38 |
0.39 |
0.27 |
0.64 |
-0.15 |
3 2 4 1 5 |
| BC |
FAUQUIER |
0.5 |
0.03 |
0.54 |
0.76 |
-0.18 |
3 4 2 1 5 |
| BC |
FERNIE |
0.58 |
-0.08 |
0.64 |
1.13 |
0.44 |
3 5 2 1 4 |
| BC |
FORDING RIVER COMINCO |
-0.14 |
-0.5 |
0.55 |
0.94 |
-0.63 |
3 4 2 1 5 |
| BC |
FORT NELSON A |
0.1 |
0.08 |
0.64 |
0.8 |
0.39 |
4 5 2 1 3 |
| BC |
FORT ST JAMES |
0.78 |
-0.02 |
0.47 |
0.8 |
0.2 |
2 5 3 1 4 |
| BC |
FORT ST JOHN A |
0.66 |
-0.28 |
0.54 |
0.58 |
0.13 |
1 5 3 2 4 |
| BC |
FRASER LAKE NORTH SHORE |
0.81 |
0.28 |
0.83 |
1.2 |
0.8 |
3 5 2 1 4 |
| BC |
FT STEELE DANDY CRK |
0.46 |
-0.11 |
0.32 |
0.89 |
0.04 |
2 5 3 1 4 |
| BC |
GABRIOLA ISLAND |
0.16 |
0.22 |
-0.17 |
0.45 |
-0.64 |
3 2 4 1 5 |
| BC |
GERMANSEN LANDING |
0.75 |
0.2 |
0.5 |
0.86 |
0.44 |
2 5 3 1 4 |
| BC |
GIBSONS GOWER POINT |
0.32 |
0.31 |
0.38 |
0.82 |
0.3 |
3 4 2 1 5 |
| BC |
GLACIER NP MT FIDELITY |
0.31 |
0.05 |
0.44 |
0.74 |
-0.31 |
3 4 2 1 5 |
| BC |
GLACIER NP ROGERS PASS |
0.35 |
0.12 |
0.52 |
0.9 |
-0.01 |
3 4 2 1 5 |
| BC |
GOLD RIVER TOWNSITE |
0.25 |
0.22 |
0.2 |
0.69 |
0.05 |
2 3 4 1 5 |
| BC |
GOLDEN A |
0.58 |
0.18 |
0.87 |
1.02 |
0.5 |
3 5 2 1 4 |
| BC |
GOLDSTREAM RIVER |
0.15 |
-0.42 |
0.38 |
0.49 |
-2.05 |
3 4 2 1 5 |
| BC |
GRAND FORKS |
0.41 |
-0.01 |
0.79 |
0.83 |
0 |
3 5 2 1 4 |
| BC |
GREEN ISLAND |
0.02 |
0.14 |
0.1 |
0.53 |
-0.12 |
4 2 3 1 5 |
| BC |
HANEY EAST |
-0.16 |
0.28 |
0.32 |
0.83 |
0 |
5 3 2 1 4 |
| BC |
HANEY UBC RF ADMIN |
0.33 |
0.46 |
0.3 |
0.72 |
0.02 |
3 2 4 1 5 |
| BC |
HIGHLAND VALLEY LORNEX |
0.84 |
0.08 |
0.39 |
1.08 |
0.43 |
2 5 4 1 3 |
| BC |
HIXON |
0.58 |
-0.03 |
0.57 |
0.91 |
-0.3 |
2 4 3 1 5 |
| BC |
HOPE SLIDE |
0.5 |
0.03 |
-0.05 |
0.54 |
-0.13 |
2 3 4 1 5 |
| BC |
JOE RICH CREEK |
0.62 |
-0.04 |
0.7 |
0.98 |
-0.54 |
3 4 2 1 5 |
| BC |
KAMLOOPS A |
0.42 |
-0.13 |
0.65 |
1.02 |
0.5 |
4 5 2 1 3 |
| BC |
KASLO |
0.44 |
0.02 |
0.51 |
0.94 |
0.09 |
3 5 2 1 4 |
| BC |
KEMANO |
0.7 |
0.56 |
0.28 |
0.97 |
-0.5 |
2 3 4 1 5 |
| BC |
KITIMAT 2 |
0.58 |
0.3 |
0.02 |
0.56 |
-0.68 |
1 3 4 2 5 |
| BC |
KITIMAT TOWNSITE |
0.72 |
0.53 |
0.41 |
1.01 |
0.06 |
2 3 4 1 5 |
| BC |
KOOTENAY NP WEST GATE |
0.21 |
0.01 |
0.63 |
0.71 |
0.26 |
4 5 2 1 3 |
| BC |
LAIDLAW |
0.28 |
-0.12 |
0.18 |
0.56 |
-0.37 |
2 4 3 1 5 |
| BC |
LANGARA |
0.25 |
0.34 |
0.02 |
0.5 |
-0.32 |
3 2 4 1 5 |
| BC |
LITTLE QUALICUM HATCHERY |
0.15 |
0.14 |
0.16 |
0.53 |
-0.1 |
3 4 2 1 5 |
| BC |
LUNCH LAKE |
0.35 |
-0.39 |
0.14 |
0.24 |
-0.47 |
1 4 3 2 5 |
| BC |
MACKENZIE A |
0.78 |
0.26 |
0.7 |
1.14 |
0.39 |
2 5 3 1 4 |
| BC |
MALIBU JERVIS INLET |
0.2 |
0.16 |
0.14 |
0.63 |
-0.02 |
2 3 4 1 5 |
| BC |
MARYSVILLE |
0.25 |
-0.09 |
0.61 |
1.08 |
-0.5 |
3 4 2 1 5 |
| BC |
MCINNES ISLAND |
0.2 |
0.51 |
0.18 |
0.51 |
-0.18 |
3 2 4 1 5 |
| BC |
MCLEESE LAKE FRASERVIEW |
0.08 |
-0.31 |
1 |
1.4 |
0.25 |
4 5 2 1 3 |
| BC |
MCLEESE LAKE GRANITE MT |
0.52 |
0.05 |
0.26 |
0.55 |
0 |
2 4 3 1 5 |
| BC |
MERRITT STP |
0.6 |
-0.01 |
0.69 |
1.08 |
0.47 |
3 5 2 1 4 |
| BC |
MERRY ISLAND LIGHTSTATIO |
0.3 |
0.43 |
0.21 |
0.76 |
0.35 |
4 2 5 1 3 |
| BC |
MICA DAM |
0.52 |
-0.02 |
0.64 |
0.72 |
-0.02 |
3 5 2 1 4 |
| BC |
MISSION WEST ABBEY |
0.24 |
0.45 |
0.17 |
0.43 |
-0.32 |
3 1 4 2 5 |
| BC |
MUD BAY |
0.32 |
0.4 |
-0.01 |
0.88 |
-0.55 |
3 2 4 1 5 |
| BC |
MUNCHO LAKE |
0.59 |
0.49 |
0.68 |
0.86 |
-0.24 |
3 4 2 1 5 |
| BC |
N VAN SEYMOUR HATCHERY |
0.21 |
0.15 |
0.12 |
0.27 |
-0.38 |
2 3 4 1 5 |
| BC |
N VANC GROUSE MTN RESORT |
0.44 |
0.22 |
0.93 |
0.96 |
-0.04 |
3 4 2 1 5 |
| BC |
NANAIMO A |
0.35 |
0.32 |
0.22 |
0.56 |
0.13 |
2 3 4 1 5 |
| BC |
NASS CAMP |
0.35 |
0.1 |
0.29 |
0.79 |
-0.05 |
2 4 3 1 5 |
| BC |
NEW DENVER |
0.46 |
-0.06 |
0.8 |
1.2 |
0.33 |
3 5 2 1 4 |
| BC |
NITINAT RIVER HATCHERY |
0.25 |
0.3 |
-0.23 |
0.38 |
-0.31 |
3 2 4 1 5 |
| BC |
NOOTKA LIGHTSTATION |
0.02 |
0.25 |
-0.15 |
0.29 |
-0.6 |
3 2 4 1 5 |
| BC |
OLIVER |
0.65 |
0.37 |
1.23 |
1.34 |
0.16 |
3 4 2 1 5 |
| BC |
OLIVER STP |
0.33 |
0.17 |
1 |
1.12 |
0.53 |
4 5 2 1 3 |
| BC |
OOTSA L SKINS L SPILLWAY |
0.9 |
-0.55 |
-0.3 |
0.46 |
-0.98 |
1 4 3 2 5 |
| BC |
OSOYOOS WEST |
0.44 |
-0.04 |
0.77 |
0.93 |
0.21 |
3 5 2 1 4 |
| BC |
PACHENA POINT |
0.37 |
0.98 |
-0.65 |
-0.15 |
-0.28 |
2 1 5 3 4 |
| BC |
PEACHLAND |
0.4 |
-0.07 |
0.34 |
0.61 |
0.26 |
2 5 3 1 4 |
| BC |
PENTICTON A |
0.46 |
-0.12 |
0.63 |
0.82 |
0.07 |
3 5 2 1 4 |
| BC |
PLEASANT CAMP |
0.18 |
0.29 |
0.26 |
0.44 |
-0.58 |
4 2 3 1 5 |
| BC |
PORT ALICE |
0.4 |
0.4 |
-0.03 |
0.49 |
-0.01 |
3 2 5 1 4 |
| BC |
PORT HARDY A |
0.35 |
0.42 |
0.21 |
0.63 |
-0.08 |
3 2 4 1 5 |
| BC |
PORT MOODY GLENAYRE |
0.31 |
0.4 |
0.05 |
0.24 |
-0.43 |
2 1 4 3 5 |
| BC |
PORT RENFREW |
0.33 |
0.44 |
0.22 |
0.7 |
0.05 |
3 2 4 1 5 |
| BC |
POWELL RIVER A |
0.34 |
0.34 |
0.25 |
0.48 |
-0.05 |
3 2 4 1 5 |
| BC |
PRINCE GEORGE A |
0.5 |
-0.01 |
0.56 |
0.81 |
-0.2 |
3 4 2 1 5 |
| BC |
PRINCE GEORGE STP |
0.25 |
-0.3 |
0.16 |
0.65 |
0.07 |
2 5 3 1 4 |
| BC |
PRINCETON A |
0.4 |
0.08 |
0.64 |
0.7 |
0.08 |
3 5 2 1 4 |
| BC |
PUNTCHESAKUT LAKE |
0.45 |
-0.22 |
0.55 |
0.58 |
-0.9 |
3 4 2 1 5 |
| BC |
QUALICUM R FISH RESEARCH |
0.35 |
0.26 |
0.4 |
0.78 |
0.38 |
4 5 2 1 3 |
| BC |
QUATSINO |
0.64 |
0.54 |
0.09 |
0.34 |
-0.62 |
1 2 4 3 5 |
| BC |
QUATSINO LIGHTSTATION |
0.12 |
0.32 |
-0.38 |
0.38 |
-0.24 |
3 2 5 1 4 |
| BC |
QUINSAM RIVER HATCHERY |
0.3 |
0.35 |
0.23 |
0.54 |
-0.21 |
3 2 4 1 5 |
| BC |
RICHMOND NATURE PARK |
0.31 |
0.32 |
0.32 |
0.37 |
-0.1 |
4 3 2 1 5 |
| BC |
SAANICHTON CDA |
0.27 |
0.38 |
0.31 |
0.58 |
-0.3 |
4 2 3 1 5 |
| BC |
SALMON ARM A |
0.32 |
-0.38 |
0.6 |
1.03 |
0.24 |
3 5 2 1 4 |
| BC |
SALTSPRING ST MARYS L |
0.29 |
0.34 |
0.48 |
0.7 |
0.15 |
4 3 2 1 5 |
| BC |
SANDSPIT A |
0.3 |
0.28 |
-0.01 |
0.47 |
-0.3 |
2 3 4 1 5 |
| BC |
SARDIS |
0.21 |
0.09 |
-0.26 |
0.16 |
-1.96 |
1 3 4 2 5 |
| BC |
SEWALL MASSET INLET |
0.13 |
0.4 |
-0.14 |
0.29 |
-0.33 |
3 1 4 2 5 |
| BC |
SHAWNIGAN LAKE |
0.5 |
0.36 |
0.22 |
0.78 |
-0.07 |
2 3 4 1 5 |
| BC |
SMITHERS A |
0.58 |
-0.12 |
0.26 |
0.66 |
0.14 |
2 5 3 1 4 |
| BC |
SOUTH SLOCAN |
0.77 |
0.38 |
0.97 |
1.27 |
-0.4 |
3 4 2 1 5 |
| BC |
SPARWOOD |
0.18 |
-0.48 |
0.43 |
0.77 |
0.12 |
3 5 2 1 4 |
| BC |
SPOKIN LAKE 4E |
0.04 |
-0.21 |
0.38 |
0.47 |
-0.16 |
3 5 2 1 4 |
| BC |
SQUAMISH UPPER |
0.47 |
-0.3 |
0.08 |
0.44 |
-0.12 |
1 5 3 2 4 |
| BC |
STEWART A |
0.16 |
0.09 |
0.1 |
0.38 |
-0.36 |
2 4 3 1 5 |
| BC |
STUIE TWEEDSMUIR LODGE |
-0.01 |
0.01 |
0.28 |
0.64 |
0.04 |
5 4 2 1 3 |
| BC |
SUSKWA VALLEY |
0.27 |
-0.47 |
0.06 |
0.54 |
-0.68 |
2 4 3 1 5 |
| BC |
TERRACE A |
0.47 |
0.25 |
0.07 |
0.62 |
-0.08 |
2 3 4 1 5 |
| BC |
TERRACE PCC |
0.53 |
0.44 |
0.43 |
0.95 |
0.2 |
2 3 4 1 5 |
| BC |
TOFINO A |
0.36 |
0.49 |
0.07 |
0.69 |
0.13 |
3 2 5 1 4 |
| BC |
TOPLEY LANDING |
0.64 |
-0.04 |
0.38 |
0.96 |
0.18 |
2 5 3 1 4 |
| BC |
VANCOUVER HARBOUR CS |
0.3 |
0.62 |
0.32 |
0.22 |
-0.1 |
3 1 2 4 5 |
| BC |
VANCOUVER INTL A |
0.34 |
0.38 |
0.37 |
0.72 |
0.19 |
4 2 3 1 5 |
| BC |
VANDERHOOF |
0.23 |
-0.33 |
0.35 |
0.57 |
0.05 |
3 5 2 1 4 |
| BC |
VAVENBY |
0.38 |
-0.11 |
0.66 |
0.82 |
0.61 |
4 5 2 1 3 |
| BC |
VERNON BELLA VISTA |
0 |
-0.21 |
0.47 |
0.81 |
0.08 |
4 5 2 1 3 |
| BC |
VICTORIA INTL A |
0.15 |
0.5 |
0.43 |
0.78 |
0.06 |
4 2 3 1 5 |
| BC |
WARDNER KTNY HATCHERY |
0.62 |
0.07 |
0.79 |
1.07 |
1.28 |
4 5 3 2 1 |
| BC |
WASA |
-0.16 |
-0.13 |
0.86 |
1.09 |
0.54 |
5 4 2 1 3 |
| BC |
WESTWOLD |
0.48 |
-0.07 |
0.94 |
0.9 |
0.2 |
3 5 1 2 4 |
| BC |
WHISTLER |
0.48 |
0.34 |
0.58 |
0.88 |
0.08 |
3 4 2 1 5 |
| BC |
WILLIAM HEAD |
0.36 |
0.58 |
0.68 |
0.9 |
0.3 |
4 3 2 1 5 |
| BC |
WILLIAMS LAKE A |
0.53 |
-0.16 |
0.51 |
0.7 |
0.22 |
2 5 3 1 4 |
| BC |
WINFIELD |
0.56 |
0.04 |
0.85 |
1.11 |
0.6 |
4 5 2 1 3 |


