This is another post on USHCN warming. You can read more here.
USHCN puts out a monthly dataset every day. For the last month or so I was using the data I downloaded on on 20140509. I have been using the Final tavg data.
Today I downloaded the 20140621 version from here: ftp://ftp.ncdc.noaa.gov/pub/data/ushcn/v2.5
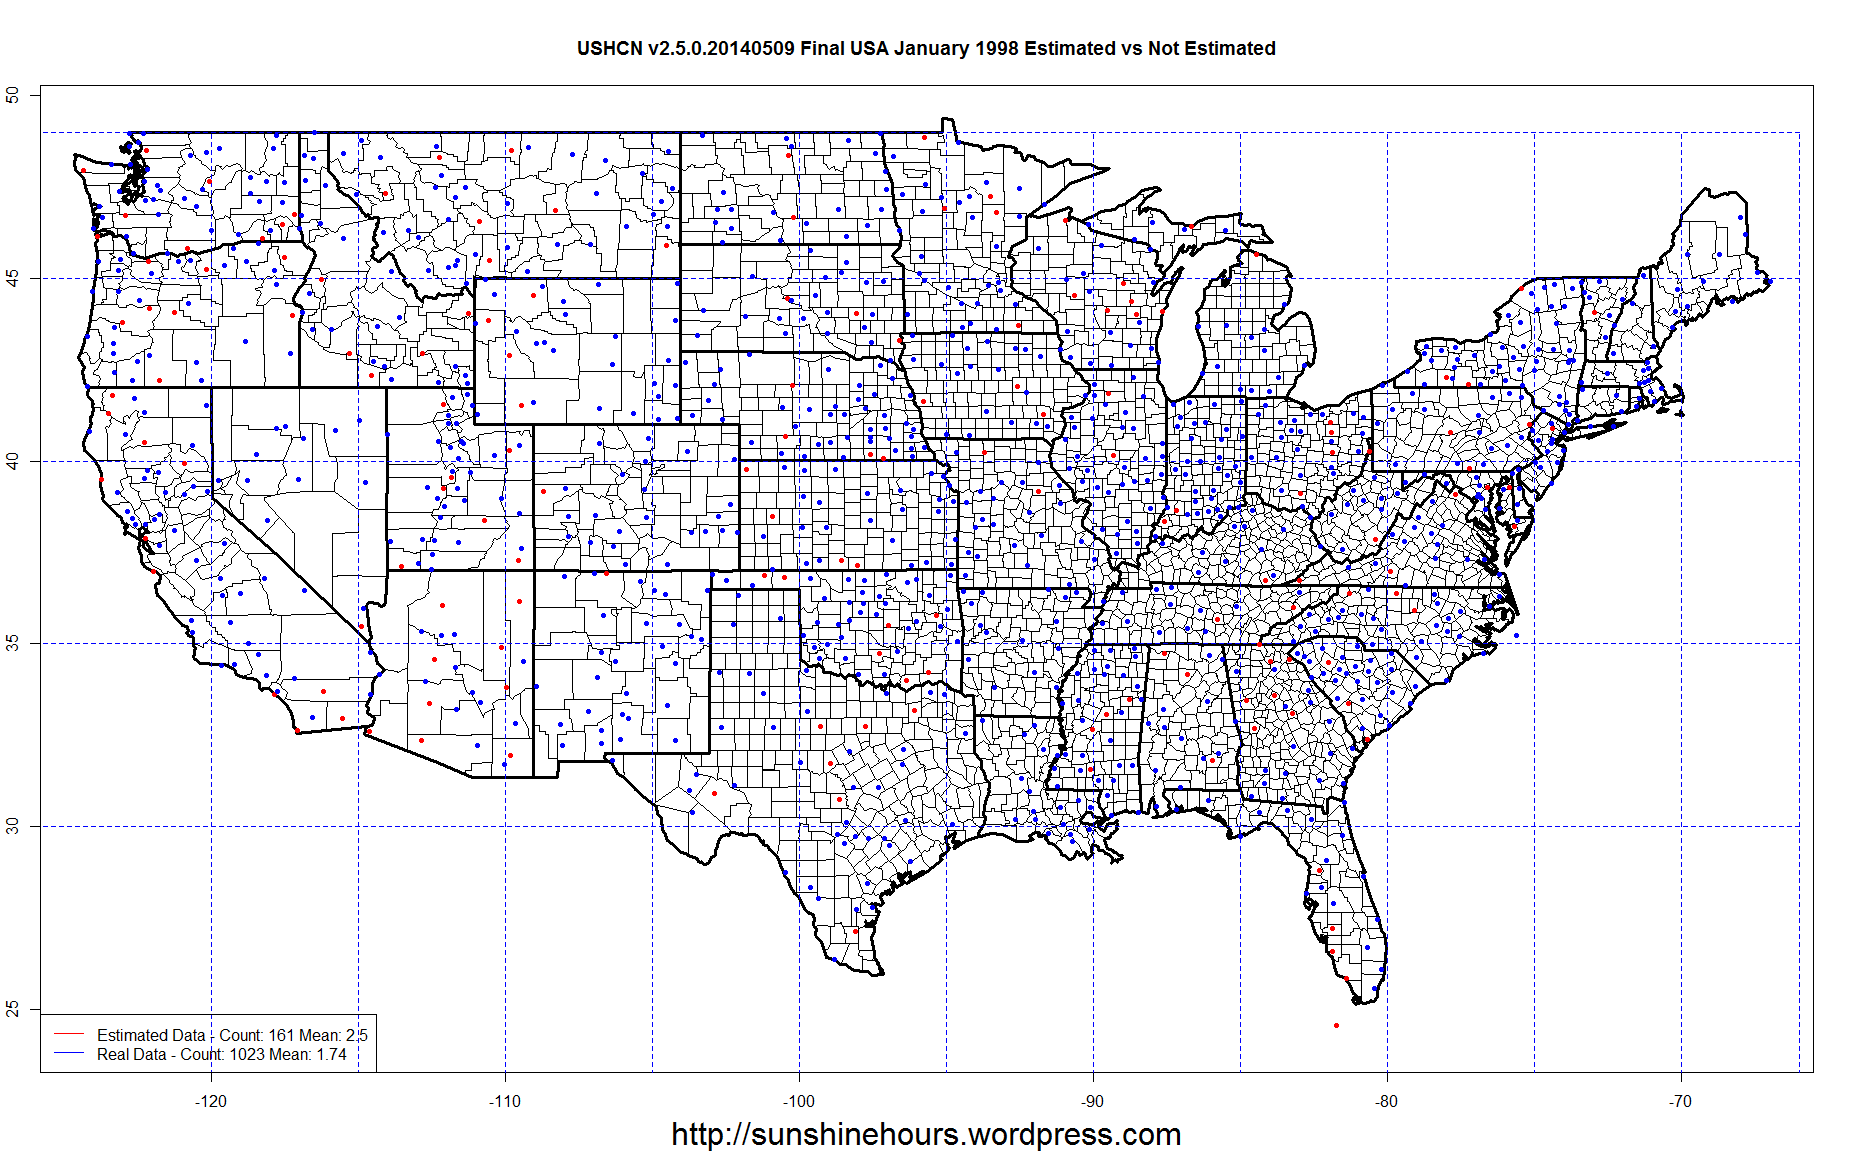
I thought … why not map both sets and compare the average temperature for the USA in Jan 1998 between the two sets of data.
In the legend I placed the count of Real versus Estimated and the average.
I was shocked. They are still warming 1998!
On May 9 the mean of the Estimated data was 2.5C and the mean of the Real Data was 1.74 … which is a .76C spread.
On June 21 the mean of the Estimated data was 2.72C and the mean of the Real Data was 1.7 … which is a 1.02C spread.
OMG. They keep changing the data. And they are still warming 1998!!!


![cag_[ Statewide Avg Temp Anomalies (average between Jan 2014 and May 2014) ]](https://sunshinehours.net/wp-content/uploads/2014/06/cag_-statewide-avg-temp-anomalies-average-between-jan-2014-and-may-2014.jpg)


![cag_[ Statewide Precipitation Anomalies (accumulation between Mar 2014 and Apr 2014) ]](https://sunshinehours.net/wp-content/uploads/2014/05/cag_-statewide-precipitation-anomalies-accumulation-between-mar-2014-and-apr-2014.jpg)

