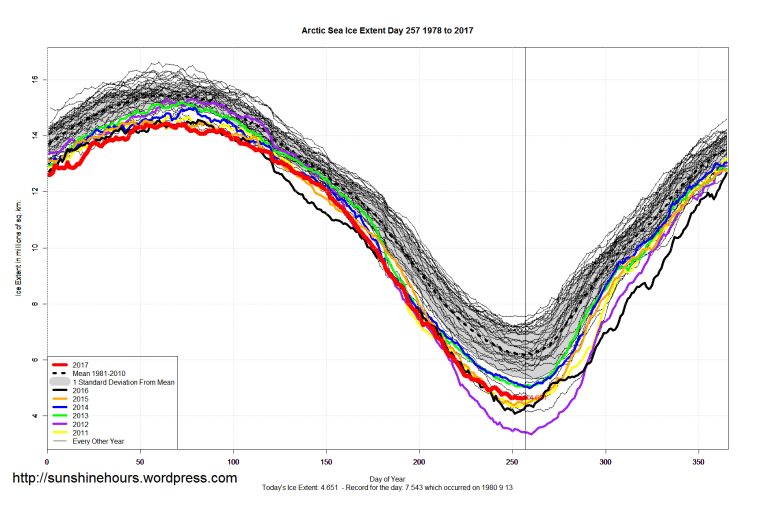
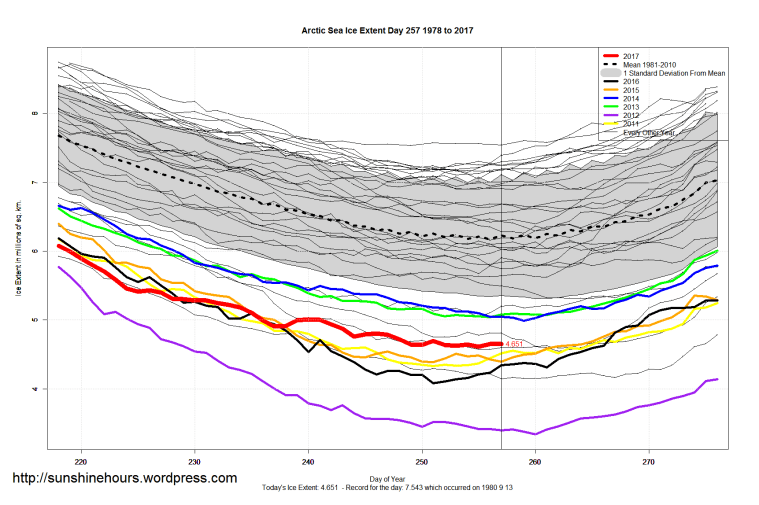
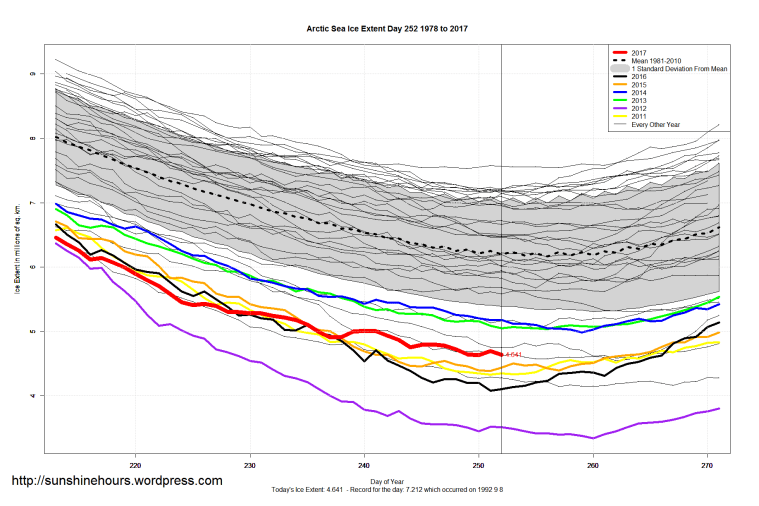
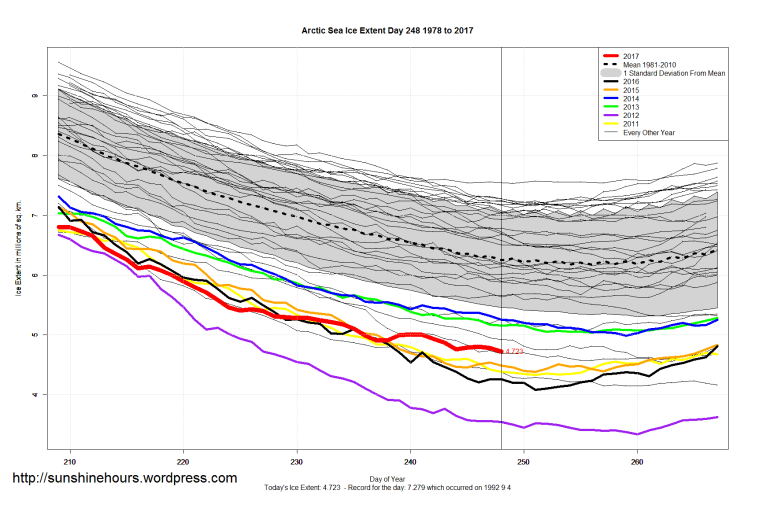
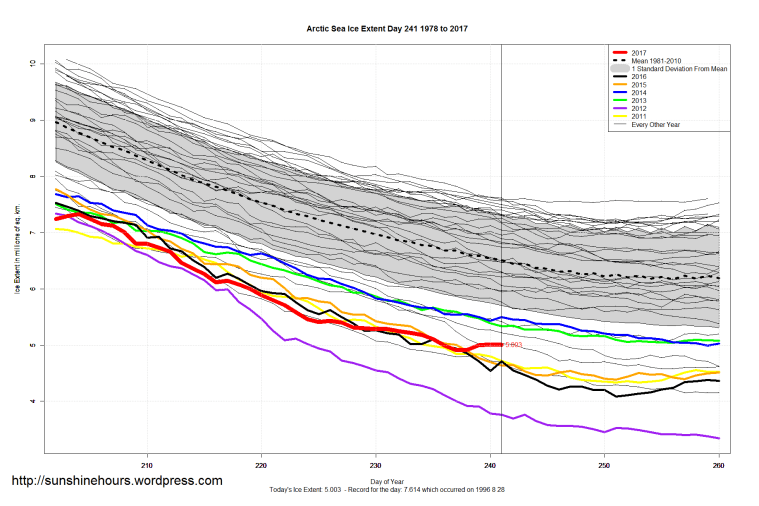
If things hold (and they may), day 255 (three days ago) will be the Arctic minimum for 2017.
That would still be only the 8th lowest.


The concept of “Excess Winter Deaths” is straightforward. Winter kills.
You could save 3 people a day from dying in the winter by raising temps 5C.
If the temperature went up 5C in Ontario, it would kill 4 people a day in summer.
If the temperature went up 5C in Ontario, it would save 7 people a day in winter.
In warm seasons, each 5°C increase in daily mean temperature was associated with a 2.5% increase in nonaccidental deaths (95% confidence interval [CI] = 1.3% to 3.8%) on the day of exposure (lag 0). In cold seasons, each 5°C decrease in daily temperature was associated with a 3.0% (95% CI 1.8% to 4.2%) increase in nonaccidental deaths, which persisted over 7 days (lag 0-6). The cold-related effects (lag 0-6) were stronger for cardiovascular-related deaths (any cardiovascular death: 4.1%, 95% CI 2.3% to 5.9%; ischemic heart disease: 5.8%, 95% CI 3.6% to 8.1%), especially among people less than 65 years of age (8.0%, 95% CI 3.0% to 13.0%). Conversely, heat most strongly increased respiratory-related deaths during admission to hospital (26.0%, 95% CI 0% to 61.4%).
Across Ontario, each 5°C change in daily temperature was estimated to induce 7 excess deaths per day in cold seasons and 4 excess deaths in warm seasons.
Interpretation: Heat contributed to excess deaths in Ontario, although the effect of cold weather appeared to be greater. Further work is required to better define high-risk subgroups, which might include the homeless and people with inadequately heated housing.
If true this makes a huge case for eliminating diesel and switching to Natural Gas for shipping.
“The new study is the first to show ship exhaust can alter thunderstorm intensity. The researchers conclude that particles from ship exhaust make cloud droplets smaller, lifting them higher in the atmosphere. This creates more ice particles and leads to more lightning.
The results provide some of the first evidence that humans are changing cloud formation on a nearly continual basis, rather than after a specific incident like a wildfire, according to the authors. Cloud formation can affect rainfall patterns and alter climate by changing how much sunlight clouds reflect to space.
“It’s one of the clearest examples of how humans are actually changing the intensity of storm processes on Earth through the emission of particulates from combustion,” said Joel Thornton, an atmospheric scientist at the University of Washington in Seattle and lead author of the new study in Geophysical Research Letters, a journal of the American Geophysical Union.
“It is the first time we have, literally, a smoking gun, showing over pristine ocean areas that the lightning amount is more than doubling,” said Daniel Rosenfeld, an atmospheric scientist at the Hebrew University of Jerusalem who was not connected to the study. “The study shows, highly unambiguously, the relationship between anthropogenic emissions — in this case, from diesel engines — on deep convective clouds.””
Lightning
“In the new study, co-author Katrina Virts, an atmospheric scientist at NASA Marshall Space Flight Center in Huntsville, Alabama, was analyzing data from the World Wide Lightning Location Network, a network of sensors that locates lightning strokes all over the globe, when she noticed a nearly straight line of lightning strokes across the Indian Ocean.
Virts and her colleagues compared the lightning location data to maps of ships’ exhaust plumes from a global database of ship emissions. Looking at the locations of 1.5 billion lightning strokes from 2005 to 2016, the team found nearly twice as many lightning strokes on average over major routes ships take across the northern Indian Ocean, through the Strait of Malacca and into the South China Sea, compared to adjacent areas of the ocean that have similar climates.
More than $5 trillion of world trade passes through the South China Sea every year and nearly 100,000 ships pass through the Strait of Malacca alone. Lightning is a measure of storm intensity, and the researchers detected the uptick in lightning at least as far back as 2005.
“All we had to do was make a map of where the lightning was enhanced and a map of where the ships are travelling and it was pretty obvious just from the co-location of both of those that the ships were somehow involved in enhancing lightning,” Thornton said.”
Despite the forces of nature and in spite of the opportunistic efforts of professional opponents, a large nuclear power station located in the middle of Hurricane Harvey’s devastation continues to steadily produce 100% of its rated power output.
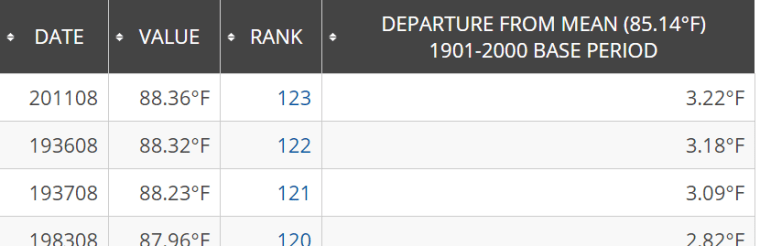
According to the NOAA, August 2017 ranked 30th out of 123 using the Maximum temperature.
A rank of 1 is coldest. A rank of 123 is warmest.
-0.87F below the 1901 to 2000 average.
4F colder than August 2011, 1936 and 1937.

The top 3.
I thought I would look at the year in which daily records for Nanaimo BC (near where I live).
The data starts in 1947 and goes to 2016. You can get data here.
There must be a fingerprint of Extremeness somewhere … right?
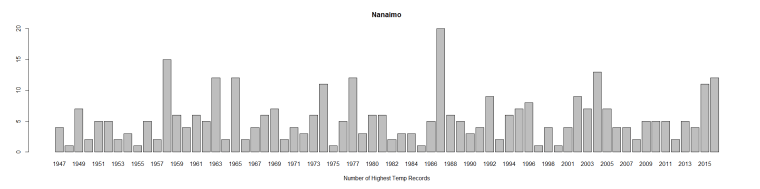
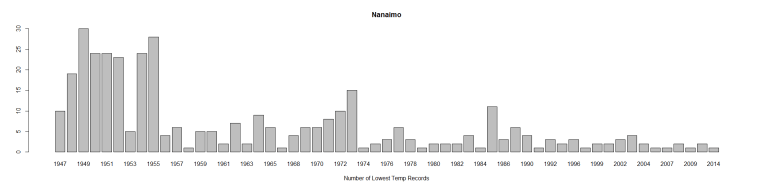
I guess not. The early 40s/50s set a lot of cold records. The high records are all over the place.