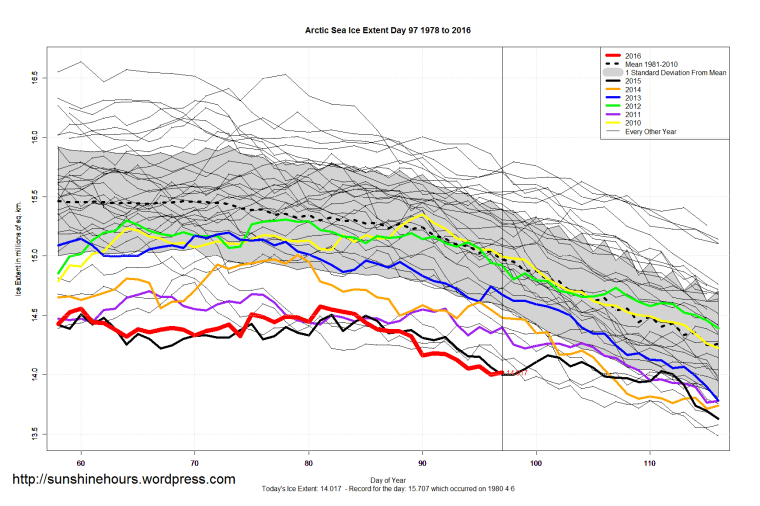
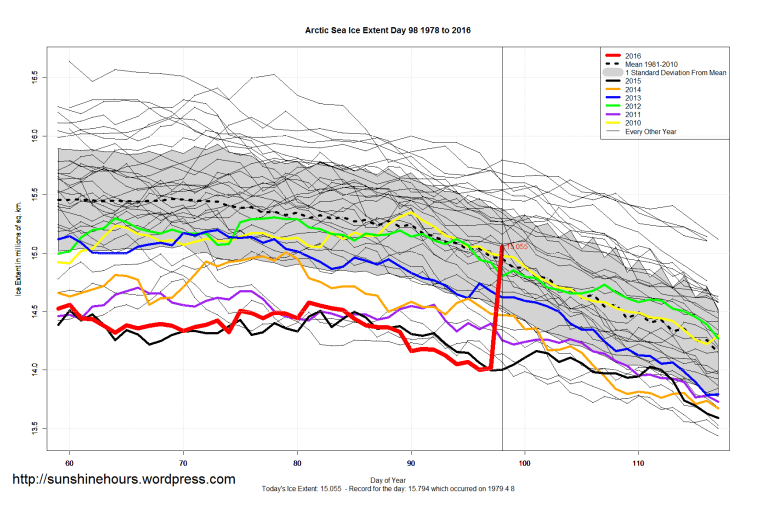
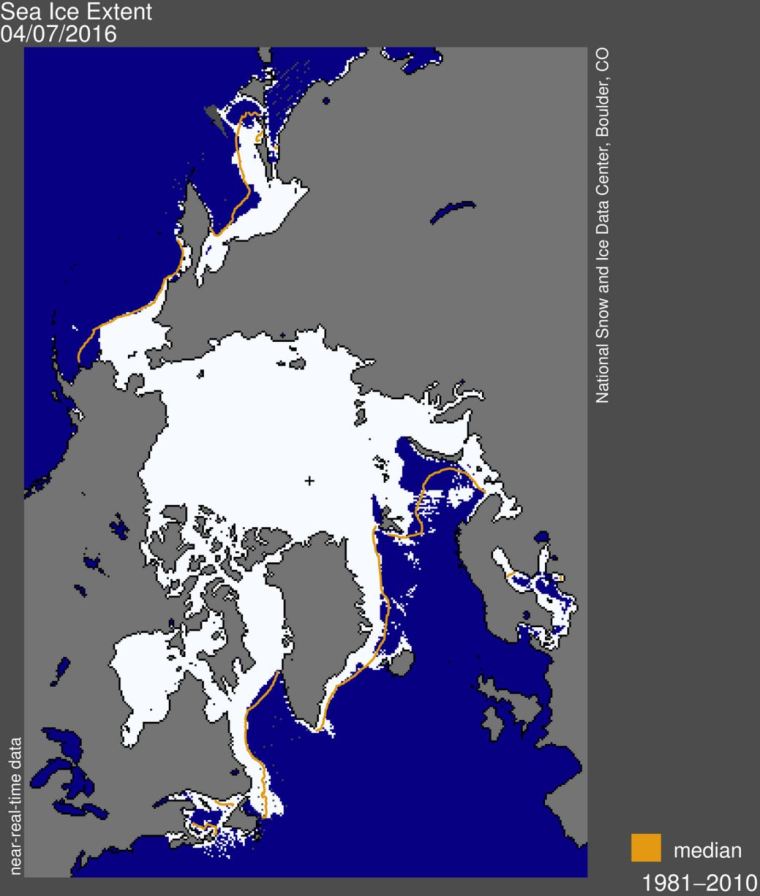
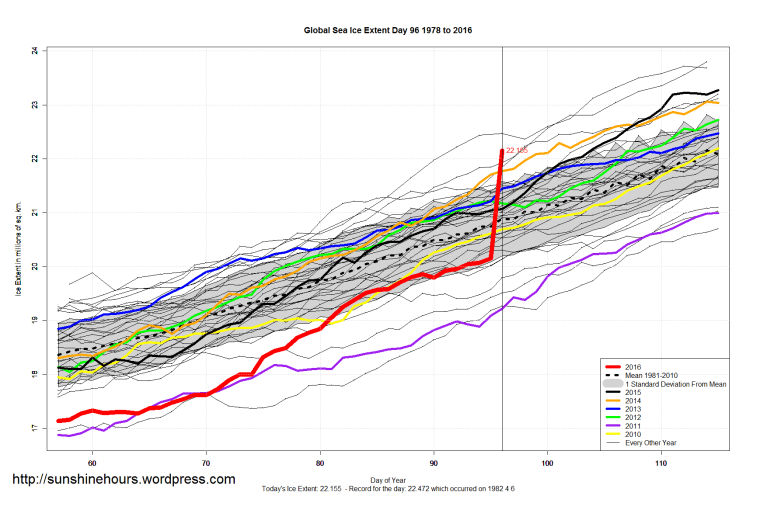
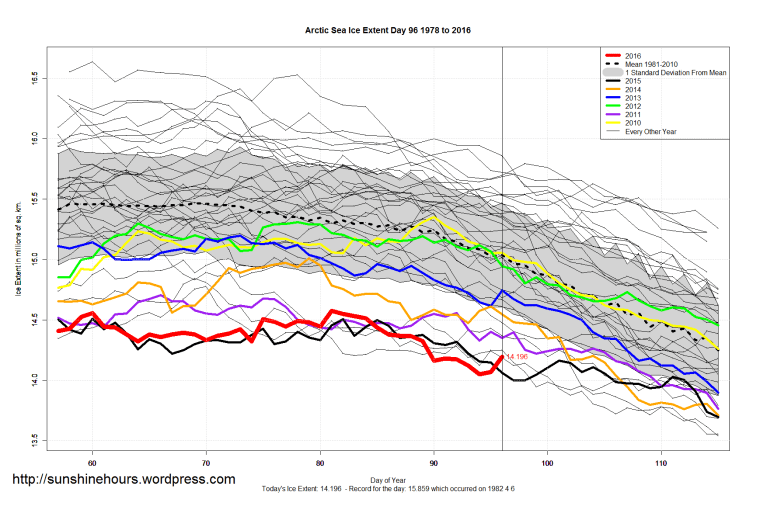
Another day… more strange jumps in the data. Today it is the Arctic. I have my doubts about a 1,000,000 sq km jump in one day.
This paper found evidence of a MWP in Antarctica during the period 1050AD to 1200AD .The glaciers had melted even more than they have now.
The LIA returned starting around 1350AD and continued until around 1700AD.
The MWP rate of glacial retreat was faster than the present. They think more snow fell in the present slowing the retreat.
Here, we present evidence for glacial retreat corresponding to the MWP and a subsequent LIA advance at Rothera Point (67°34′S; 68°07′W) in Marguerite Bay, western Antarctic Peninsula. Deglaciation started at ca. 961–800 cal. yr BP or before, reaching a position similar to or even more withdrawn than the current state, with the subsequent period of glacial advance commencing between 671 and 558 cal. yr BP and continuing at least until 490–317 cal. yr BP. Based on new radiocarbon dates, during the MWP, the rate of glacier retreat was 1.6 m yr−1, which is comparable with recently observed rates (~0.6 m yr−1between 1993 and 2011 and 1.4 m yr−1 between 2005 and 2011). Moreover, despite the recent air warming rate being higher, the glacial retreat rate during the MWP was similar to the present, suggesting that increased snow accumulation in recent decades may have counterbalanced the higher warming rate.
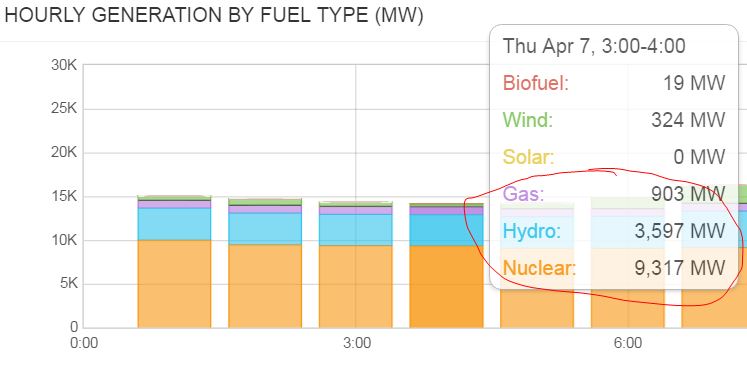
Lets say its April 7th 2016 3am or so in Ontario and there is about 15GW of demand.
Nuclear+Hydro+Gas keeps the lights and heat on.
Biofuel+Wind+Solar are just posturing. And they cost a fortune.
Global warming saves lives! Cold kills way more people than heat does.
Gradually rising temperatures across decades will increase the number of hot days and heat waves. If humans make no attempts whatsoever to adapt—a curious assumption that the report inexplicably relies on almost throughout—the total number of heat-related deaths will rise. But correspondingly, climate change will also reduce the number of cold days and cold spells. That will cut the total number of cold-related deaths.
Consider a rigorous study published last year in the journal Lancet that examined temperature-related mortality around the globe. The researchers looked at data on more than 74 million deaths in 384 locations across 13 areas: cold countries like Canada and Sweden, temperate nations like Spain, South Korea and Australia, and subtropical and tropical ones like Brazil and Thailand.
The Lancet researchers found that about 0.5%—half a percent—of all deaths are associated with heat, not only from acute problems like heat stroke, but also increased mortality from cardiac events and dehydration.
But more than 7% of deaths are related to cold—counting hypothermia, as well as increased blood pressure and risk of heart attack that results when the body restricts blood flow in response to frigid temperatures.
In the U.S. about 9,000 people die from heat each year but 144,000 die from cold.
A 2009 paper from the European Union expects that the reduction in cold deaths will definitely outweigh extra heat deaths in the 2020s. Even near the end of the century, in the 2080s, the EU study projects an increase in heat deaths of “between 60,000 and 165,000” and a decrease of cold deaths of “between 60,000 and 250,000.” In other words, the effects will probably balance each other out, but warming could save as many as 85,000 lives each year.
An academic paper published two years ago in Environmental Health Perspectives similarly shows that global warming will lead to a net reduction in deaths in both the U.K. and Australia. In England and Wales today, the authors write, statistics show that heat kills 1,500 people and cold kills 32,000. In the 2080s, they calculate that increased heat will kill an additional 3,500. But they find that cold deaths will drop by 10,000. In Australia the projections suggest 700 more heat deaths but 1,600 fewer cold deaths.
Globally, one estimate of the health effects of climate change, published in 2006 by Ecological Economics, shows 400,000 more respiratory deaths (mostly from heat) by midcentury, but 1.8 million fewer cardiovascular deaths (mostly from cold).
What a shocker. The climate cycles keep going up and down and so-called global warming” doesn’t change it
The study, published today in science journal Nature, found there was no difference between 20th-century rainfall patterns and those in the pre-industrial era. The findings are at odds with earlier studies suggesting climate change causes dry areas to become drier and wet areas to become wetter.
Fredrik Ljungqvist and colleagues at Stockholm University analysed previously published records of rain, drought, tree rings, marine sediment and ice cores, each spanning at least the past millennium across the northern hemisphere.
They found that the ninth to 11th and the 20th centuries were comparatively wet and the 12th to 19th centuries were drier, a finding that generally accords with earlier model simulations covering the years 850 to 2005.
However, their reconstruction “does not support the tendency in simulations of the 20th century for wet regions to get wetter and dry regions to get drier in a warmer climate”.
“Our reconstruction reveals that prominent seesaw patterns of alternating moisture regimes observed in instrumental data across the Mediterranean, western USA and China have operated consistently over the past 12 centuries,” the paper says.
http://www.thegwpf.com/climate-model-predictions-on-rain-and-drought-wrong-study-finds/
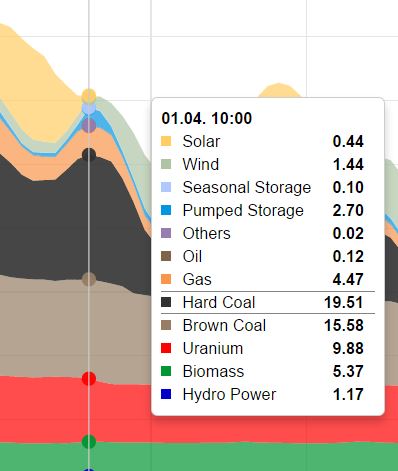
Germany is planning to rely on wind and solar. Last week on April 1st, wind and solar combined for 1.88GW out of 60GW.
Averages don’t keep the electricity on. They will need lots more brown coal when they shut down the nuclear power stations.
There are biomass power plants being built all over the world because the UN IPCC has promised that if you cut down a tree and burn it in a biomass power plant the CO2 doesn’t really count because someday a tree will be replanted and it will absorb CO2 for 50-100 years. A new report warns that cutting and burning trees to make electricity may not be that good for the environment after all.
I’ve delved into some of the claims myself and discovered multiple reports that show wood pellets can produce more CO2 than coal because of all the CO2 generated by the drying of the wood into pellets and then the transportation of the pellets.
The biomass industry relies on people confusing the terms green and renewable. Green (in my opinion) means low or zero CO2. Renewable means we won’t run out.
I argue that trees are really neither. Trees are not low CO2 unless you con people. And cutting down trees could be renewable. But isn’t necessarily so.
But the other big con the biomass industry (designed to counter the renewable argument) is that they are only to use dead trees or waste wood. Here is an example of a BC biomass plant:
Another major benefit of having the power plant up and running in Fort St. James is that it will create a home for much of the dead pine that is still sitting in local forests due to the mountain pine beetle epidemic that ravaged many of the forests in northern B.C.
“We’ve had increased harvesting of the forests but we’re going to see that drop off real soon,” says Emily Colombo, economic development officer for the Fort St. James District. “Because the dead wood standing in the forest loses merchantability year after year, it’s only good for harvesting and processing for a number of years. Even though there’s lots of dead wood in the forests, it’s no longer going to be desirable by the sawmill companies. So it’s great to have the Fort St. James green energy project starting up because it gives us a purpose for our waste wood. Until now it’s been burned in the bush… it’s just releasing carbon dioxide into the atmosphere.”
Guess what. They eventually run out of waste wood. And then they start cutting down healthy trees like this biomass plant in Nova Scotia.
About 2,790 hectares. That’s a rough estimate of how much woodland will need to be cut annually to feed Nova Scotia Power’s biomass boiler at Point Tupper.
“It seems that more of the fears are coming true than the benefits we had envisioned from that facility,” said Kari Easthouse, manager of the Cape Breton Private Land Partnership.
Foresters in northern Nova Scotia are warning that the wood being burned at Nova Scotia Power’s new biomass boiler may be green, but the electricity coming out of it isn’t.
The boiler, started by now-defunct NewPage Port Hawkesbury Corp. and sold to Nova Scotia Power, opened during the summer of 2013. Running at peak capacity, which it is a bit shy of now, it burns 670,000 green tonnes of wood fibre annually to produce 60 megawatts of electricity.
“They’re going after anything they can get their hands on to feed that thing,” Phil Clark, an Antigonish County sawmill operator, said Thursday.
“They’re laying places to waste to feed it.”
Nova Scotia Power has an obligation to its ratepayers to get wood fibre as cheaply as possible. The cheapest way is to clear land, not selectively harvest to improve the lot for the future.
Clear cutting forests … to burn for power and and produce lots of CO2.
Not green.
Not renewable.
UPDATE 2: They updated the data, at 3:22 down to 5.786 (which is a 300,000 sq km drop from the day before. Not likely.
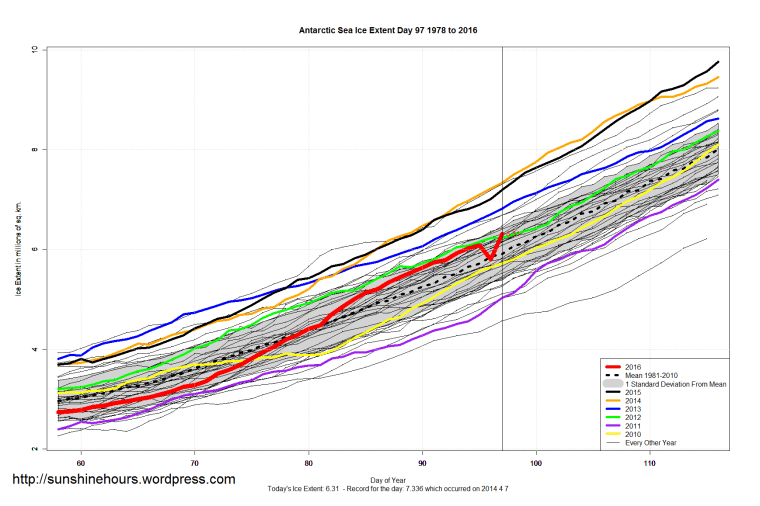
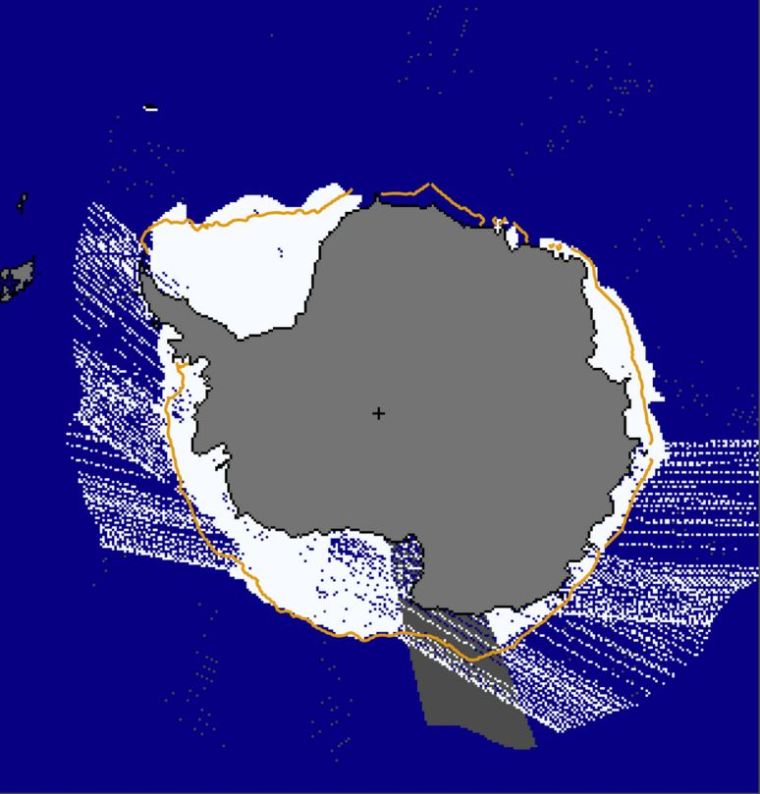
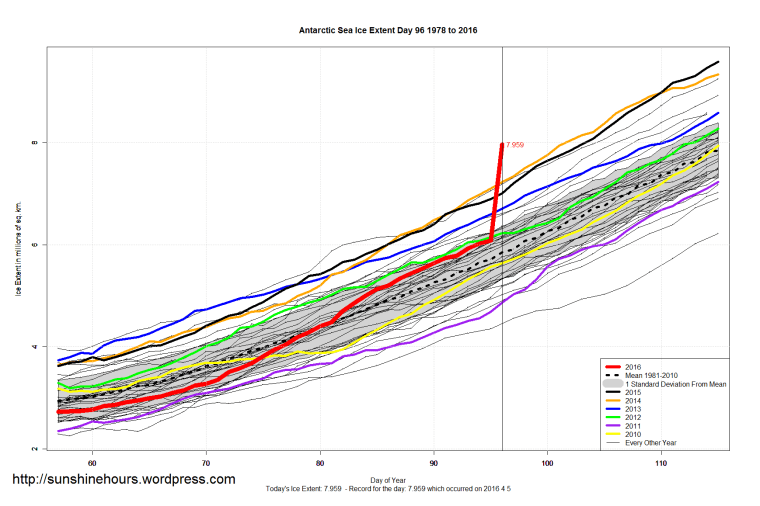
On day 96 the Antarctic sea ice extent took an unlikely jump from 6.082 million sq km to 7.959.
Sometimes they correct it the next day. Sometimes they don’t.
UPDATE: The “stuttering” in the daily Antarctic image. (Thanks AZ1971)
Ontario is importing “advanced biomass” wood pellets from Norway. See the post here is you are coming in late.
I was looking for total CO2 figures for the Atikokan plant. I haven’t found any yet. But I did find an OPG document showing CO2 production of 4 scenarios at Thunder Bay (which is also burning Norwegian Wood). One of those scenarios is a Natural Gas Combined Cycle power plant. It showed that plant producing a huge amount of CO2 compared to wood pellets. I know that isn’t true from this article.
Then I realized the the wood pellet CO2 numbers are based not on actual amount of CO2, but on the “net CO2” which is CO2 minus the fudge factor applied by the AGW cult to claims that since the trees are renewable most of the CO2 doesn’t really count. (page 10 and 11 here)
The key is where they use the term (net) as in “Green House Gas (GHG) Life Cycle Assessment (net)”
Anyway … back to comparing Ontario Wood Pellets to Norway Wood Pellets.
From this OPG document:
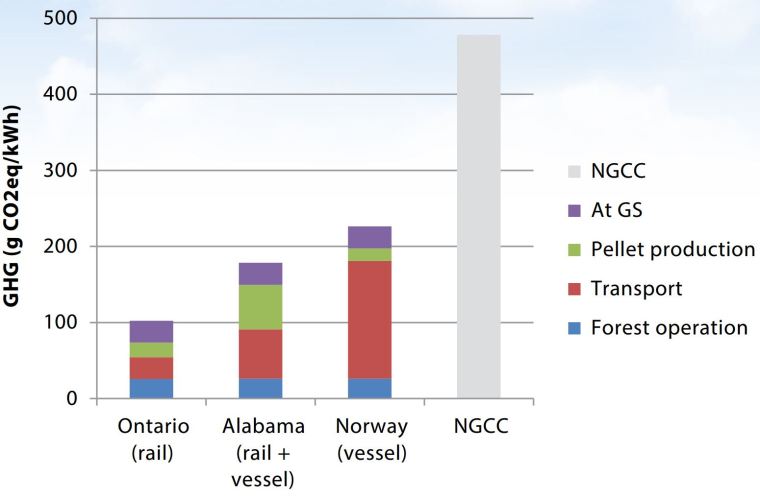
See all that CO2 produced by transporting all those pellets from Norway!