

I was quite sure NASA knew exactly what was going to happen. Don’t they model the climate? Don’t they use those models to ask for big grants. Now they are saying that literally anything could happen. Then what use are they?
‘If past events help predict future ones, then we have probably reached the peak of the 2015–2016 El Niño,’ the space agency said.
‘Warmer-than-average waters in the eastern tropical Pacific Ocean should start to cool off and shift westward.
‘By summer, the tropical Pacific might be back in a neutral state or La Niña cooling could kick in, as it did after major El Niños of the past.
‘But will the ocean respond in 2016 the way it did in 1998 and 1983? Given that the planet is hotter than at any time in the past 135 years, there are no guarantees.’
Now that the big snowfall is here and the AGW Cult is claiming warmer air causes more snow lets look at the Rutgers Snow Lab graph for average annual snowfall cover extent in North America.
Looks kind of steady for the last 35 years with a big blip around 78/79 which just happens to be the coldest winter in US history.
Every once in a while I visit the data for the Canada. Earlier today I looked at the station nearest me (NANAIMO A).
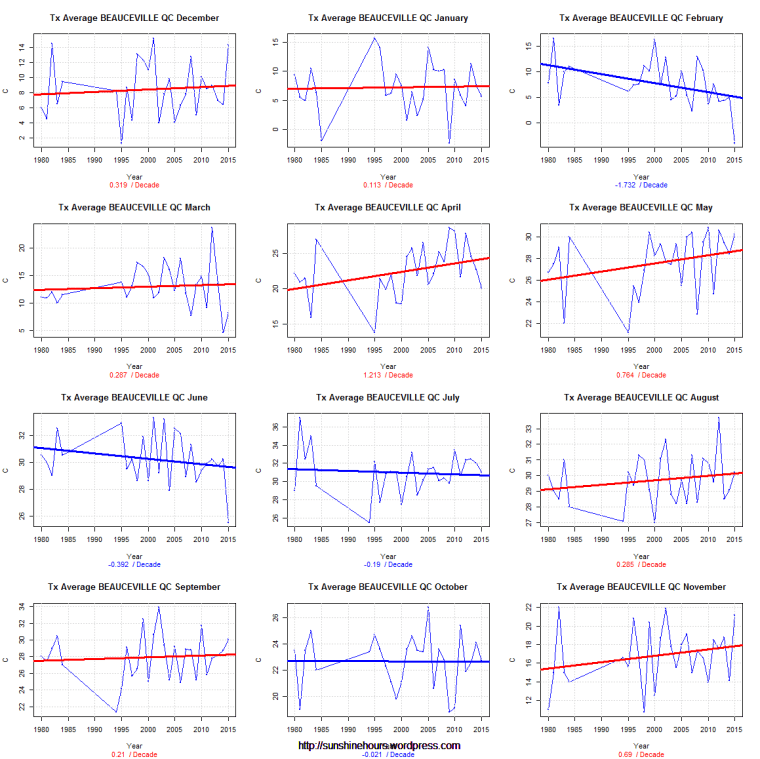
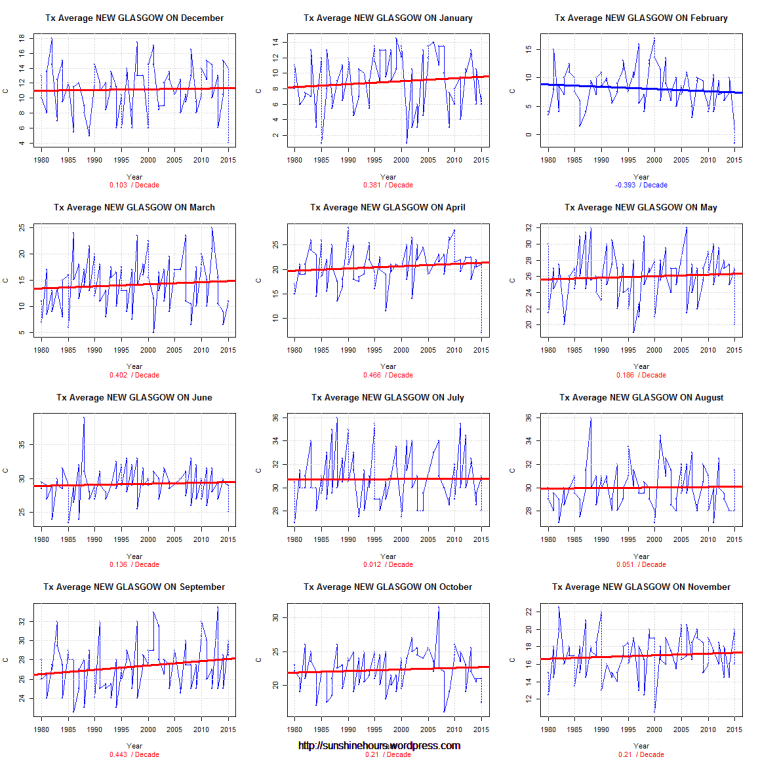
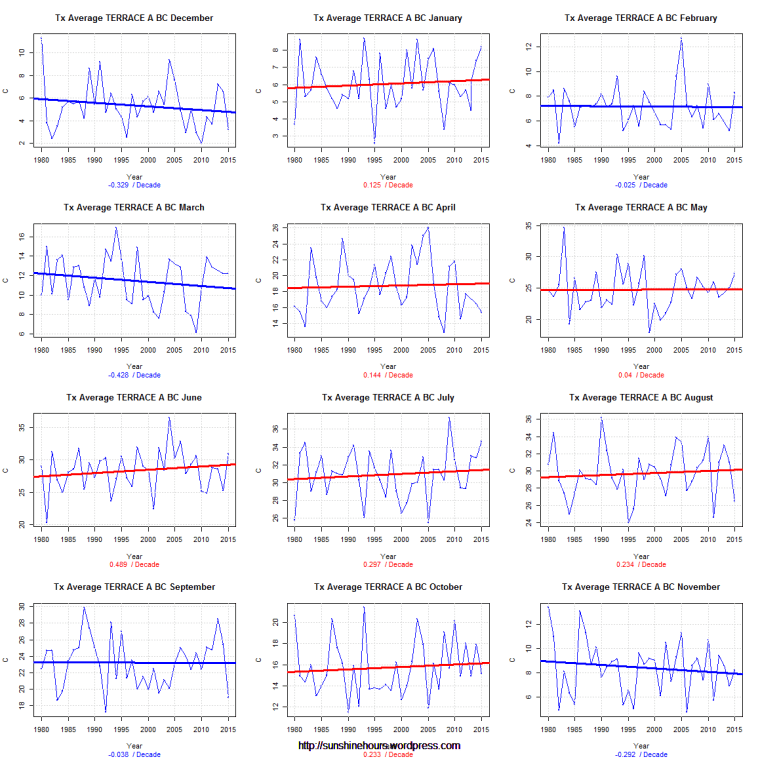
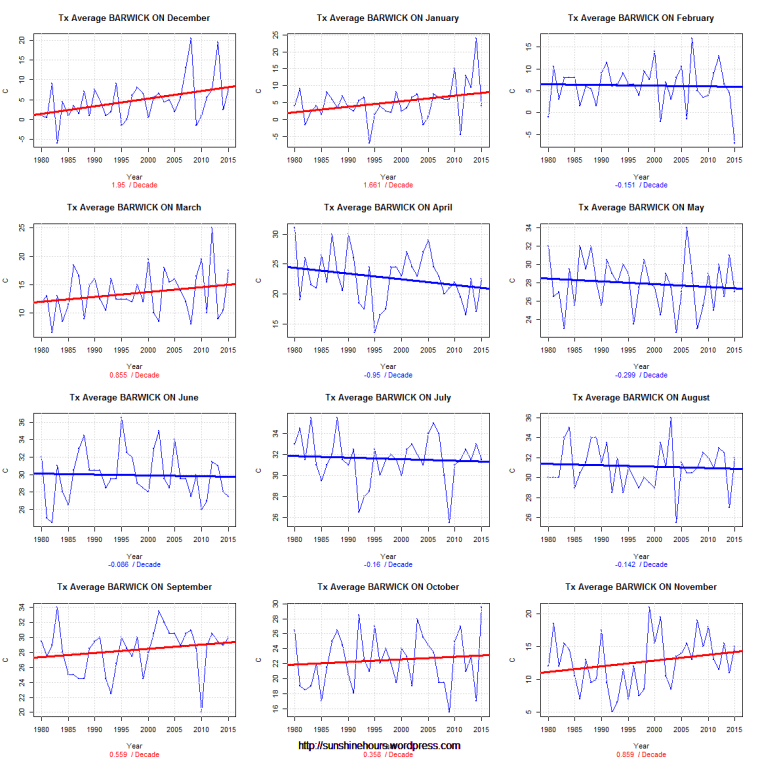
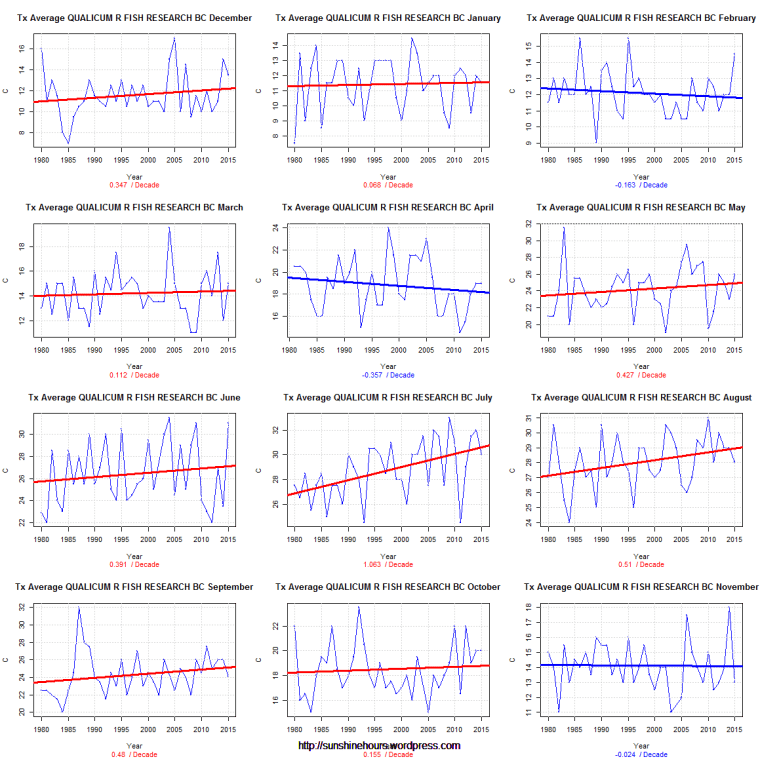
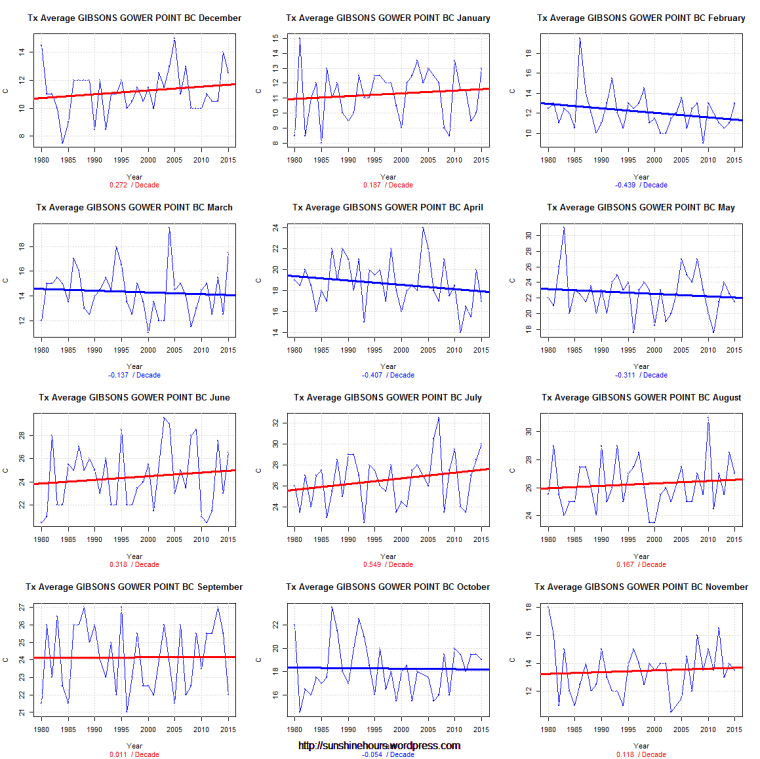
But since I have the code … I thought why not look at 10 random stations that have data in 1980 and 2015.
Today I am looking at TMAX monthly data (using Environment Canada monthly summaries) for 10 random stations from 1980.
Each line of graphs is a season – Dec/Jan/Feb …. etc.


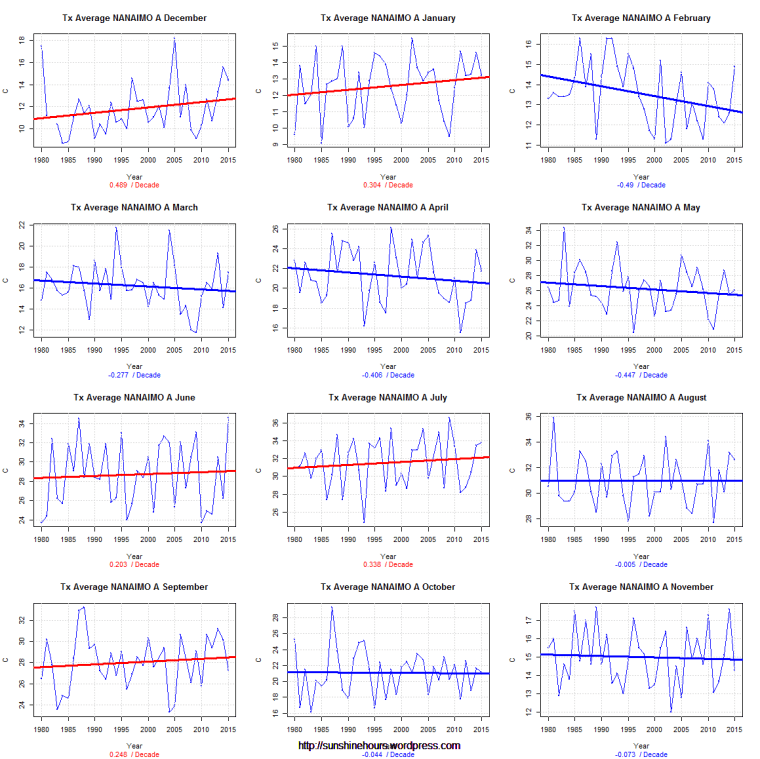
Every once in a while I visit the data for the weather station closest to my hometown on the west coast of Canada.
Today I am looking at TMAX monthly data (using Environment Canada monthly summaries) for NANAIMO A from 1980.
Each line of graphs is a season – Dec/Jan/Feb …. etc.
5 months are warming. 4 are cooling. 3 are cooling ever so slightly.
If there is a CO2 signal in there I am missing it.
CO2 is good.
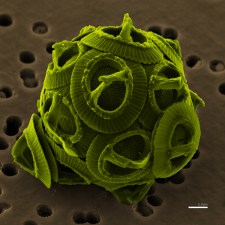
“Coccolithophores–tiny calcifying plants that are part of the foundation of the marine food web–have been increasing in relative abundance in the North Atlantic over the last 45 years, as carbon input into ocean waters has increased. Their relative abundance has increased 10 times, or by an order of magnitude, during this sampling period, report researchers.”
“We never expected to see the relative abundance of coccolithophores to increase 10 times in the North Atlantic over barely half a century. If anything, we expected that these sensitive calcifying algae would have decreased in the face of increasing ocean acidification (associated with increasing carbon dioxide entering the ocean from the burning of fossil-fuels). Instead, we see how these carbon-limited organisms appear to be using the extra carbon from CO2 to increase their relative abundance by an order of magnitude.”
http://www.sciencedaily.com/releases/2016/01/160116215419.htm