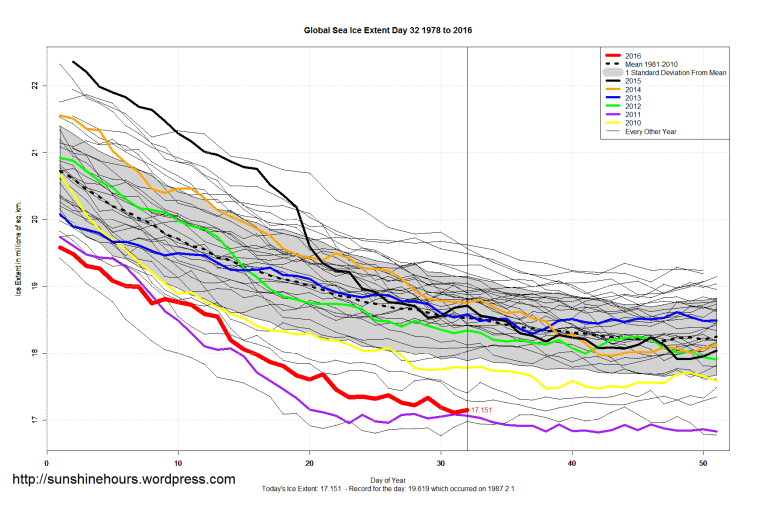
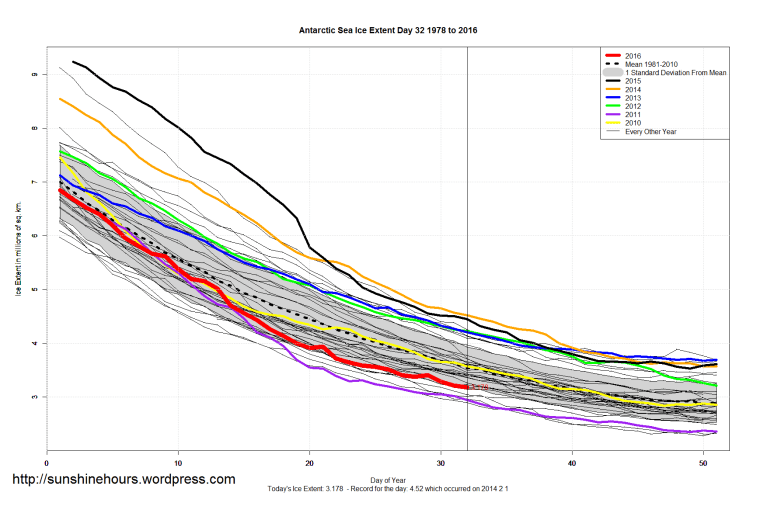
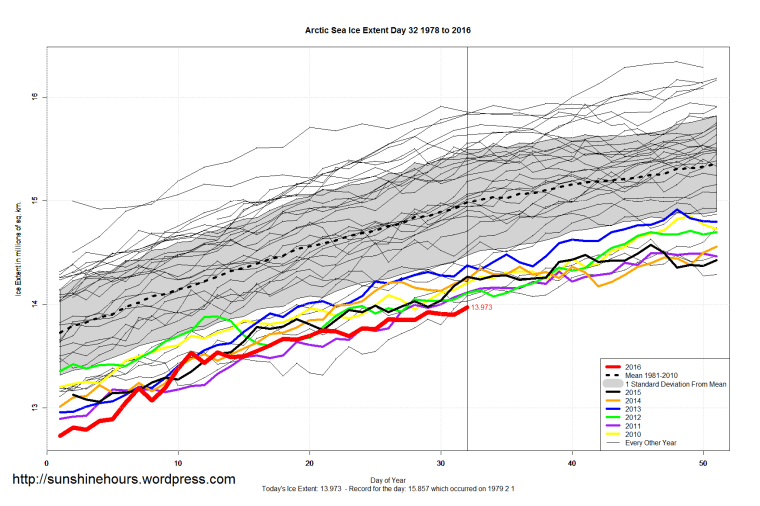
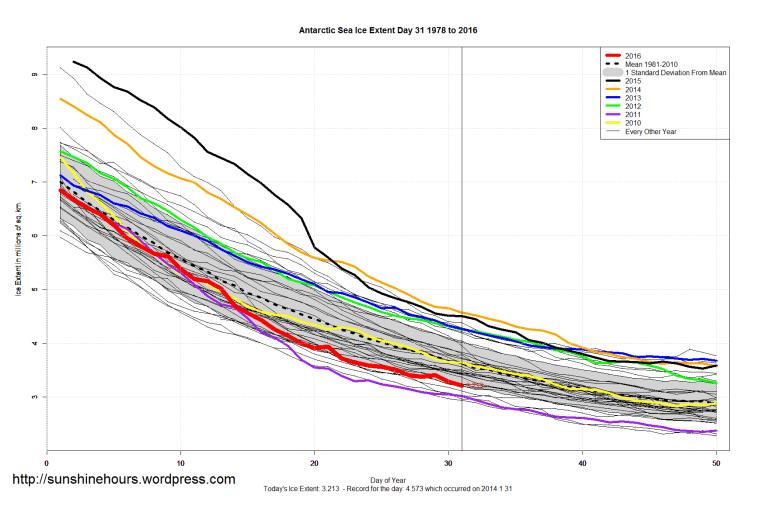
Sea Ice Extent (Global Antarctic and Arctic) – Day 31 – 2016


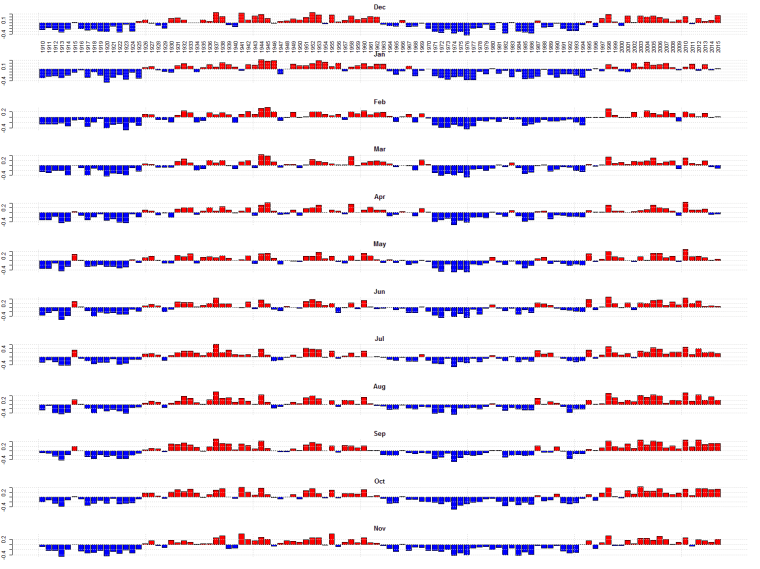
AMO as of Dec 2015
The AMO for each month as of Dec 2015. Some months the AMO is still high. Some it is low.
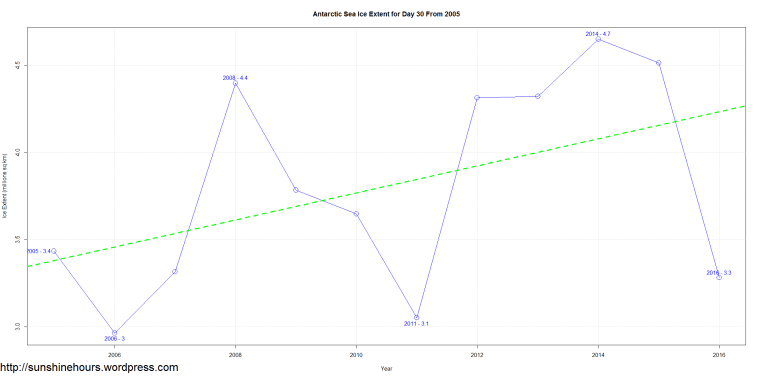
Sea Ice Extent (Global Antarctic and Arctic) – Day 30 – 2016
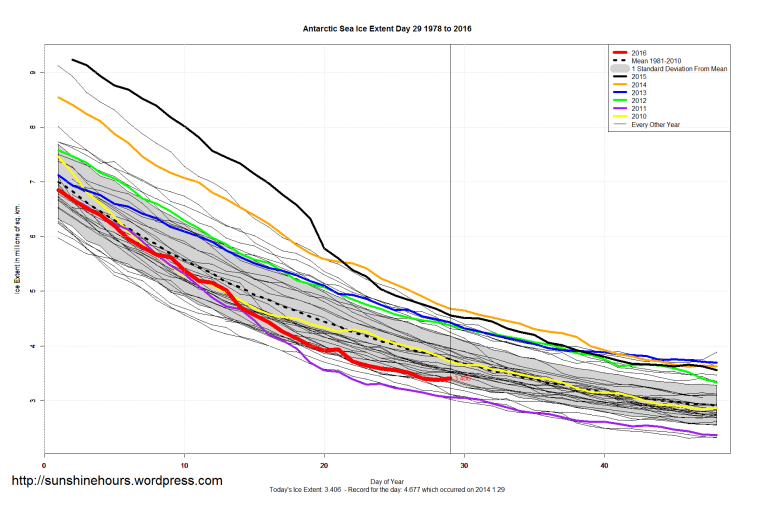
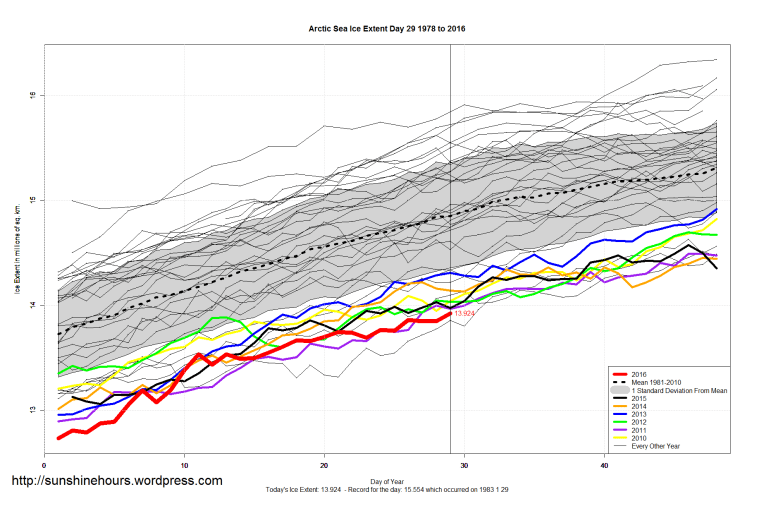
Sea Ice Extent (Global Antarctic and Arctic) – Day 29 – 2016

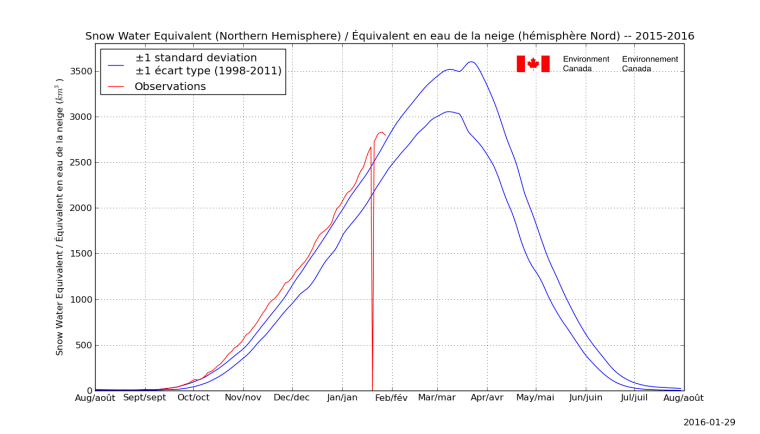
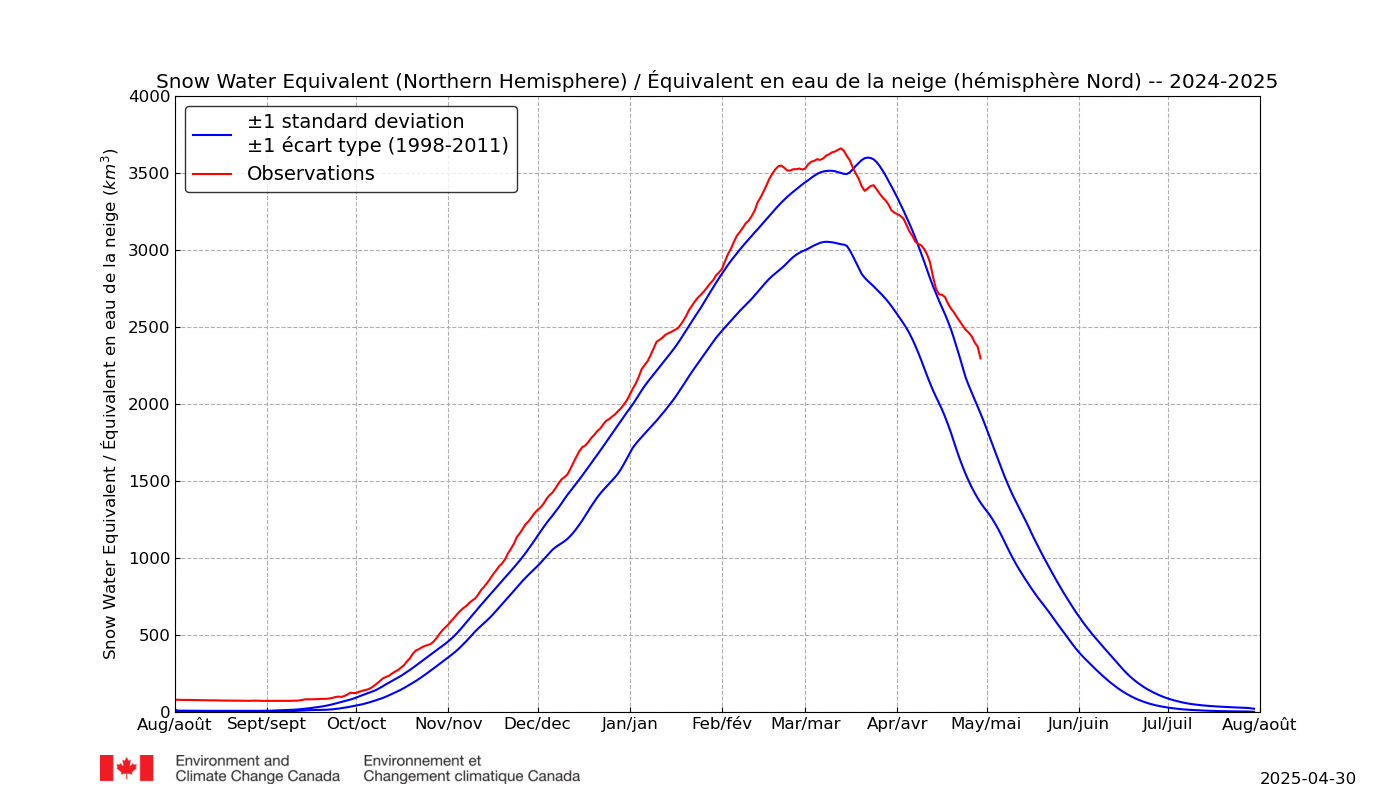
Northern Hemisphere Snow Water Equivalent Above Normal All Year … except
Northern Hemisphere Snow Water Equivalent above normal all year … except for the day all the snow melted (and then came back).
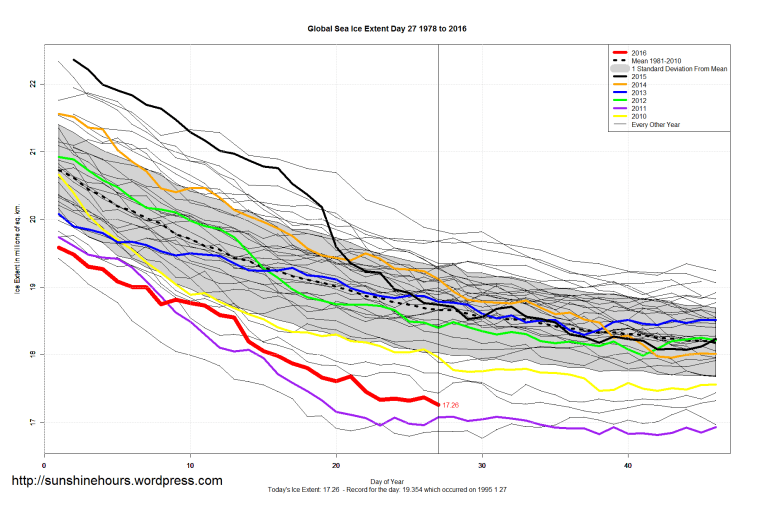
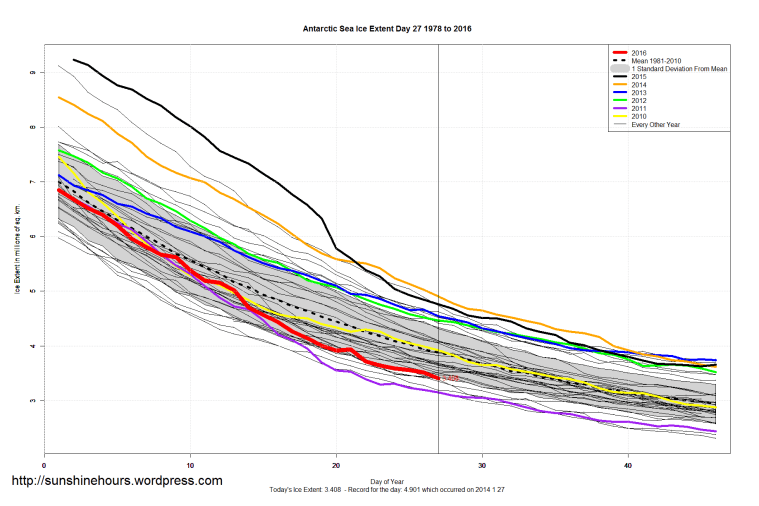
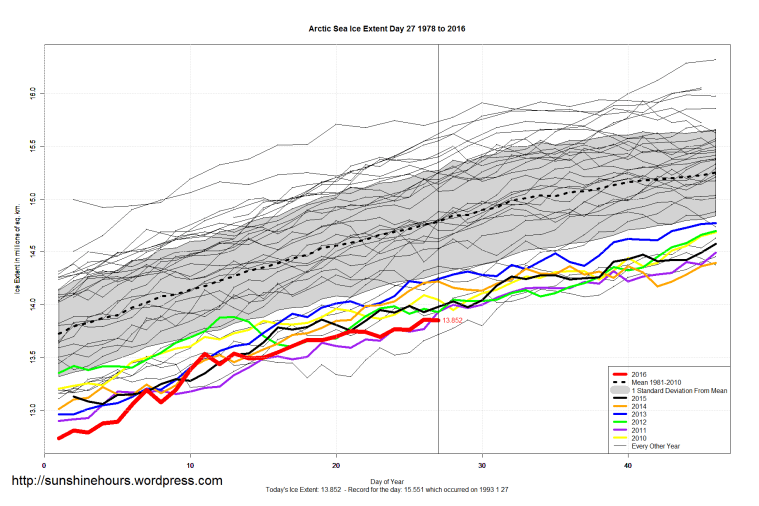
Sea Ice Extent (Global Antarctic and Arctic) – Day 27 – 2016
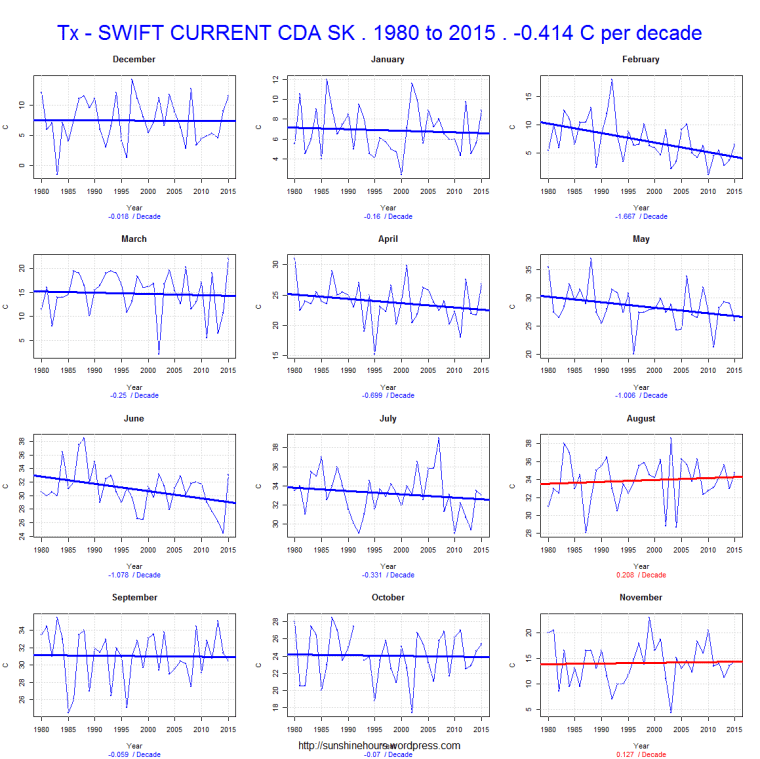
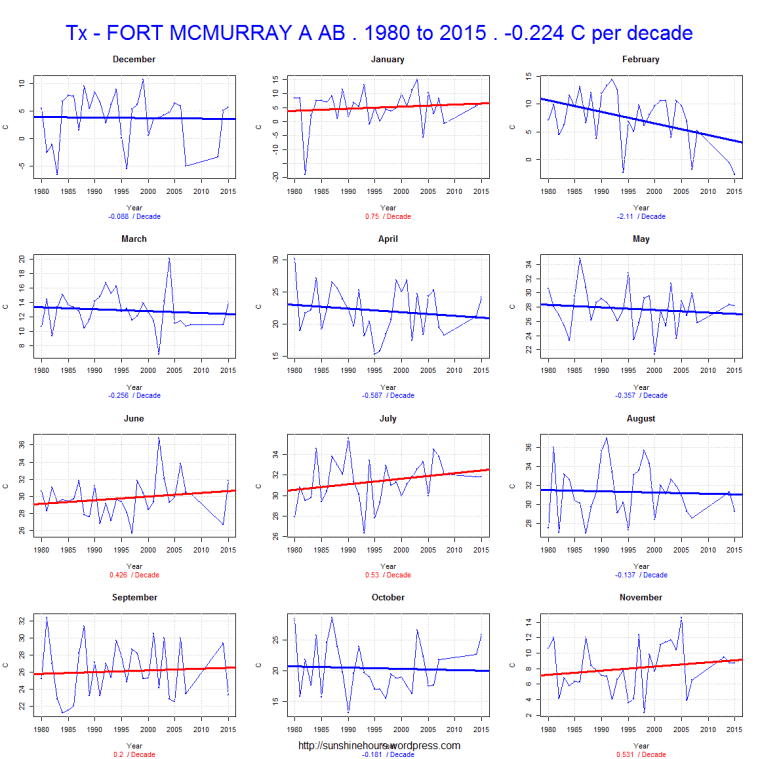
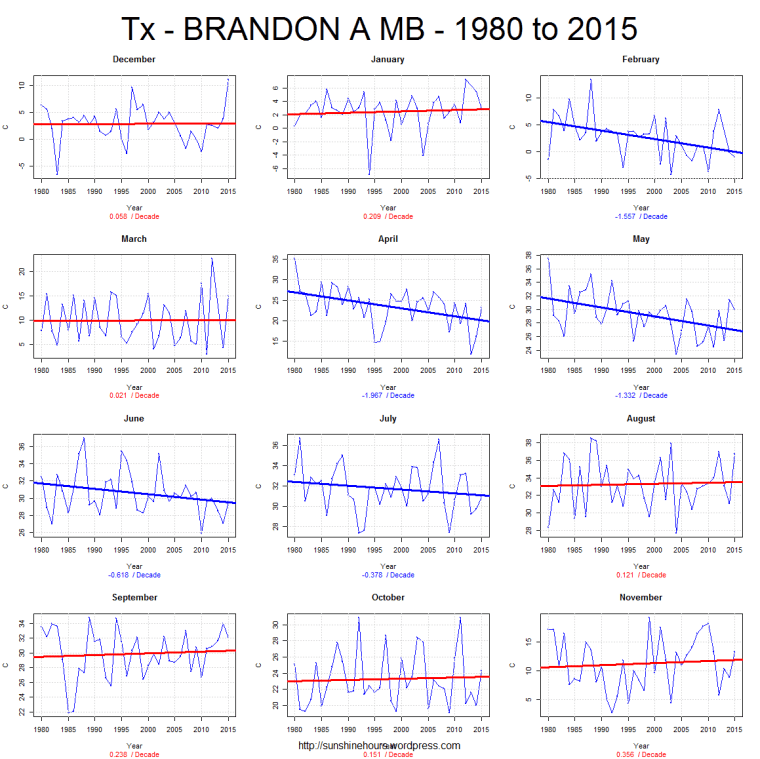
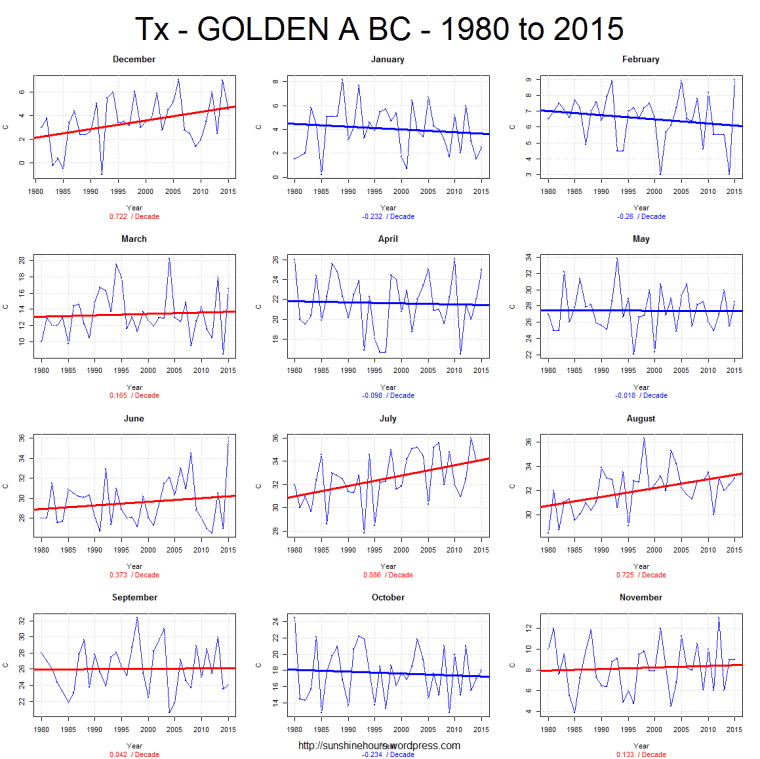
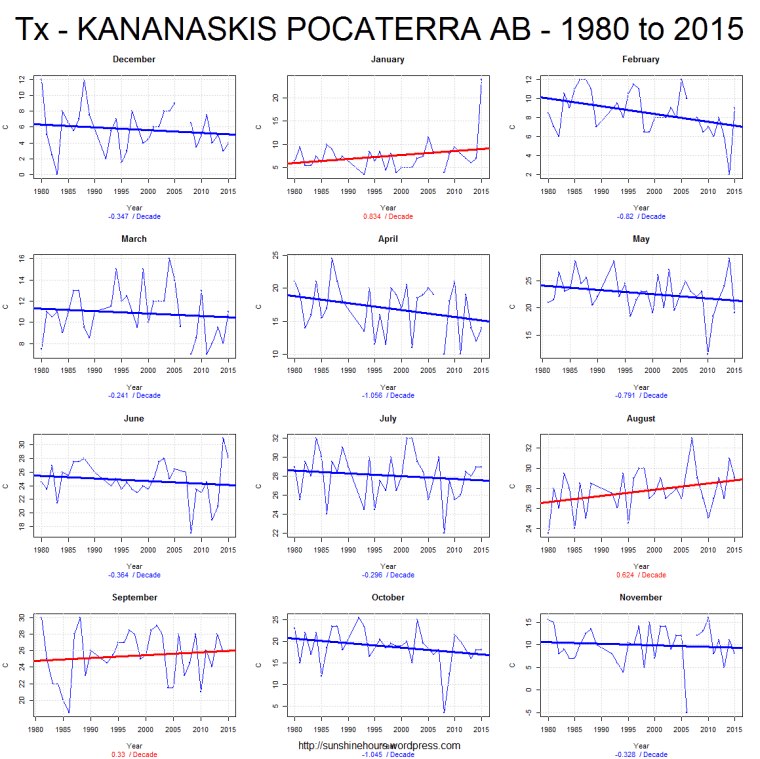
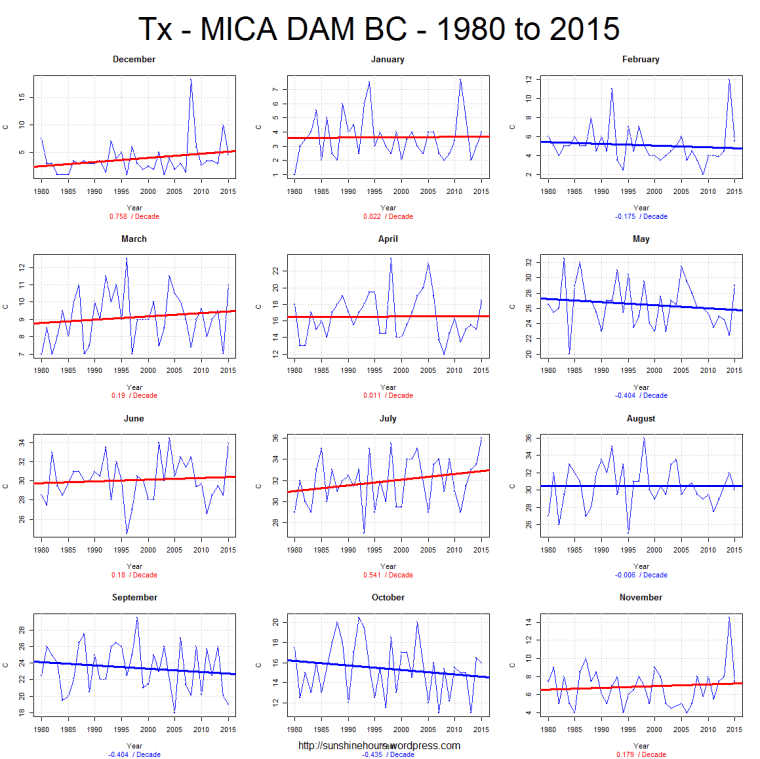
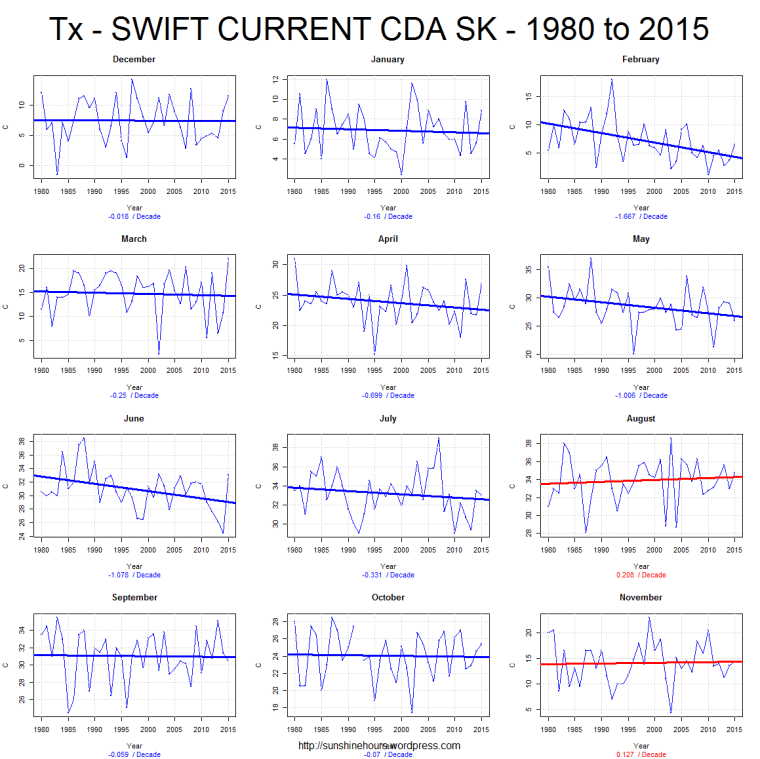
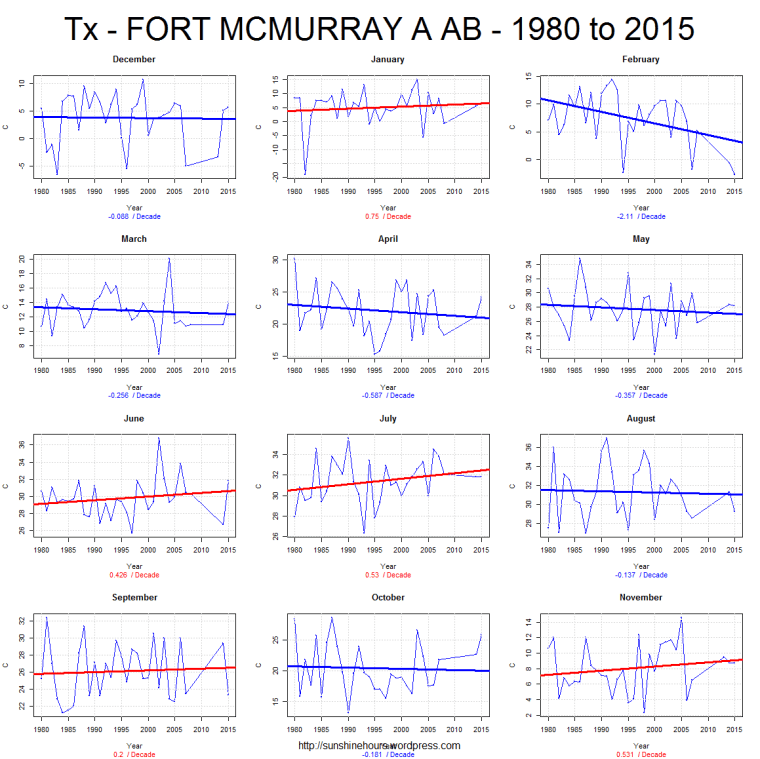
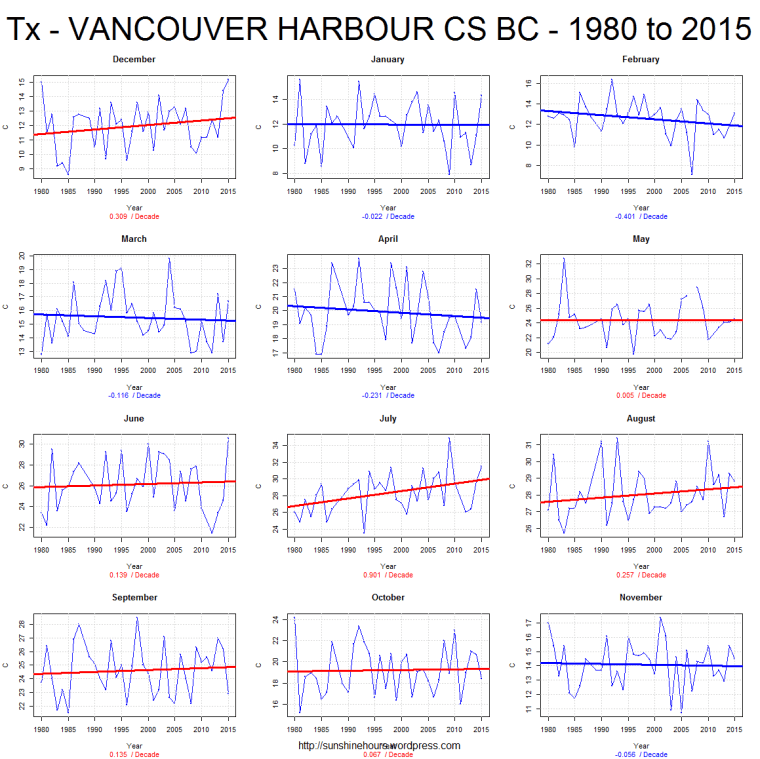
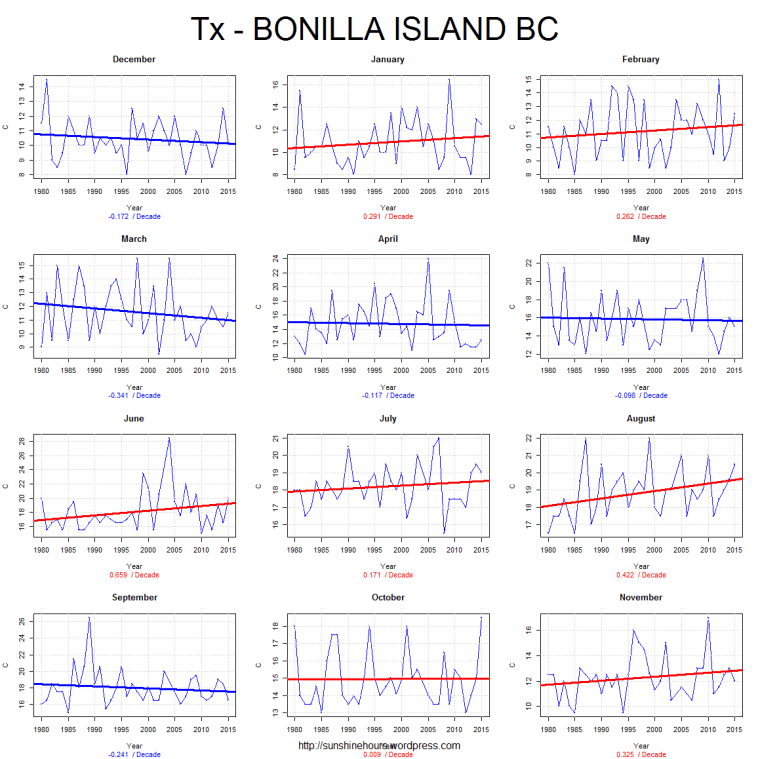
10 MORE Random Canadian Tmax from 1980
A few days I published 10 more randomly chosen graphs of TMAX using Environment Canada’s monthly summaries.
I was fiddling with the graphing code to add the overall rate of temp change and color the title – red for warming and blue for cooling.
I took a closer look at 3 stations (2 are airports).
Tmax temperatures falling at -.414C /dec, -.224/dec and -.246/dec
April Tmax in Brandon have fallen 7C in 35 years.

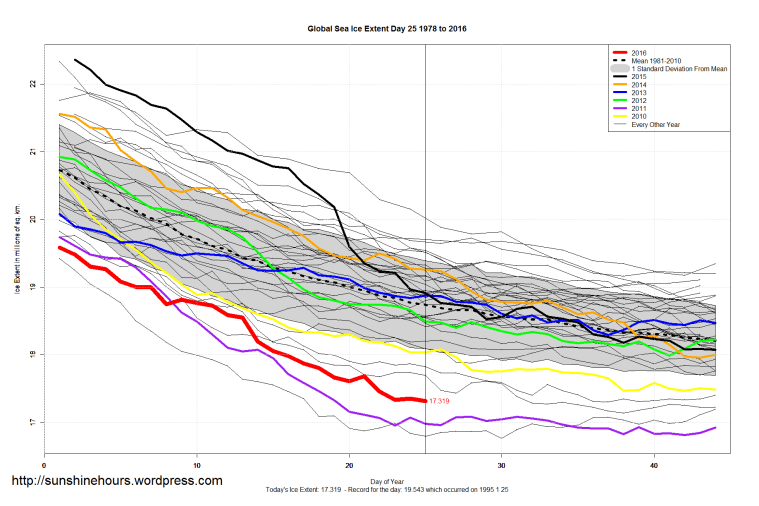
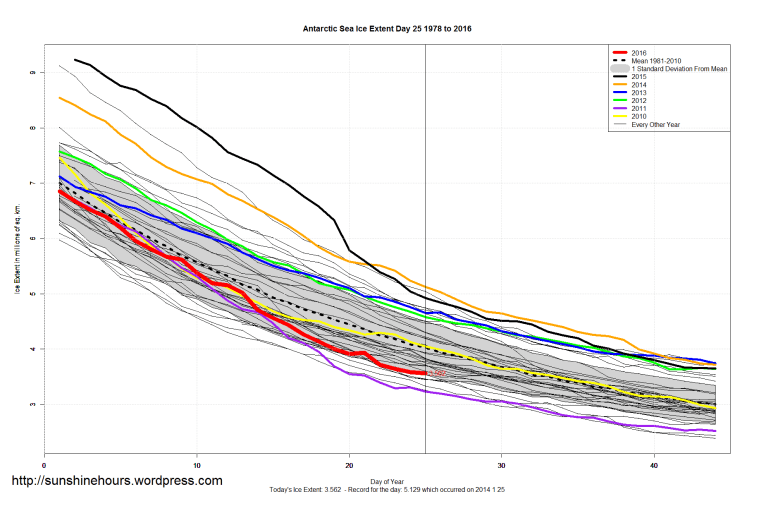
Sea Ice Extent (Global Antarctic and Arctic) – Day 25 – 2016

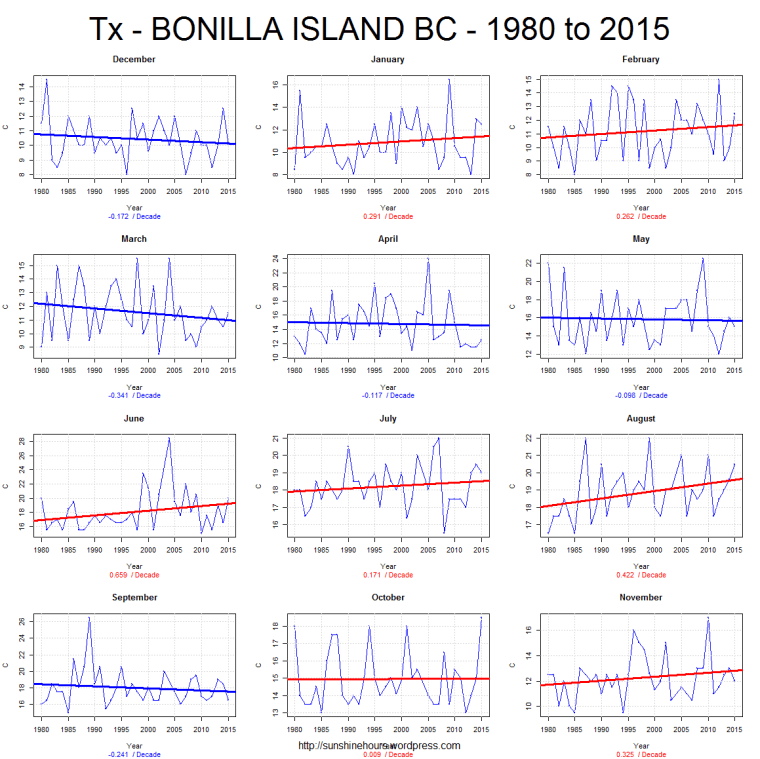
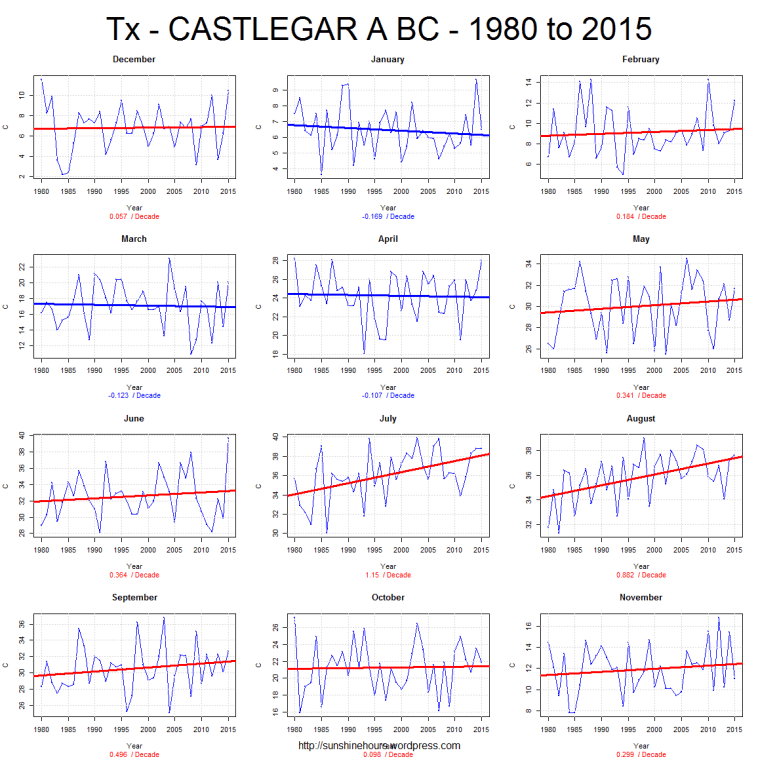
10 MORE Random Canadian Tmax from 1980
A few days I published 10 randomly chosen graphs of TMAX using Environment Canada’s monthly summaries.
I picked 1980 to 2015 partly to create a round number and partly because that is sort of when AGW became noticeable.
I picked TMAX because I think TMIN’s are rising because of UHI.
The red lines indicate a warming trend. The blue a cooling trend.
Anyone see evidence of CO2 making it warm?
Here are 10 more.
