10 MORE Random Canadian Tmax from 1980

A few days I published 10 randomly chosen graphs of TMAX using Environment Canada’s monthly summaries.

I picked 1980 to 2015 partly to create a round number and partly because that is sort of when AGW became noticeable.

I picked TMAX because I think TMIN’s are rising because of UHI.

The red lines indicate a warming trend. The blue a cooling trend.

Anyone see evidence of CO2 making it warm?

Here are 10 more.

Tx - BONILLA ISLAND BC - 1980 to 2015

Tx - CASTLEGAR A BC - 1980 to 2015

Tx - BRANDON A MB - 1980 to 2015

Tx - GOLDEN A BC - 1980 to 2015

Tx - KANANASKIS POCATERRA AB - 1980 to 2015

Tx - MICA DAM BC - 1980 to 2015

Tx - SWIFT CURRENT CDA SK - 1980 to 2015

Tx - FORT MCMURRAY A AB - 1980 to 2015

Tx - VANCOUVER HARBOUR CS BC - 1980 to 2015

Tx - BONILLA ISLAND BC

10 Random Canadian Tmax from 1980

Every once in a while I visit the data for the Canada. Earlier today I looked at the station nearest me (NANAIMO A).

But since I have the code … I thought why not look at 10 random stations that have data in 1980 and 2015.

Today I am looking at TMAX monthly data (using Environment Canada monthly summaries) for 10 random stations from 1980.

Each line of graphs is a season  – Dec/Jan/Feb …. etc.


Tx Average BEAUCEVILLE QC


Tx Average NEW GLASGOW ON


Tx Average TERRACE A BC


Tx Average WHITECOURT A AB


Tx Average AROOSTOOK NB


Tx Average BARWICK ON


Tx Average MIDLAND WATER POLLUTION CONTROL PLANT ON


Tx Average QUALICUM R FISH RESEARCH BC


Tx Average UCLUELET KENNEDY CAMP BC


Tx Average GIBSONS GOWER POINT BC


Nanaimo Tmax from 1980

Every once in a while I visit the data for the weather station closest to my hometown on the west coast of Canada.

Today I am looking at TMAX monthly data (using Environment Canada monthly summaries) for NANAIMO A from 1980.

Each line of graphs is a season  – Dec/Jan/Feb …. etc.

5 months are warming. 4 are cooling. 3 are cooling ever so slightly.

If there is a CO2 signal in there I am missing it.

Tx Average NANAIMO A


Thermometertree: A magic tree selected out of a forest

The big magic tree con continues. Take millions of trees and select a few that sort of match the temperature records and claim trees are magic thermometers. Never publish the data of the rejected trees. Collect grant money.


“So instead of a validation of the robustness of the data, or the robustness of the field, what we have is is a paper demonstrating the robust willingness of climate scientists to sell trickery as science for both money and for the cause. These authors should be ashamed but even when caught truncating series, they simply push on producing ever more garbage for the small brained sheep in the media, politics and the public to use as propaganda for the government agenda.”

Capture


https://noconsensus.wordpress.com/2016/01/16/nearly-two-teams-of-hockey-sticks-used-in-massive-wilson-super-reconstruction/


Nanaimo BC Temperature Range

I live near Nanaimo BC (data from 1947 at “NANAIMO A”). I was curious what the temperature range for any given day would be.

By temperature range I mean find the warmest it has ever been for a particular day and then subtract the coldest it has ever been.

December 1st , February 4th, November 14th and May 16 have the biggest range = 32.8C.

November 18th has the lowest range = 16.9C. (I find it interesting it has never been colder than -4.4C on November 18 when it has been -16.1C on November 14th.

(Remember this when someone says humans and animals will notice a 1C change in the next 100 years).

Top 10 and bottom 10 below.

Biggest Difference:

Month Day Min Max Difference
12 1 -18.9 13.9 32.8
2 4 -16.7 16.1 32.8
11 14 -16.1 16.7 32.8
5 16 -4.4 28.4 32.8
6 17 0.6 33.3 32.7
5 29 1.7 34.3 32.6
5 12 0 32.4 32.4
5 28 0.6 33 32.4
5 14 -0.6 31.7 32.3
12 24 -13.9 18.2 32.1

Lowest Difference:

Month Day Min Max Diffference
11 18 -4.1 12.8 16.9
3 15 -3.3 14.5 17.8
12 5 -7.1 12.1 19.2
11 10 -4.4 14.9 19.3
12 11 -6.1 13.5 19.6
12 3 -5.9 14 19.9
12 12 -6.3 13.9 20.2
2 23 -5.6 14.6 20.2
3 14 -3.9 16.6 20.5
3 17 -5 15.7 20.7

Once Upon A Time They Blamed Termites

Once Upon A Time They Blamed Termites. Maybe they were right.

TERMITE GAS EXCEEDS SMOKESTACK POLLUTION

By WALTER SULLIVAN
Published: October 31, 1982

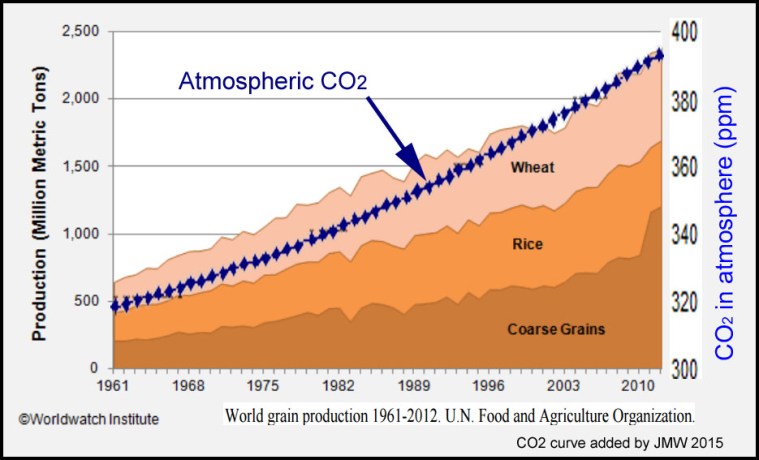
For several years scientists have been warning that carbon dioxide added to the atmosphere by increased burning of fuel is likely to alter world climates, like a greenhouse, by inhibiting the escape of heat into outer space.

Now researchers report that termites, digesting vegetable matter on a global basis, produce more than twice as much carbon dioxide as all the world’s smokestacks.

Termite gas production has become particularly high, the researchers say, because widespread clearing of land has offered them abundant food in the debris of felled forests. By digesting this debris, they are adding not only carbon dioxide but also methane to the atmosphere. Other researchers have found that methane in the atmosphere is increasing 2 percent a year.

The high level of termite gas production is reported in the Nov. 5 issue of the journal Science. The authors measured termite gas production inside laboratory jars. In Guatemala forests, they enclosed a huge arboreal termite nest in a Teflon bag to confirm that the insects were prolific producers of methane.

As pointed out Wednesday by one of the researchers, James P. Greenberg of the National Center for Atmospheric Research in Boulder, Colo., termites are far more abundant than most people realize. He estimated that there were three quarters of a ton of termites for every person on earth.

Another author of the report, Patrick R. Zimmerman of the atmospheric center in Boulder, said that plant respiration and decay added 10 to 15 times as much carbon dioxide to the air as termites. While the contribution of fuel burning is even less, it is superimposed on what, until recently, had been a balanced cycle of gas production and absorption by plants, the seas and other reservoirs.

The findings concerning carbon dioxide and methane production by termites do not offer much comfort regarding the long-term trend in atmospheric gases. The output from insects does not appear likely to increase greatly, while combustion of fuel is rising steadily as developing nations industrialize.

Other authors of the Science article were Dr. Paul J. Crutzen, director of the Max Planck Institute for Atmospheric Chemistry in Mainz, West Germany, and S.O. Wandiga of the University of Nairobi in Kenya.

The steady rise in methane was reported by Dr. Reinhold A. Rasmussen and Dr. M. Aslam Khan Khalil of the Oregon Graduate Center last year. They said human activity was also releasing increasing amounts of other gases that threatened climate, including carbon dioxide and fluorocarbons, which are used in refrigeration.

The possible significance of increased methane in the atmosphere touched off a debate in 1971 on whether supersonic transports might alter the stratosphere. Dr. S. Fred Singer, then at the University of Maryland, suggested that other human activities, including intensive cattle-fattening, were more important. He cited an estimate that bovine flatulence added 85 million tons of methane to the atmosphere each year. The new estimate for termites is 150 tons.”

http://www.nytimes.com/1982/10/31/us/termite-gas-exceeds-smokestack-pollution.html


Global Warming Zealots are to blame for the Deadly Diesel Fiasco

The Diesel Fiasco and the AGW Cult:

Amid all the reporting of Volkswagen’s rigging of emission tests on its diesel cars, one inconvenient truth has been overlooked by the BBC and many media organisations. It is that we very largely owe the prevalence of these death-traps to the pernicious tyranny of the Green lobby.

That they are death traps can scarcely be denied. They spew out vastly more nitrogen oxide and nitrogen dioxide than petrol cars, both of which gases are potentially damaging, and 22 times more particulates — the minute particles that penetrate lungs, brains and hearts.

According to Martin Williams, professor of air quality research at King’s College London, diesel cars account for roughly 5,800 premature deaths a year in the UK alone. Other experts put the figure even higher.


Twenty years ago, diesel cars constituted a tiny minority. But following the signing of the Kyoto Protocol in 1997, most Western countries, including Britain, were legally obliged to reduce carbon dioxide emissions — alleged by some to cause climate change — by 8 per cent over the following 15 years.

Diesel cars produce slightly less — but only slightly — carbon dioxide than petrol ones. In 2001 the Labour government introduced a new tax regime whereby cars were taxed according to how much carbon dioxide they produce, a development that enormously favoured diesel over petrol. (Duty at the pump has been the same for petrol and diesel since 2000.)

Gordon Brown, then Chancellor, also introduced tax incentives to encourage company car buyers to plump for diesels. Across the EU, car manufacturers were encouraged to develop diesel models.

As a consequence, about half of new cars in Britain are now diesels. In some European countries such as France and Italy, where there have been similar inducements, the proportion is even higher.

When recently buying a new car, I was attracted to a diesel partly because its annual tax was only £40, in comparison to £150 for the petrol version, otherwise identical. Happily, my wife, who had read about the polluting effects of diesels, overruled me. Even I had been almost gulled by Green lobbyists and the blandishments of politicians into doing something that I would have regretted.

You may say ministers didn’t realise that diesels discharge dangerous emissions — but you would be wrong. A 1993 report published by the Department of the Environment was fully aware of the potentially lethal effects of diesel cars.

http://www.dailymail.co.uk/columnists/article-3246885/It-s-inconvenient-truth-global-warming-zealots-blame-deadly-diesel-fiasco-writes-STEPHEN-GLOVER.html


So Much for the Methane Bomb

It appears that there is no danger from methane in the arctic.

[N]ew research led by Princeton University researchers and published inThe ISME Journal in August suggests that, thanks to methane-hungry bacteria, the majority of Arctic soil might actually be able to absorb methane from the atmosphere rather than release it. Furthermore, that ability seems to become greater as temperatures rise.

http://bishophill.squarespace.com/blog/2015/8/18/defusing-the-methane-bomb.html