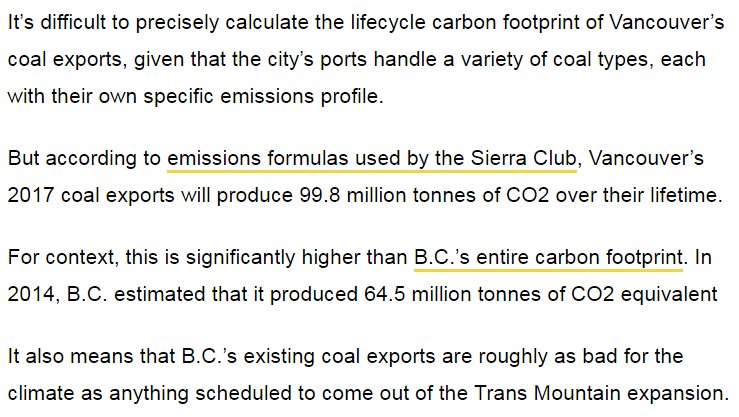
Yes, anti-pipeline Vancouver really is North America’s largest exporter of coal
The EPA in the USA has followed the EU in declaring wood pellets burning to be carbon neutral.
Even DesmogBlog is throwing a hissy fit.
Me … I’m sad and I’m also laughing. For years the greens have deliberately confused people and tried to make it seem like green = renewable.
They used terms like biomass and biofuel etc etc. And made it seem like it was green and way better than coal.
Burning wood for electric power may be renewable but it isn’t green. It produces 2x the CO2 as natural gas and more than coal in many cirumstances.
I live in British Columbia … a place with lots of trees and a carbon tax. But guess what, our public power utility subsidizes the burning of trees for power.
A couple of miles from me is a pulp mill. They built a 55MW power plant burning wood waste and BC Hydro buys power from them at subsidized rates.
Here’s an article on one of the small projects replacing diesel with wood waste gasification. This is the sad sad paragraph:
That adds up to greenhouse gas reductions of about 400 tonnes a year, and is in-line with BC Hydro’s ongoing efforts to help remote B.C. communities – too far away from the electricity system to be serviced by the 98% clean energy generated by BC Hydro – reduce their fossil fuel emissions.
Its sad because they can only claim GHG reductions if they lie and claim wood is “carbon neutral” and produces no net CO2.
800MW of power from burning wood etc (Ignore the waste heat stations) Here is a list.
Here is a sample:
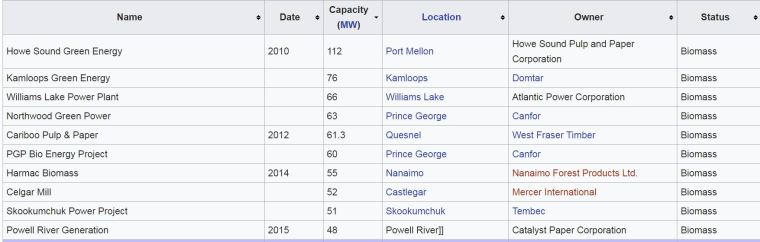
800MW!!!!
Huge amounts of CO2 and particulate matter.
If BC shut those down, we could skip the carbon tax!
The province of BC is touted as carbon tax success story. If you google “carbon tax success” BC always shows up.
Just ask the NY Times:

And of course that would mean less gasoline used .. right?
Gross sales of gasoline (1,000 liters)
 2012 4,682,115
 2013 4,504,633
 2014 4,687,564
 2015 5,481,062
 2016 5,770,067
23% more gasoline used in BC from 2012.
And CO2 emitted climbed from 2010 to 2015 (last year available)
Its just a tax grab.
I feel sad for British Columbia (my home province). When I was growing up getting a job on megaproject was great thing to do.
Now British Columbians are relying on a superheated real estate market for ‘wealth’ as energy projects are getting cancelled.
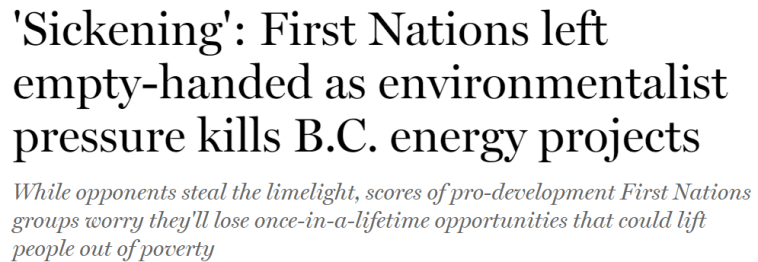
First Nation are losing out too.
“Opponents of energy projects may get attention and results by organizing protests, launching lawsuits, discrediting regulators and influencing governments, but Ross said scores of pro-energy development First Nations groups are worried about losing once-in-a-lifetime opportunities.
Those groups have signed benefits agreements involving cash, jobs and business prospects with projects such as Pacific NorthWest LNG, Trans Mountain’s pipeline expansion, Eagle Spirit Energy Holdings Ltd.’s upgraded oil pipeline, as well as others that have been spiked or delayed by various governments.”
New posts below this one.
I Pledge To NEVER Vote For A Party That Supports A Carbon Tax.
The next provincial general election in British Columbia is scheduled for May 9, 2017
Yes the NDP will probably screw the poor and retired and middle class more than the Liberals.
But I won’t vote Liberal as long as the carbon tax exists.
If there is no party that is against the carbon tax, I won’t vote.
Tree rings are magical. Not only can you reconstruct temperatures from the past, but you can reconstruct droughts (rainfall).
Whenever I see the word “novel approach” I worry we are in for BS.
However, since the authors of this paper are saying things were worse in the past than present I like to pretend I believe them.
They also sort of say that more dendrohydrologists are needed. Surprise.
Recent streamflow droughts in south coastal British Columbia have had major socioeconomic and ecological impacts. Increasing drought severity under projected climate change poses serious water management challenges, particularly in the small coastal watersheds that serve as primary water sources for most communities in the region. A 332-year dendrohydrological record of regionalized mean summer streamflow for four watersheds is analyzed to place recent drought magnitudes in a long-term perspective.
We present a novel approach for optimizing tree-ring based reconstructions in small watersheds in temperate environments, combining winter snow depth and summer drought sensitive proxies as model predictors. The reconstruction model, estimated by regression of observed flows on Tsuga mertensiana ring-width variables and a tree-ring derived paleorecord of the Palmer Drought Severity Index, explains 64% of the regionalized streamflow variance.
The model is particularly accurate at estimating lowest flow events, and provides the strongest annually resolved paleohydrological record in British Columbia. The extended record suggests that since 1658 sixteen natural droughts have occurred that were more extreme than any within the instrumental period. Flow-duration curves show more severe worst-case scenario droughts and a higher probability of those droughts in the long-term reconstruction than in the hydrometric data.
Such curves also highlight the value of dendrohydrology for probabilistic drought assessment. Our results suggest current water management strategies based on worst-case scenarios from historical gauge data likely underestimate the potential magnitudes of natural droughts. If the low-flow magnitudes anticipated under climate change co-occur with lowest possible natural flows, streamflow drought severities in small watersheds in south coastal British Columbia could exceed any of those experienced in the past ∼350 years.
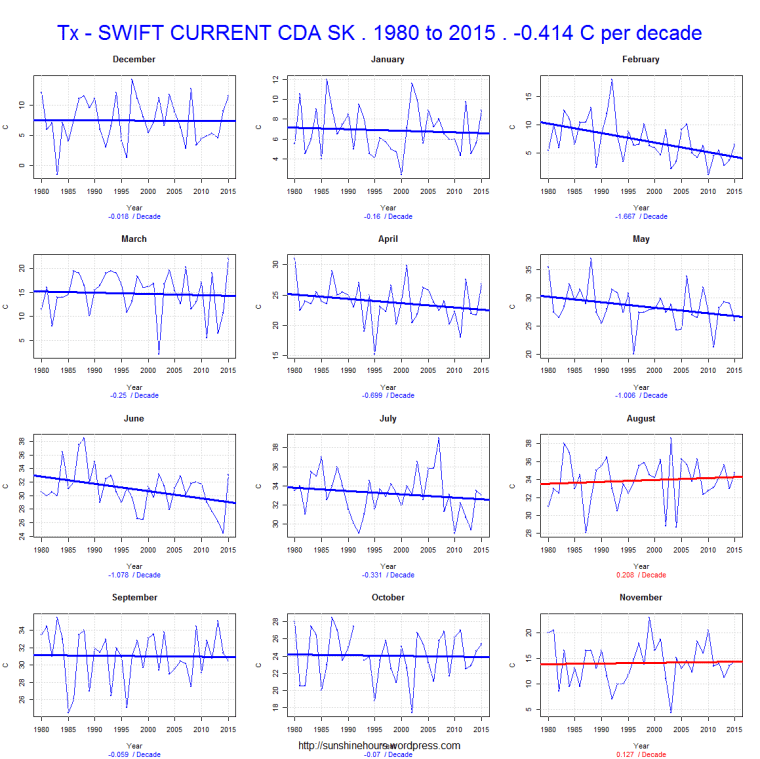
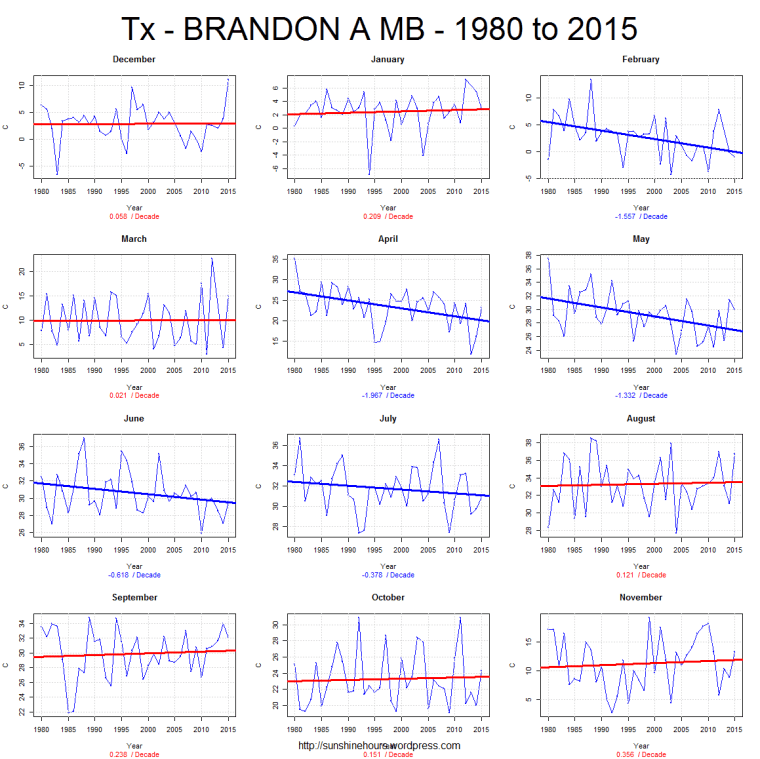
A few days I published 10 more randomly chosen graphs of TMAX using Environment Canada’s monthly summaries.
I was fiddling with the graphing code to add the overall rate of temp change and color the title – red for warming and blue for cooling.
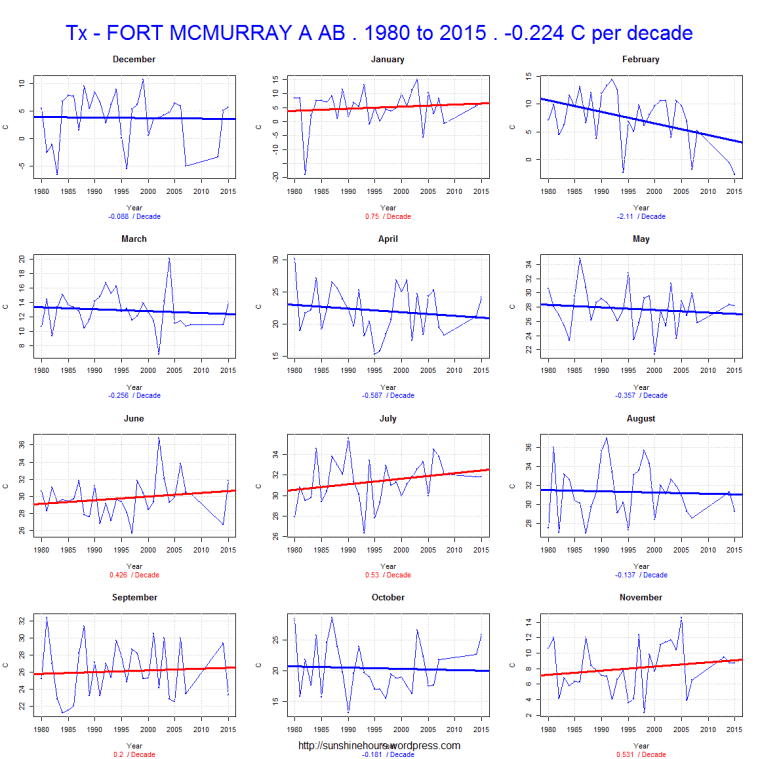
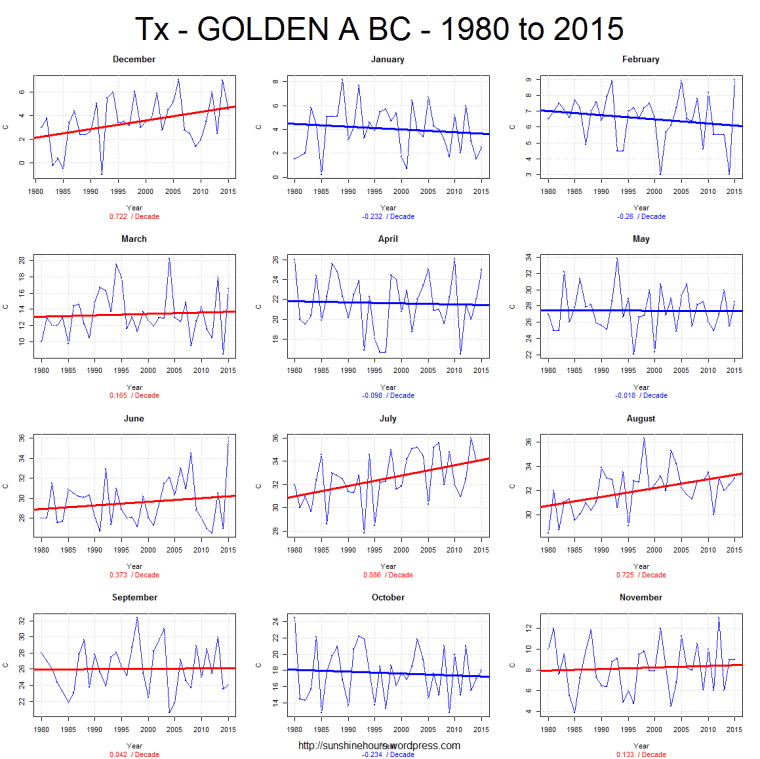
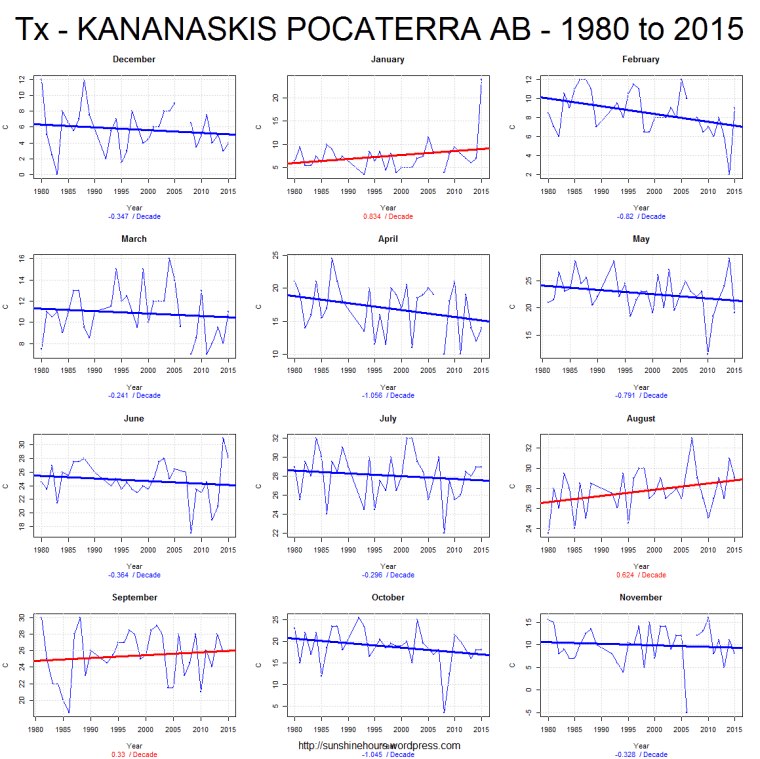
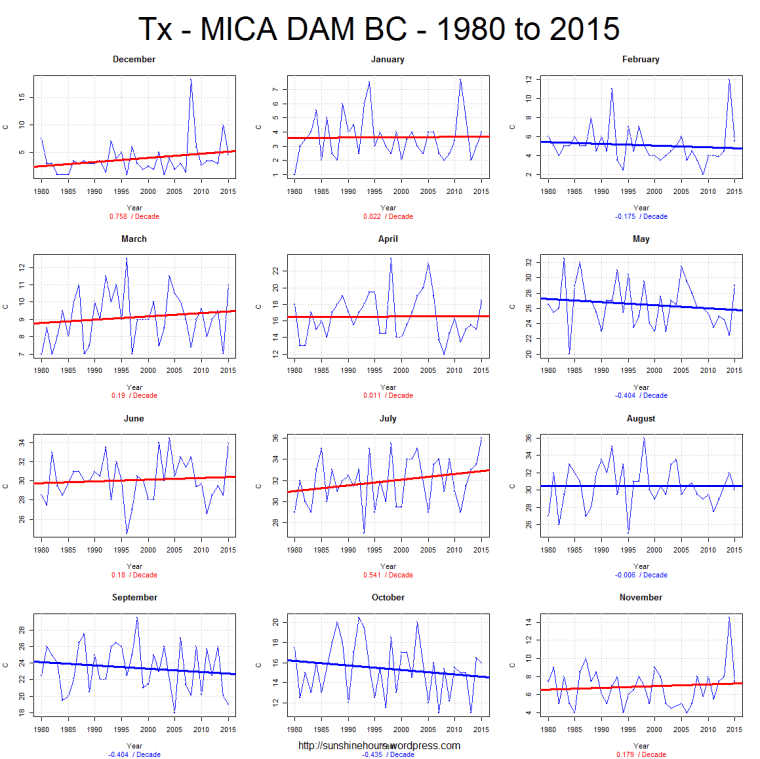
I took a closer look at 3 stations (2 are airports).
Tmax temperatures falling at -.414C /dec, -.224/dec and -.246/dec
April Tmax in Brandon have fallen 7C in 35 years.

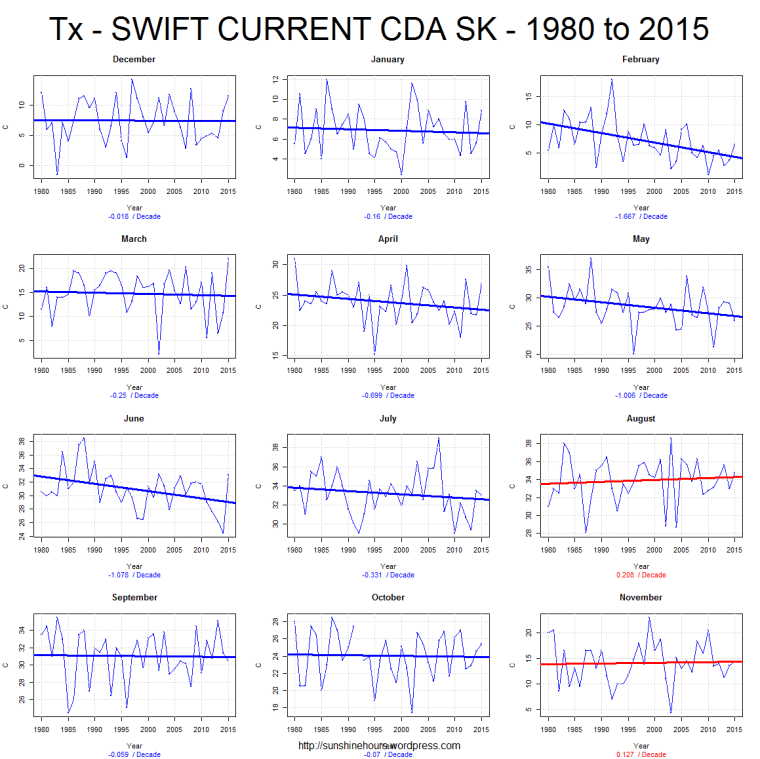
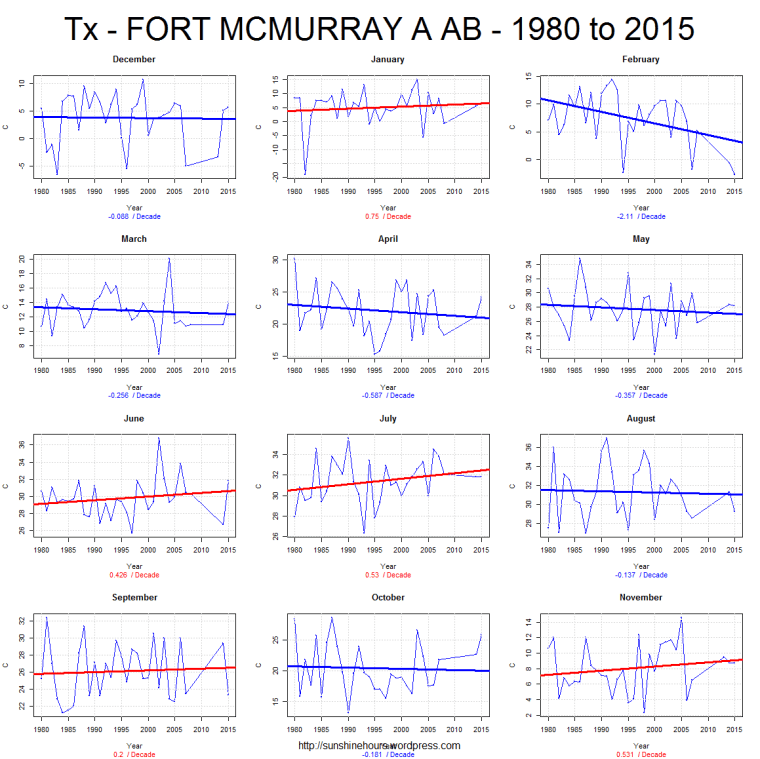
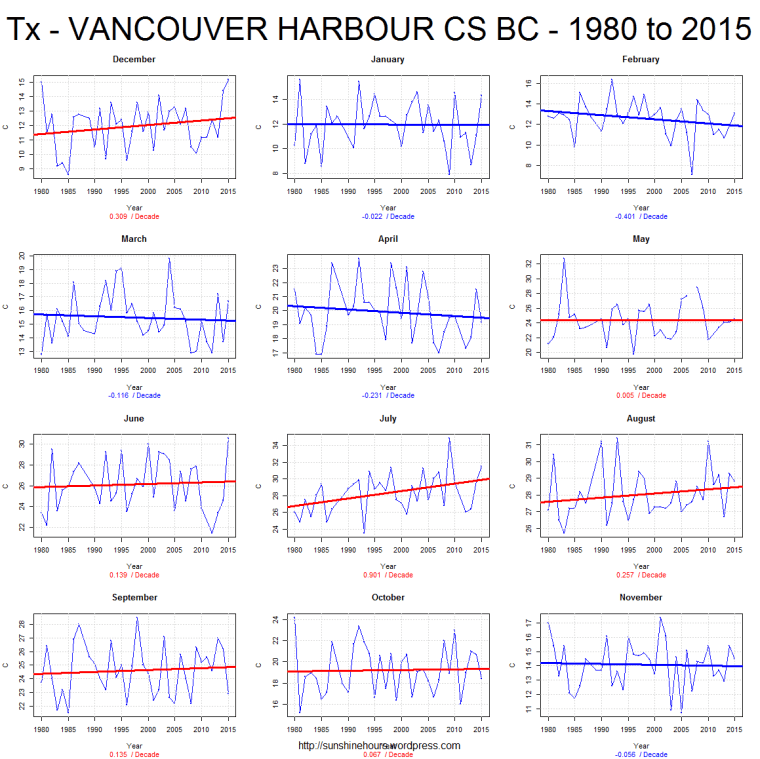
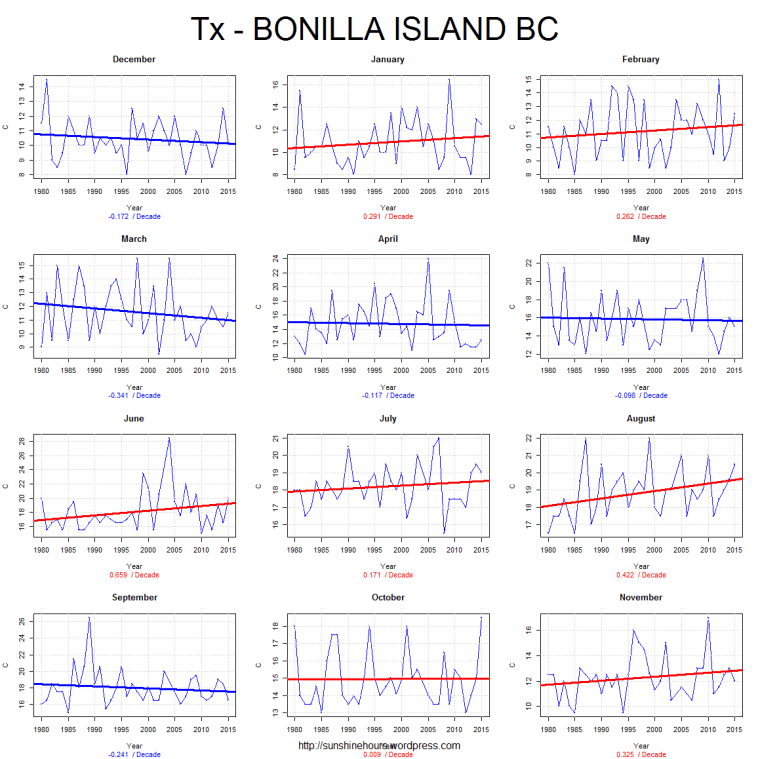
A few days I published 10 randomly chosen graphs of TMAX using Environment Canada’s monthly summaries.
I picked 1980 to 2015 partly to create a round number and partly because that is sort of when AGW became noticeable.
I picked TMAX because I think TMIN’s are rising because of UHI.
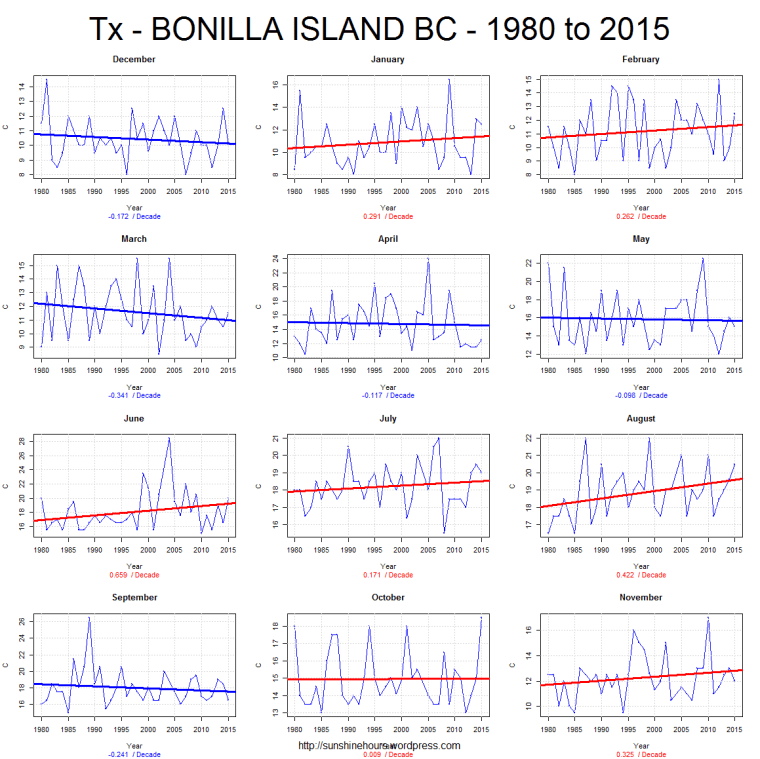
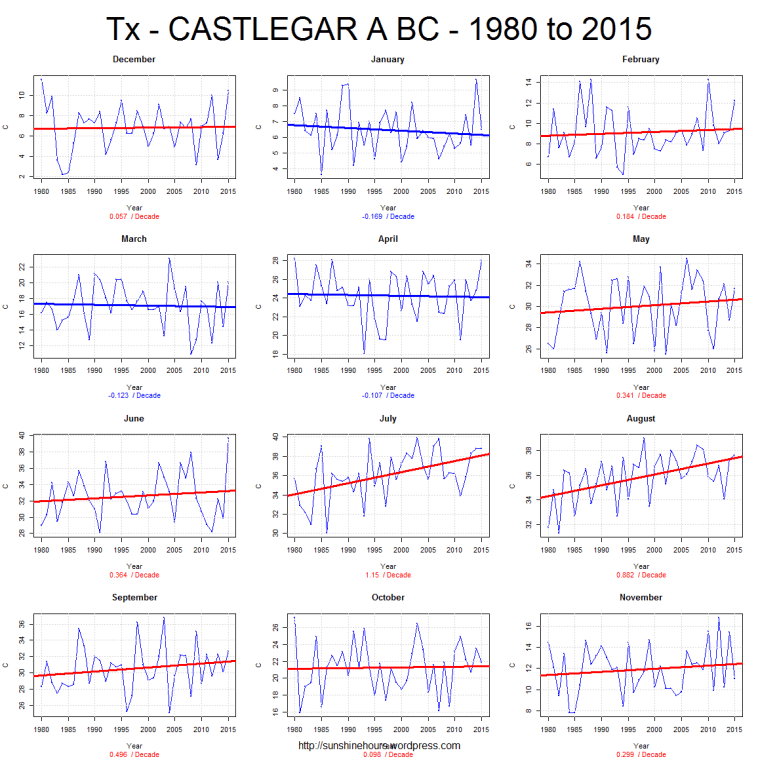
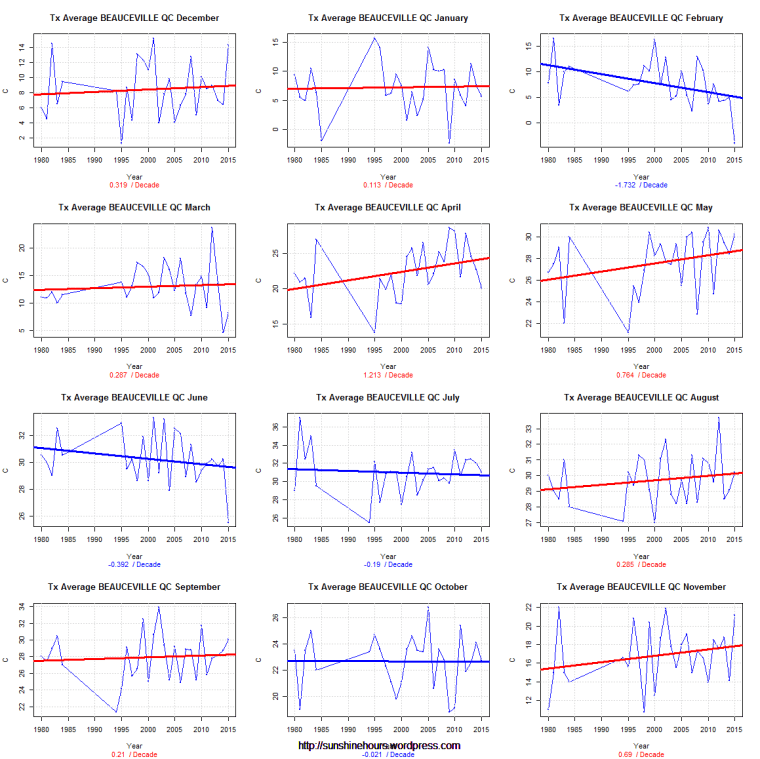
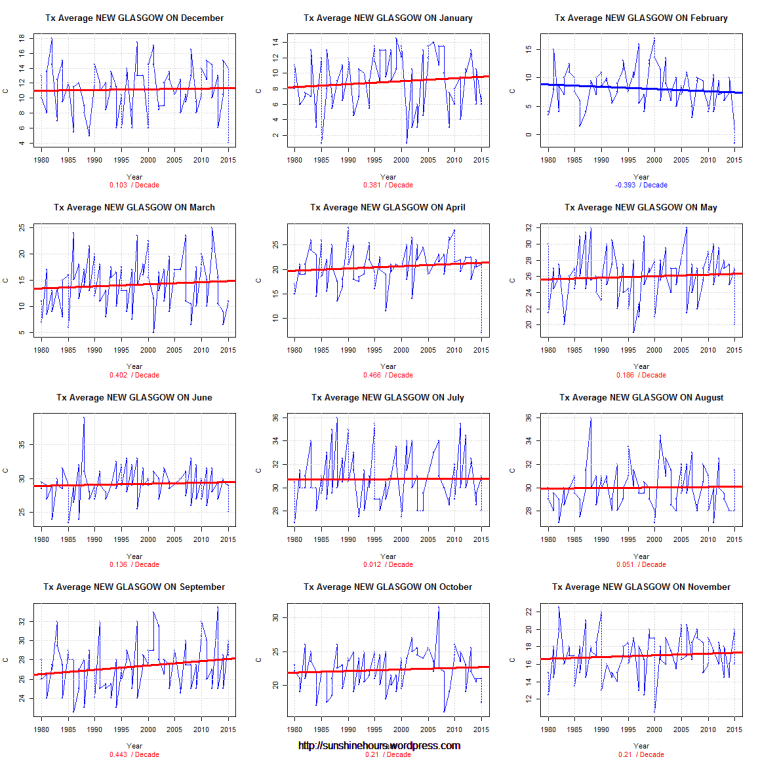
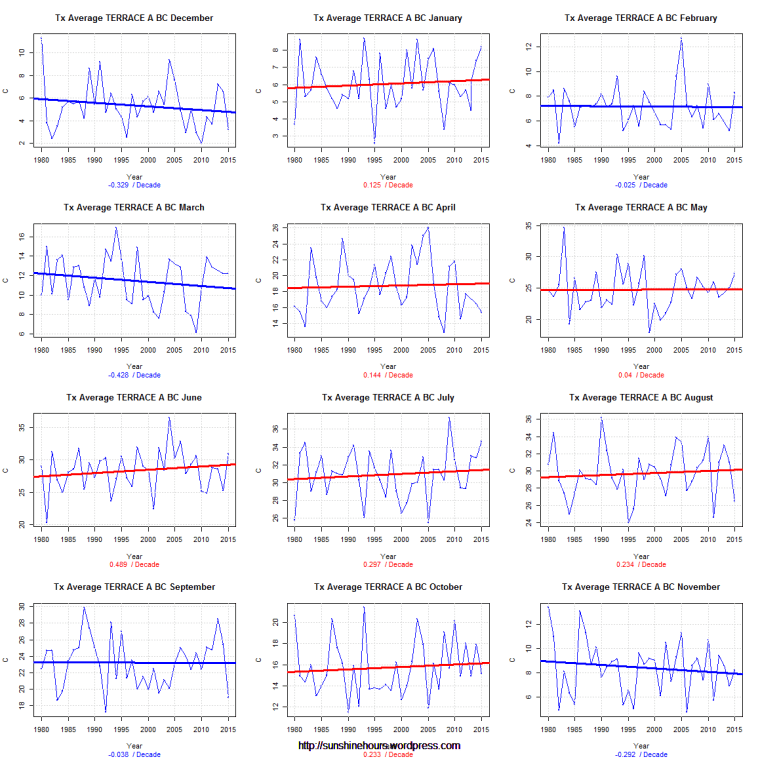
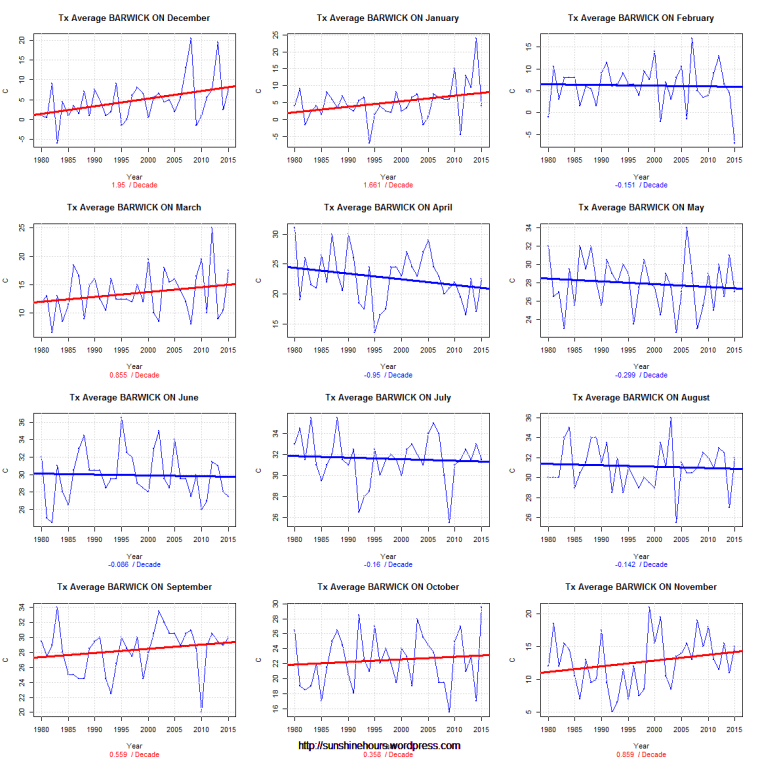
The red lines indicate a warming trend. The blue a cooling trend.
Anyone see evidence of CO2 making it warm?
Here are 10 more.
Every once in a while I visit the data for the Canada. Earlier today I looked at the station nearest me (NANAIMO A).
But since I have the code … I thought why not look at 10 random stations that have data in 1980 and 2015.
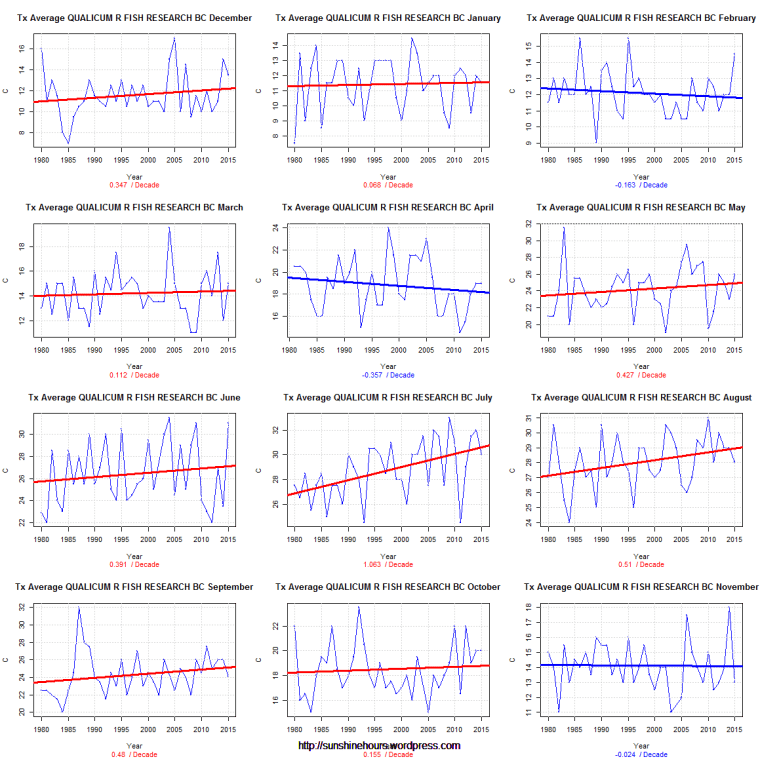
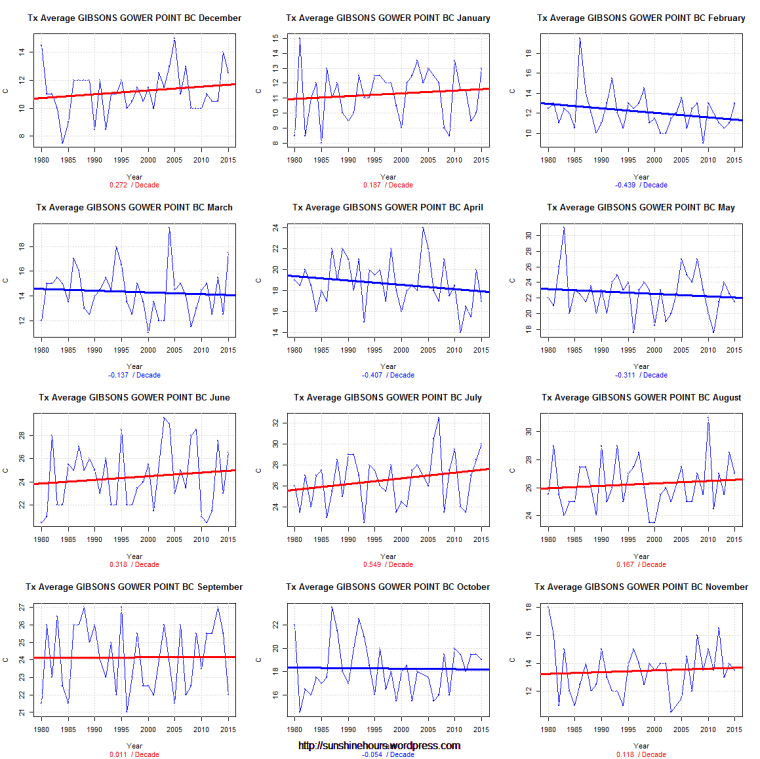
Today I am looking at TMAX monthly data (using Environment Canada monthly summaries) for 10 random stations from 1980.
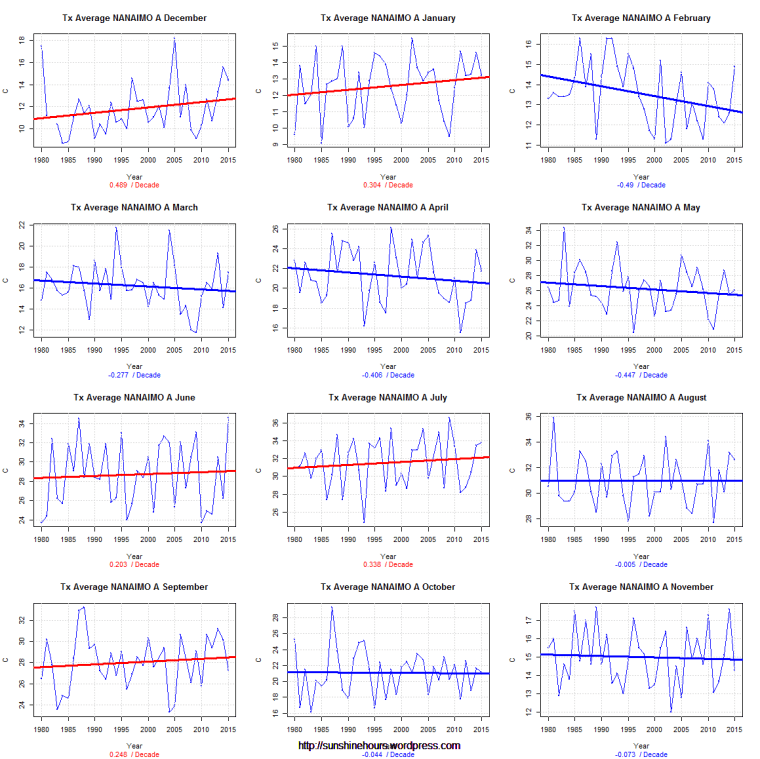
Each line of graphs is a season – Dec/Jan/Feb …. etc.


Every once in a while I visit the data for the weather station closest to my hometown on the west coast of Canada.
Today I am looking at TMAX monthly data (using Environment Canada monthly summaries) for NANAIMO A from 1980.
Each line of graphs is a season – Dec/Jan/Feb …. etc.
5 months are warming. 4 are cooling. 3 are cooling ever so slightly.
If there is a CO2 signal in there I am missing it.