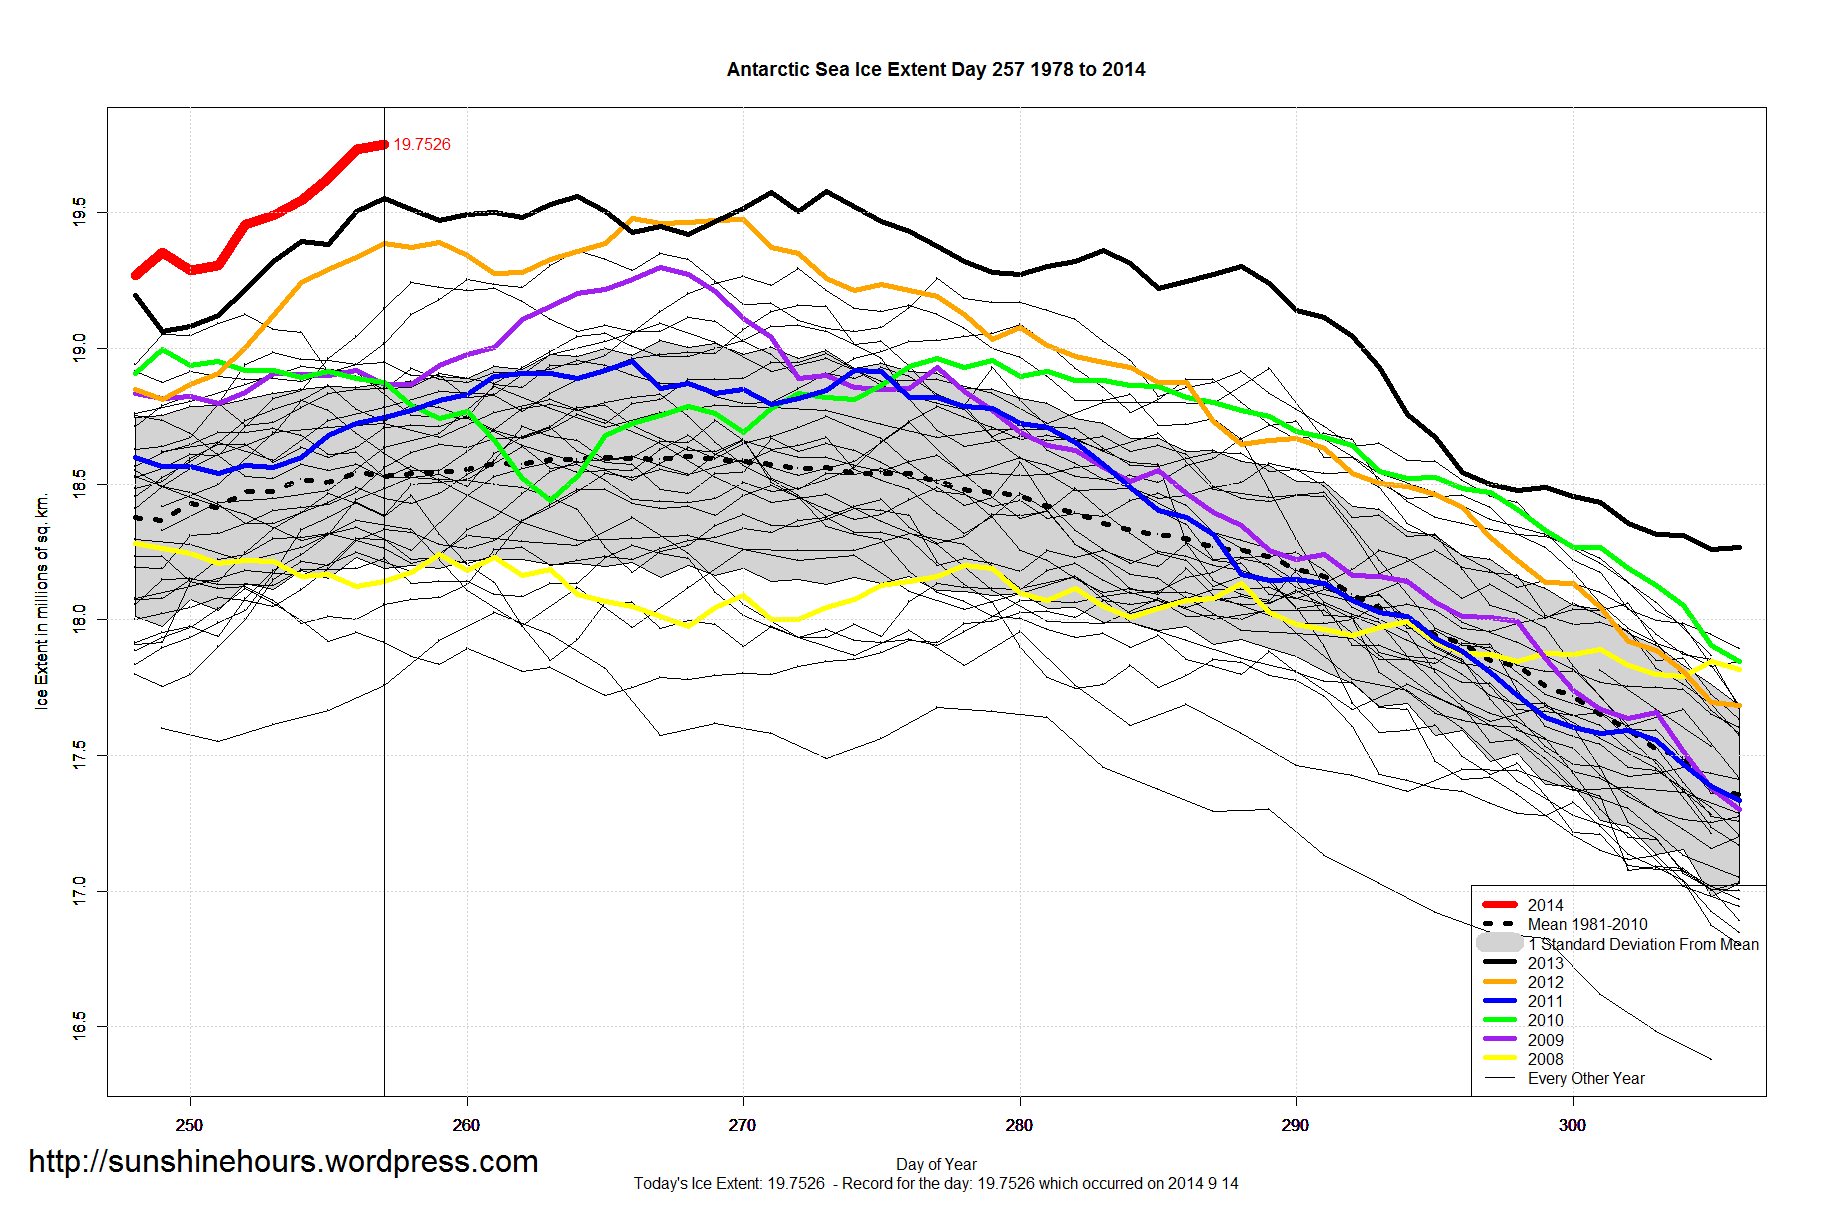
Antarctic Sea Ice Extent Sept 15 2014 – 1,224,000 sq km above the 1981-2010 mean. Data for Day 257. Data here.
18,000 sq km higher than yesterdays record. And 170,000 sq km higher than 2013’s all-time record.

Antarctic Sea Ice Extent Sept 15 2014 – 1,224,000 sq km above the 1981-2010 mean. Data for Day 257. Data here.
18,000 sq km higher than yesterdays record. And 170,000 sq km higher than 2013’s all-time record.
Update: And another record
Antarctic Sea Ice Extent Sept 14 2014 – 1,191,000 sq km above the 1981-2010 mean. Data for Day 256. Data here.
Amazing. Day 256 has broken the day 255 all-time record by 110,000 sq km. And the daily record from 2013 was broken by 230,000 sq km.
History making.


Wow
““If Toronto’s Pearson International Airport weather station doesn’t hit 30.0ºC before the end of August — and it’s not looking like it will — this will be the first consecutive July and August that Pearson has not hit 30.0ºC+ since records began at Pearson in 1938 — that’s 76 years of data,” says Weather Network meteorologist Dayna Vettese.”
http://iceagenow.info/2014/08/summer-toronto-verge-setting-record/
Here is a histogram collection showing that there have been 1371 days over 30C at the airport. But 2014 could be blank.
Note that “global warming” hasn’t caused any increase in “heat waves”.

Have you ever read a paper on climate science and seen a sentence like this:
“We would like to emphasise that this study does not question the existence of a long-term anthropogenic warming trend during the 20th century.”
Guess what. That means the paper has probably been censored by the climate gatekeepers running the journals.
GWPF has the story from The Times:
“Research that questioned the accuracy of computer models used to predict global warming was “censored” by climate scientists, it was alleged yesterday.
One academic reviewer said that a section should not be published because it “would lead to unnecessary confusion in the climate science community”. Another wrote: “This entire discussion has to disappear.”
The paper suggested that the computer models used by the UN’s Intergovernmental Panel on Climate Change (IPCC) were flawed, resulting in human influence on the climate being exaggerated and the impact of natural variability being underplayed.”
A third reviewer was much more supportive of the paper, saying its “very provocative” suggestion that climate models were flawed was “so interesting that it needs to be discussed more fully”.
However, almost the entire paragraph was deleted, along with the conclusion that “the average sensitivity of the IPCC models may be too high”.
The journal chose to publish only the opening sentence: “We would like to emphasise that this study does not question the existence of a long-term anthropogenic warming trend during the 20th century.”
A new “study” is out.
“Britain will have fewer days of ‘extreme cold’ and will enjoy milder winters as a direct result of climate change, according to a new study.
The new research is set to cool growing fears that the Northern Hemisphere could be gripped by more severe winters throughout the next century due to the Arctic warming up.”
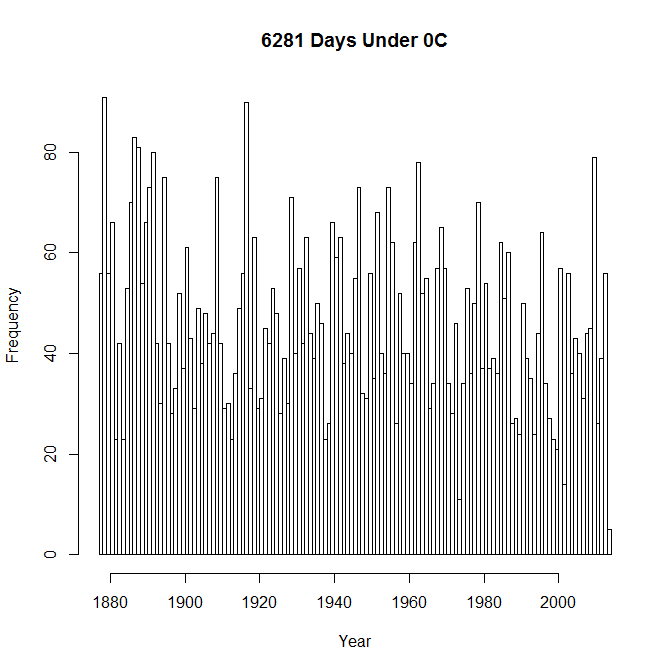
In these cases I like to turn to HADCET Daily Minimum data which is available from 1878 on. And I thought I would look at the number of days that the minimum was lower or equal to 0C for each year.
Wow. 2010 had the 6th highest number of days that were 0C or colder. So much for “Global Warming”.
| Year | Days | Longest Coldwave |
| 1879 | 91 | 18 |
| 1917 | 90 | 28 |
| 1887 | 83 | 11 |
| 1888 | 81 | 23 |
| 1892 | 80 | 14 |
| 2010 | 79 | 16 |
| 1963 | 78 | 27 |
| 1895 | 75 | 32 |
| 1909 | 75 | 23 |
| 1891 | 73 | 13 |
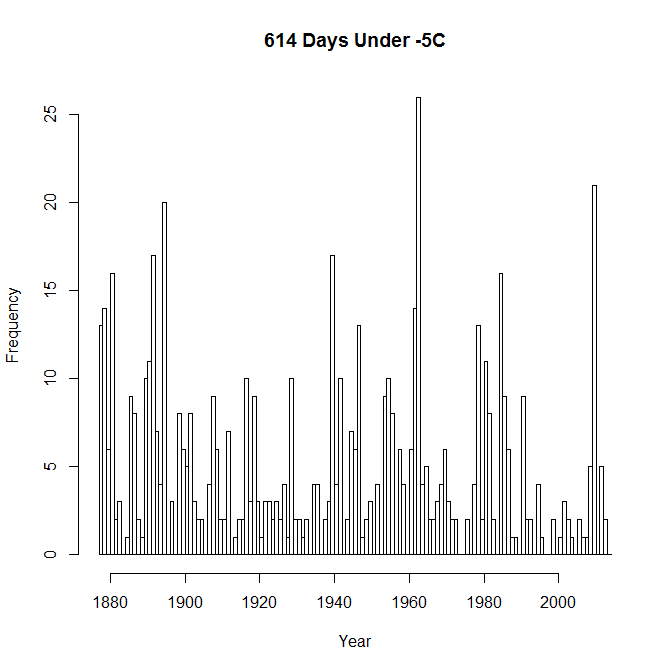
What about equal to or less than -5C? Wow! 2010 was 2nd highest with 21 days.
| Year | Days | Longest Coldwave |
| 1963 | 26 | 5 |
| 2010 | 21 | 5 |
| 1895 | 20 | 11 |
| 1892 | 17 | 7 |
| 1940 | 17 | 14 |
| 1881 | 16 | 8 |
| 1985 | 16 | 6 |
| 1879 | 14 | 7 |
| 1962 | 14 | 3 |
| 1878 | 13 | 6 |
According to the NOAA the first 5 months (Jan-May) 2014 was ranked 56th out of 120 (120 = warmest) .
The cooling trend for Jan-May dates back to 1990. 2012 was the hot aberration.

These are the anomalies from the Jan-May average. It has been a cold start to the year for the East while warmer in the south west.
![cag_[ Statewide Avg Temp Anomalies (average between Jan 2014 and May 2014) ]](https://sunshinehours.net/wp-content/uploads/2014/06/cag_-statewide-avg-temp-anomalies-average-between-jan-2014-and-may-2014.jpg)
According to the NOAA April 2014 was ranked 75th out of 120 April’s (120 = warmest) . It was only .66F above the 1901-2000 average.
The 3rd warmest April in US history was in 1925 when it was 3.67F above the 1901-2000 average.
Other April’s warmer than 2014: 1895,1896,1906,1908,1910,1915,1925,1930,1934,1938,1941,1942,1943,1946,1948,1949 ….

According to Time Magazine: “Climate change skeptics are pointing to the record cold weather as evidence that the globe isn’t warming. But it could be that melting Arctic ice is making sudden cold snaps more likely—not less”
Do you want to see what a cold snap really looks like according to the NOAA?
February 1936 – Coldest Month in USA History (click on the image for the full effect)
![cag_[ Statewide Temperature Anomalies (Feb 1936) ]](https://sunshinehours.net/wp-content/uploads/2014/04/cag_-statewide-temperature-anomalies-feb-1936.jpg)
In 2014, Feb was -1.69°F below the 1901-2000 average. In February 1936 the USA was -8.59°F below average. Big difference.

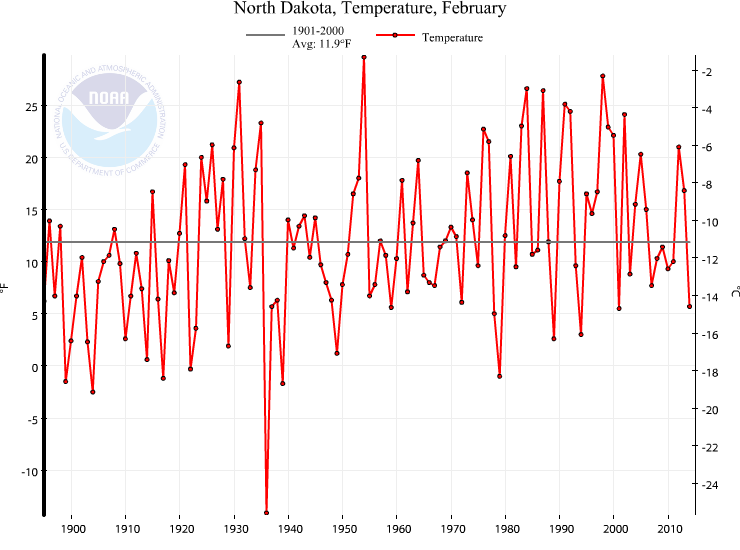
In North Dakota, February 1936 was –26.0°F below the 1901-2000 average. The whole month averaged -14.1°F below 0.
In comparison, lets take a look at Feb 2014:
![cag_[ Statewide Temperature Anomalies (Feb 2014) ]](https://sunshinehours.net/wp-content/uploads/2014/04/cag_-statewide-temperature-anomalies-feb-2014.jpg)
March 1910 (Before Global Warming) 7.94°F Above the 1901-2000 Average
![cag_[ Divisional Temperature Anomalies (Mar 1910) ]](https://sunshinehours.net/wp-content/uploads/2014/04/cag_-divisional-temperature-anomalies-mar-1910.jpg)
Some of those divisions are 16F above normal.
March 2014 (After Global Warming) -0.99°F Below the 1901-2000 Average
![cag_[ Divisional Temperature Anomalies (Mar 2014) ]](https://sunshinehours.net/wp-content/uploads/2014/04/cag_-divisional-temperature-anomalies-mar-2014.jpg)
http://gis.ncdc.noaa.gov/map/cag/#app=cdo
PS I just randomly picked 1934 without checking. And then I noticed 1910 … but I’ll post the 1934 map so it doesn’t go to waste.
March 1934 (Before Global Warming) 1.28°F Above the 1901-2000 Average
![cag_[ Divisional Temperature Anomalies (Mar 1934) ]](https://sunshinehours.net/wp-content/uploads/2014/04/cag_-divisional-temperature-anomalies-mar-1934.jpg)
As a minor followup to my post “Could CO2 have lowered the rate of natural warming?” lets consider ocean warming.
From 1900 to 1945 oceans were warming at a rate of 0.0116188C per year.
After 1945 oceans were warming at a rate of 0.00654978C per year.
Which means the massive 1945 increase in CO2 after 1945 slowed the rate of ocean warming by 0.00506902C per year. Which is a drop off 44%.
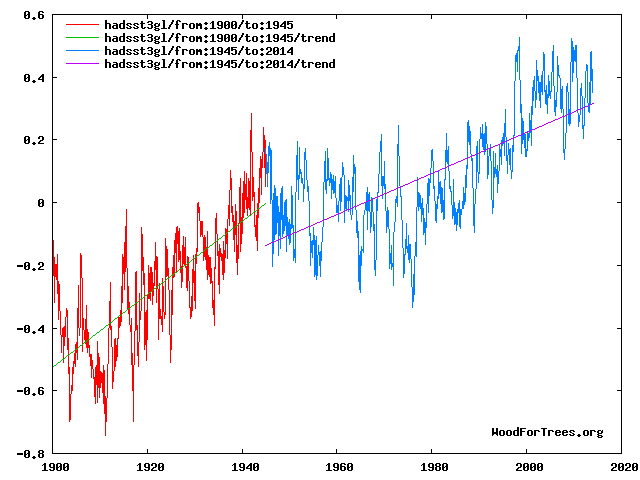
Woodfortrees Url is here.
