This is the 3rd or 4th post on USHCN warming. You can read more here.
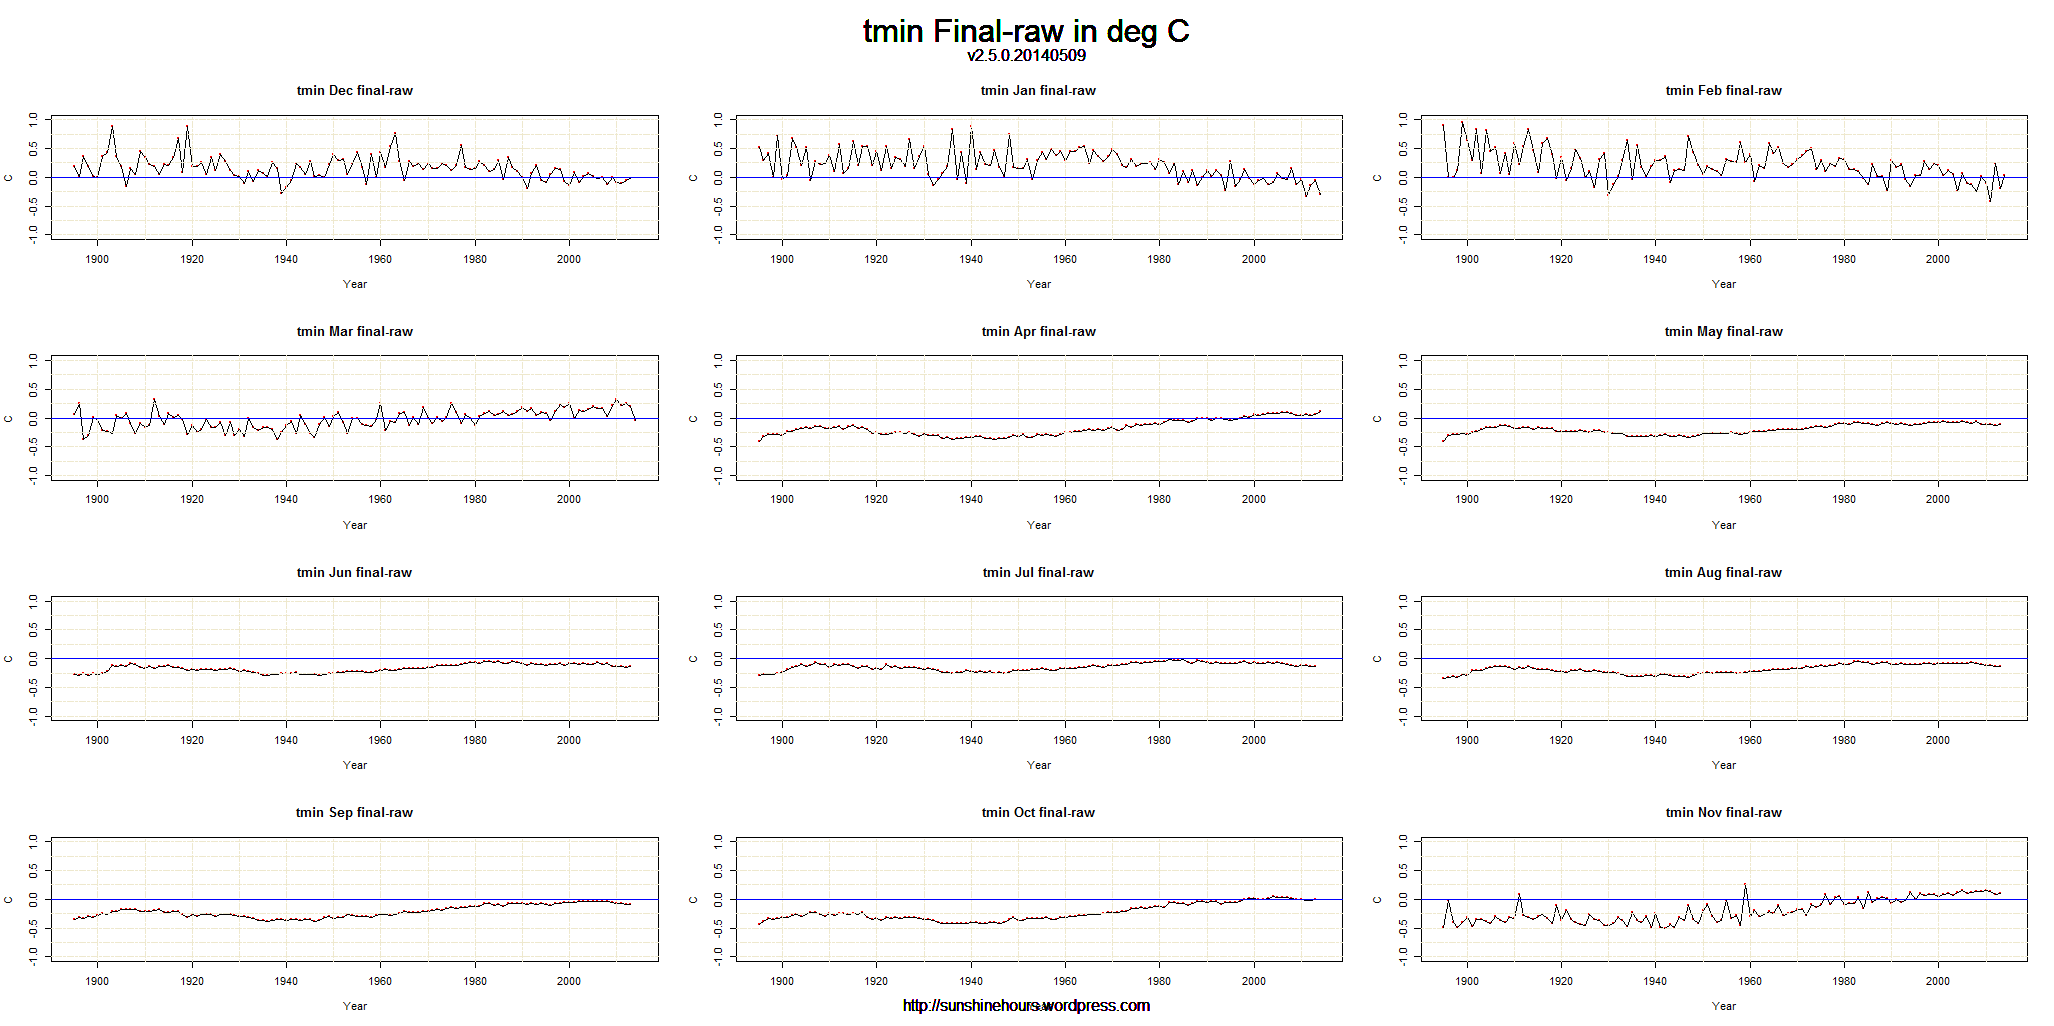
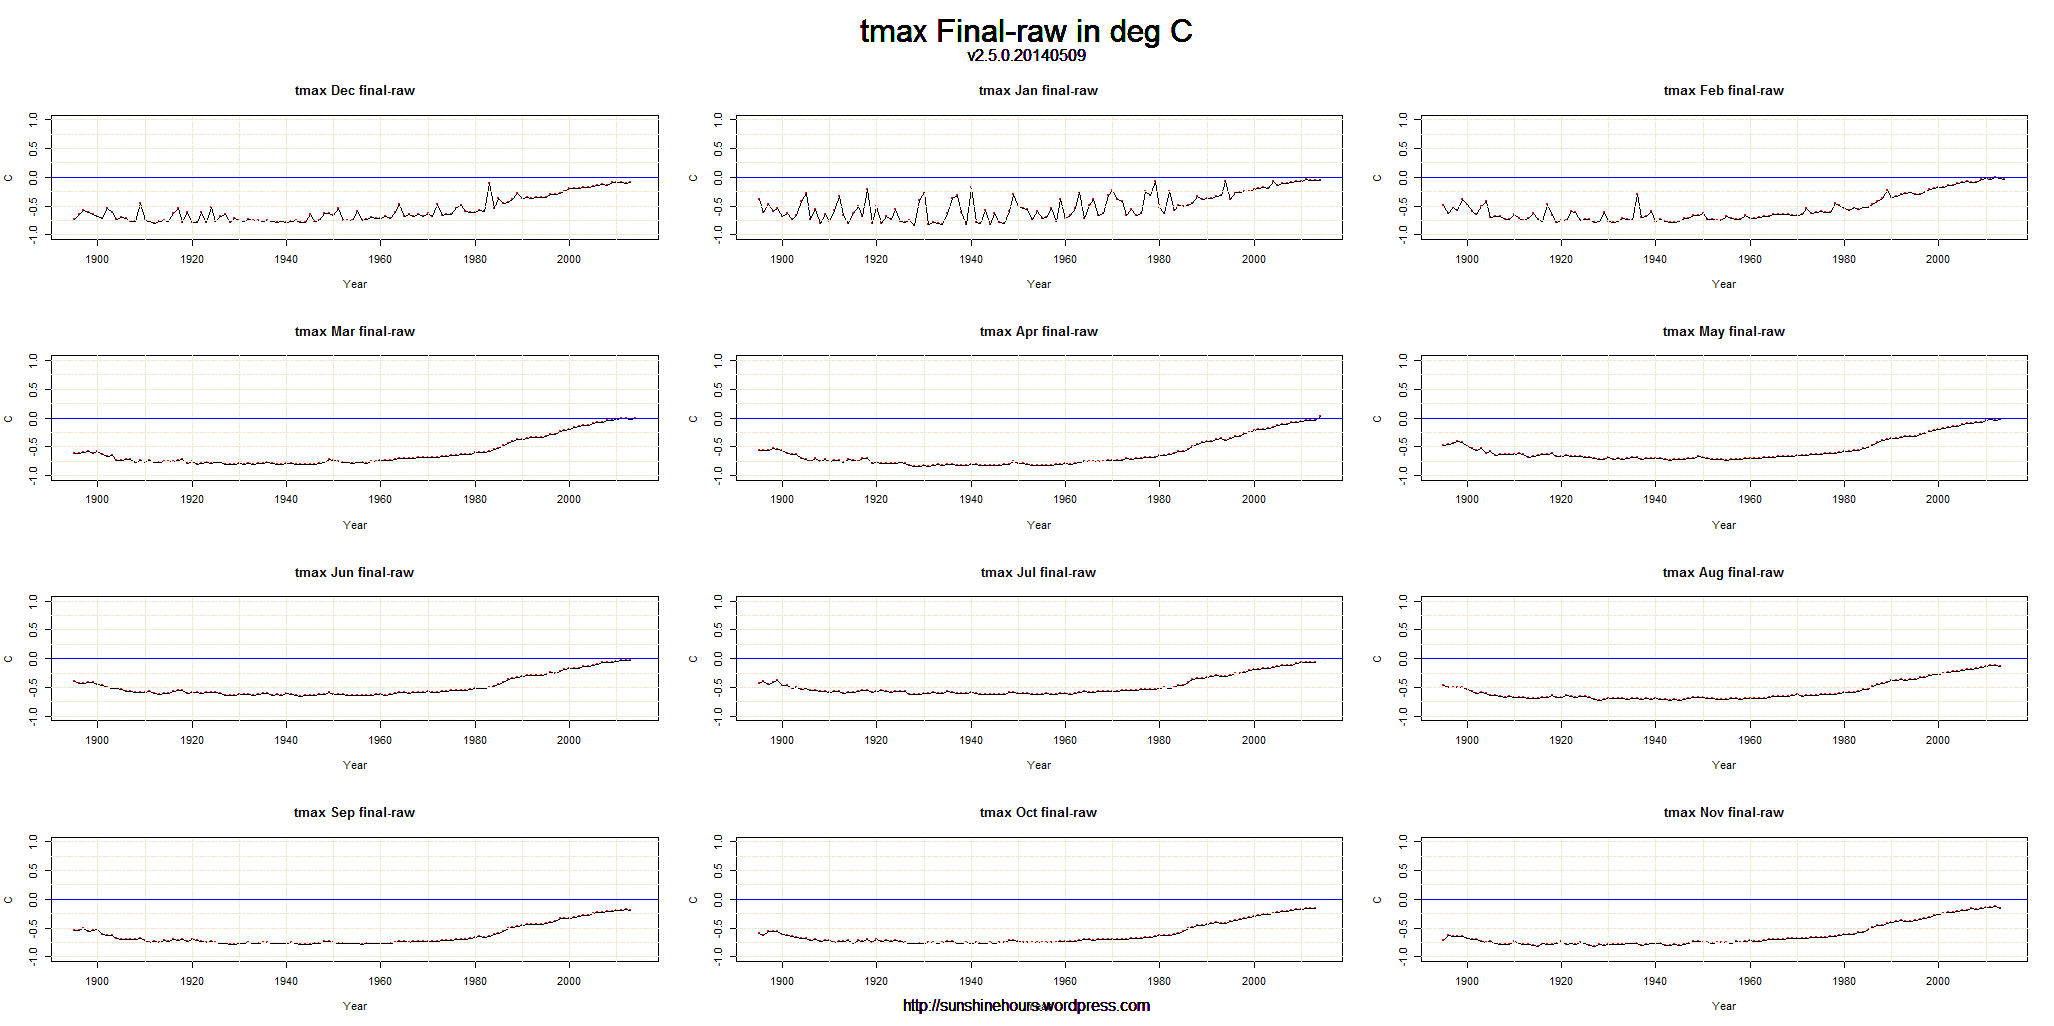
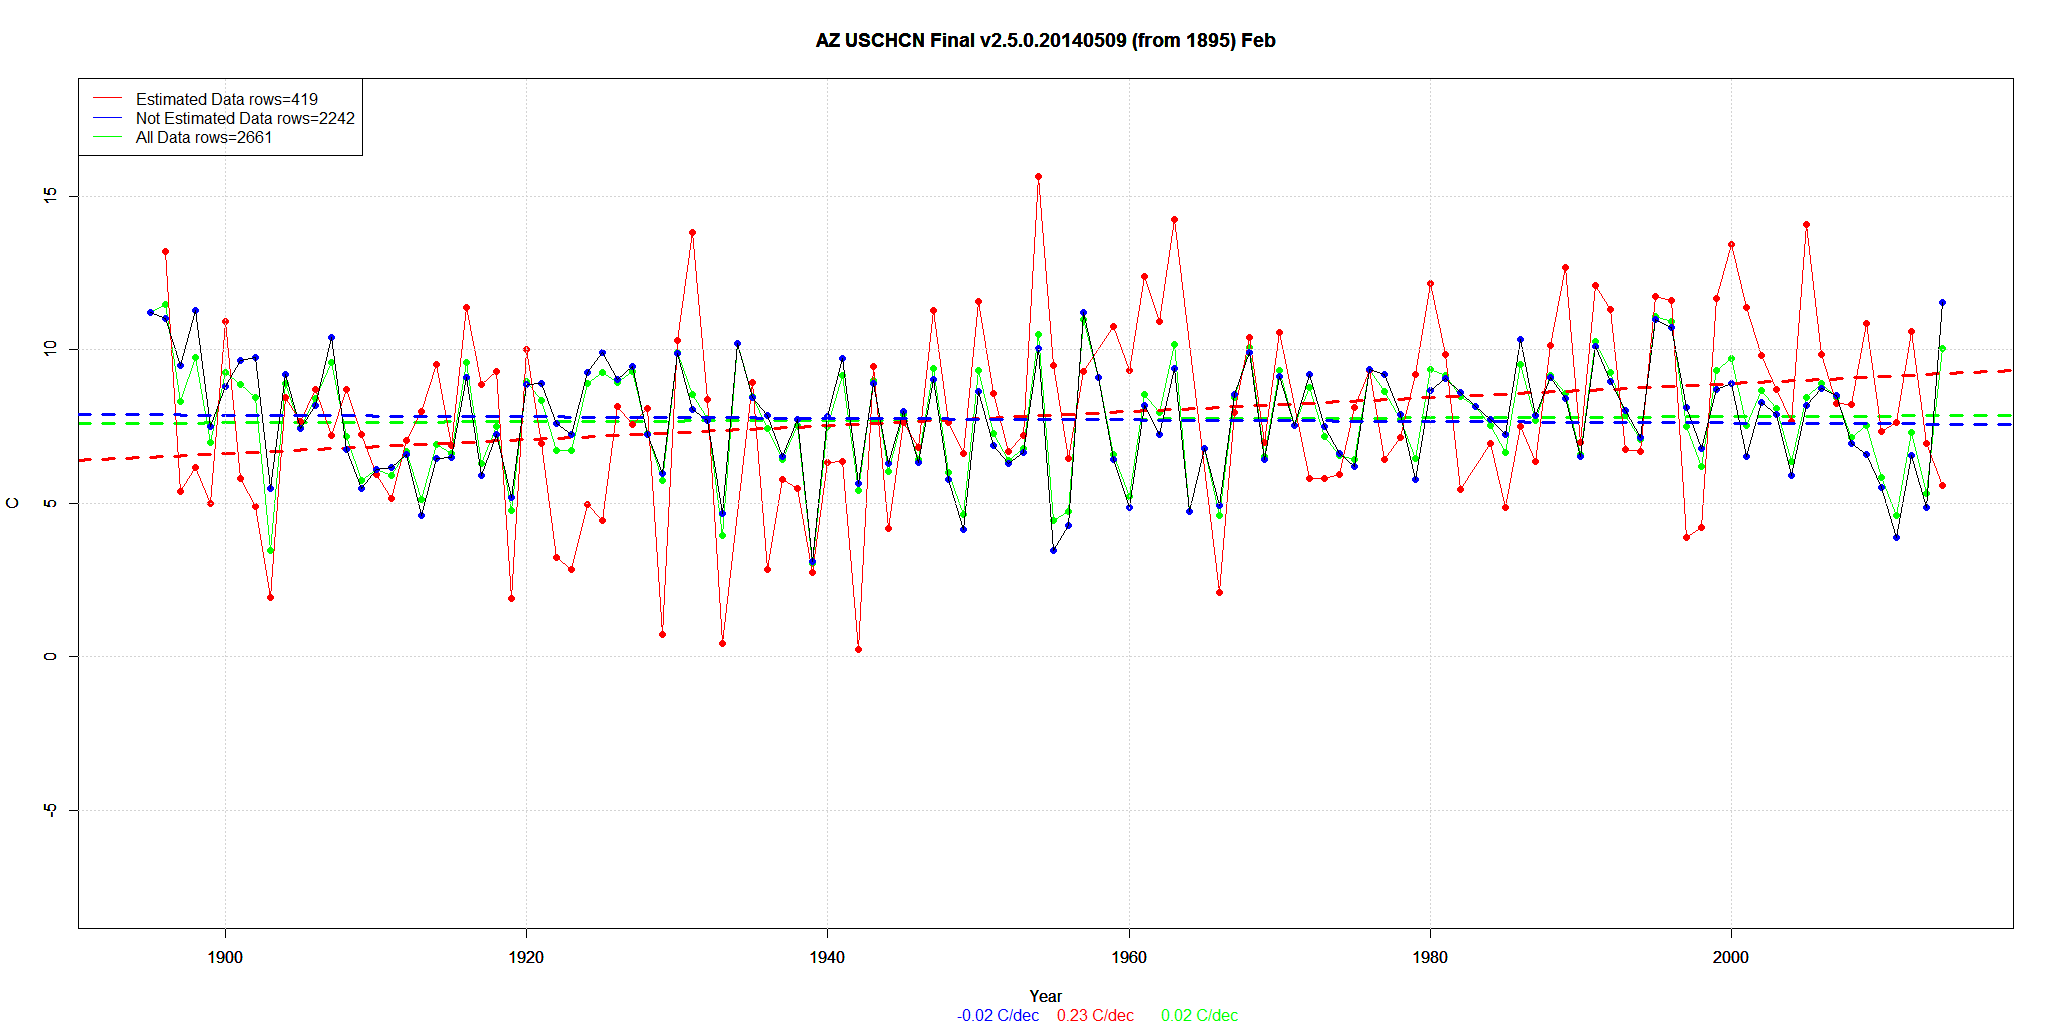
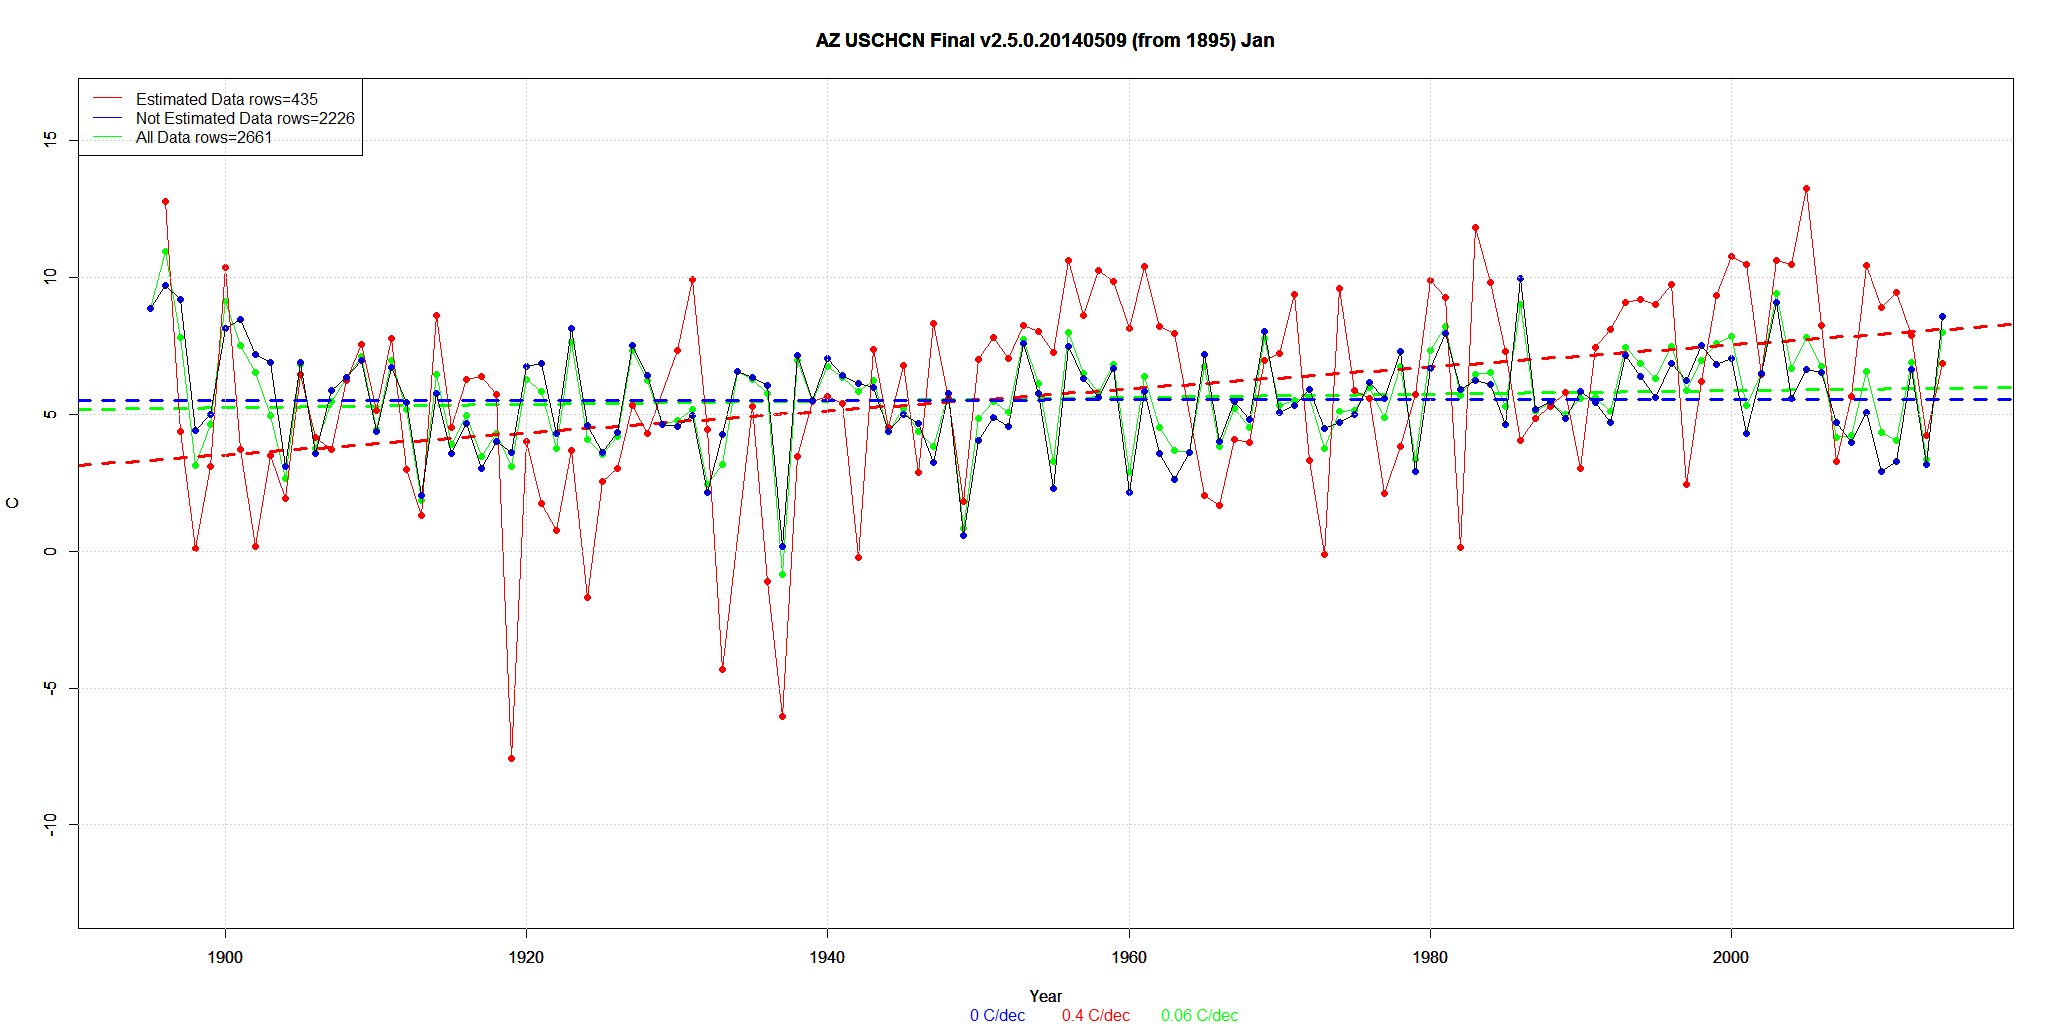
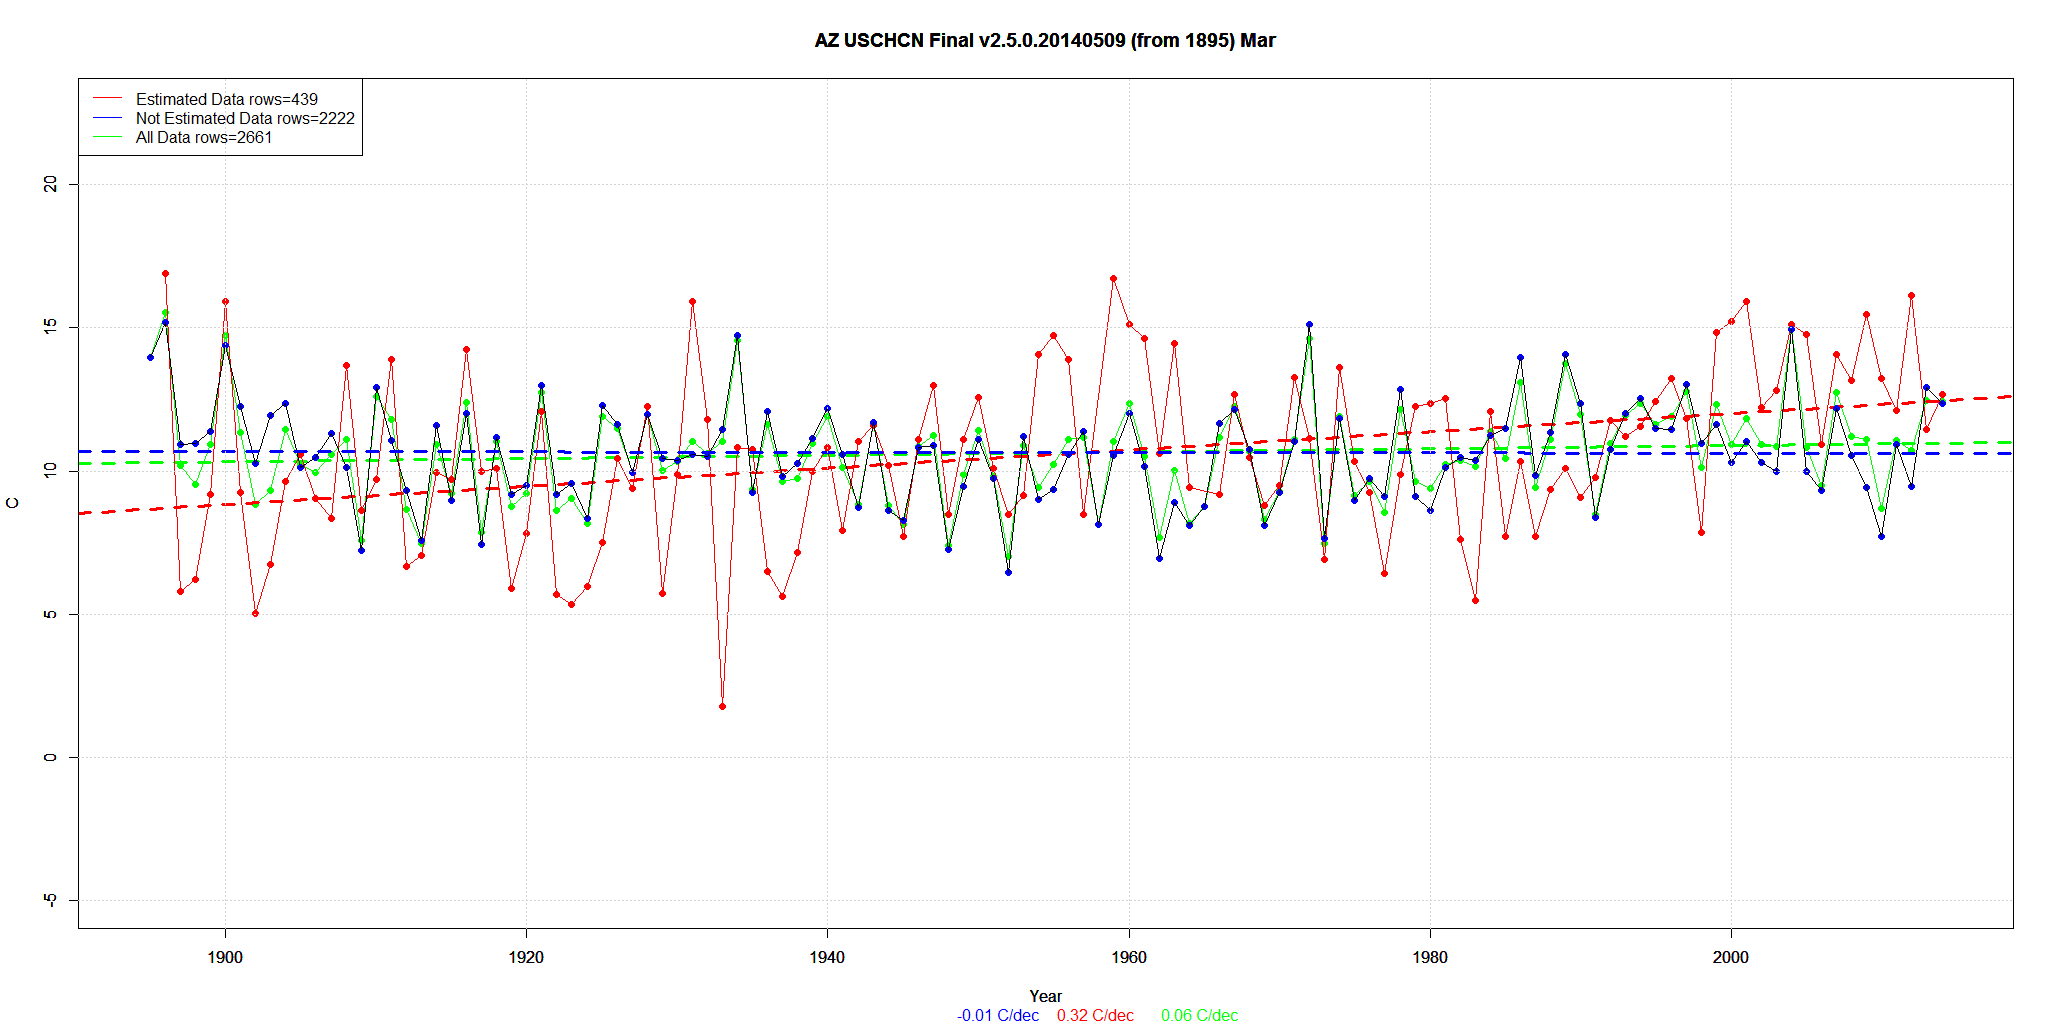
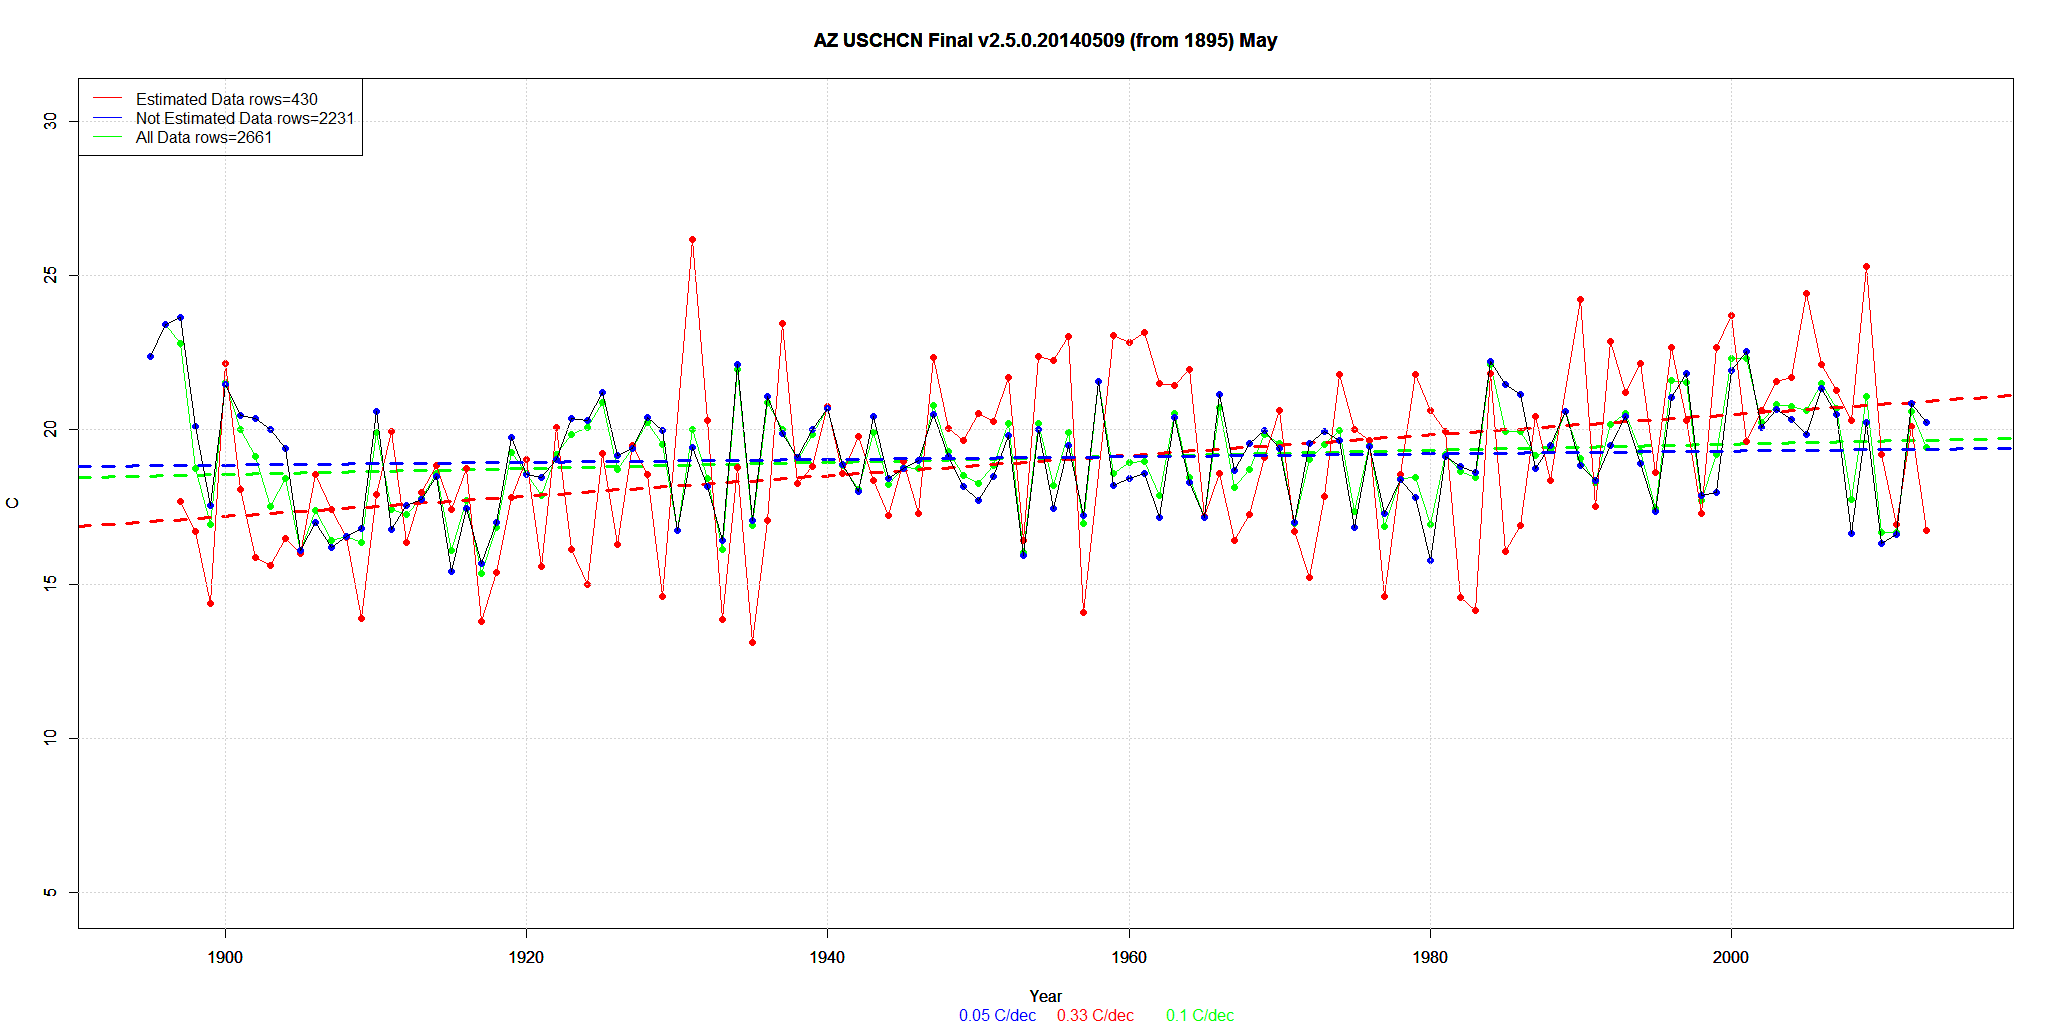
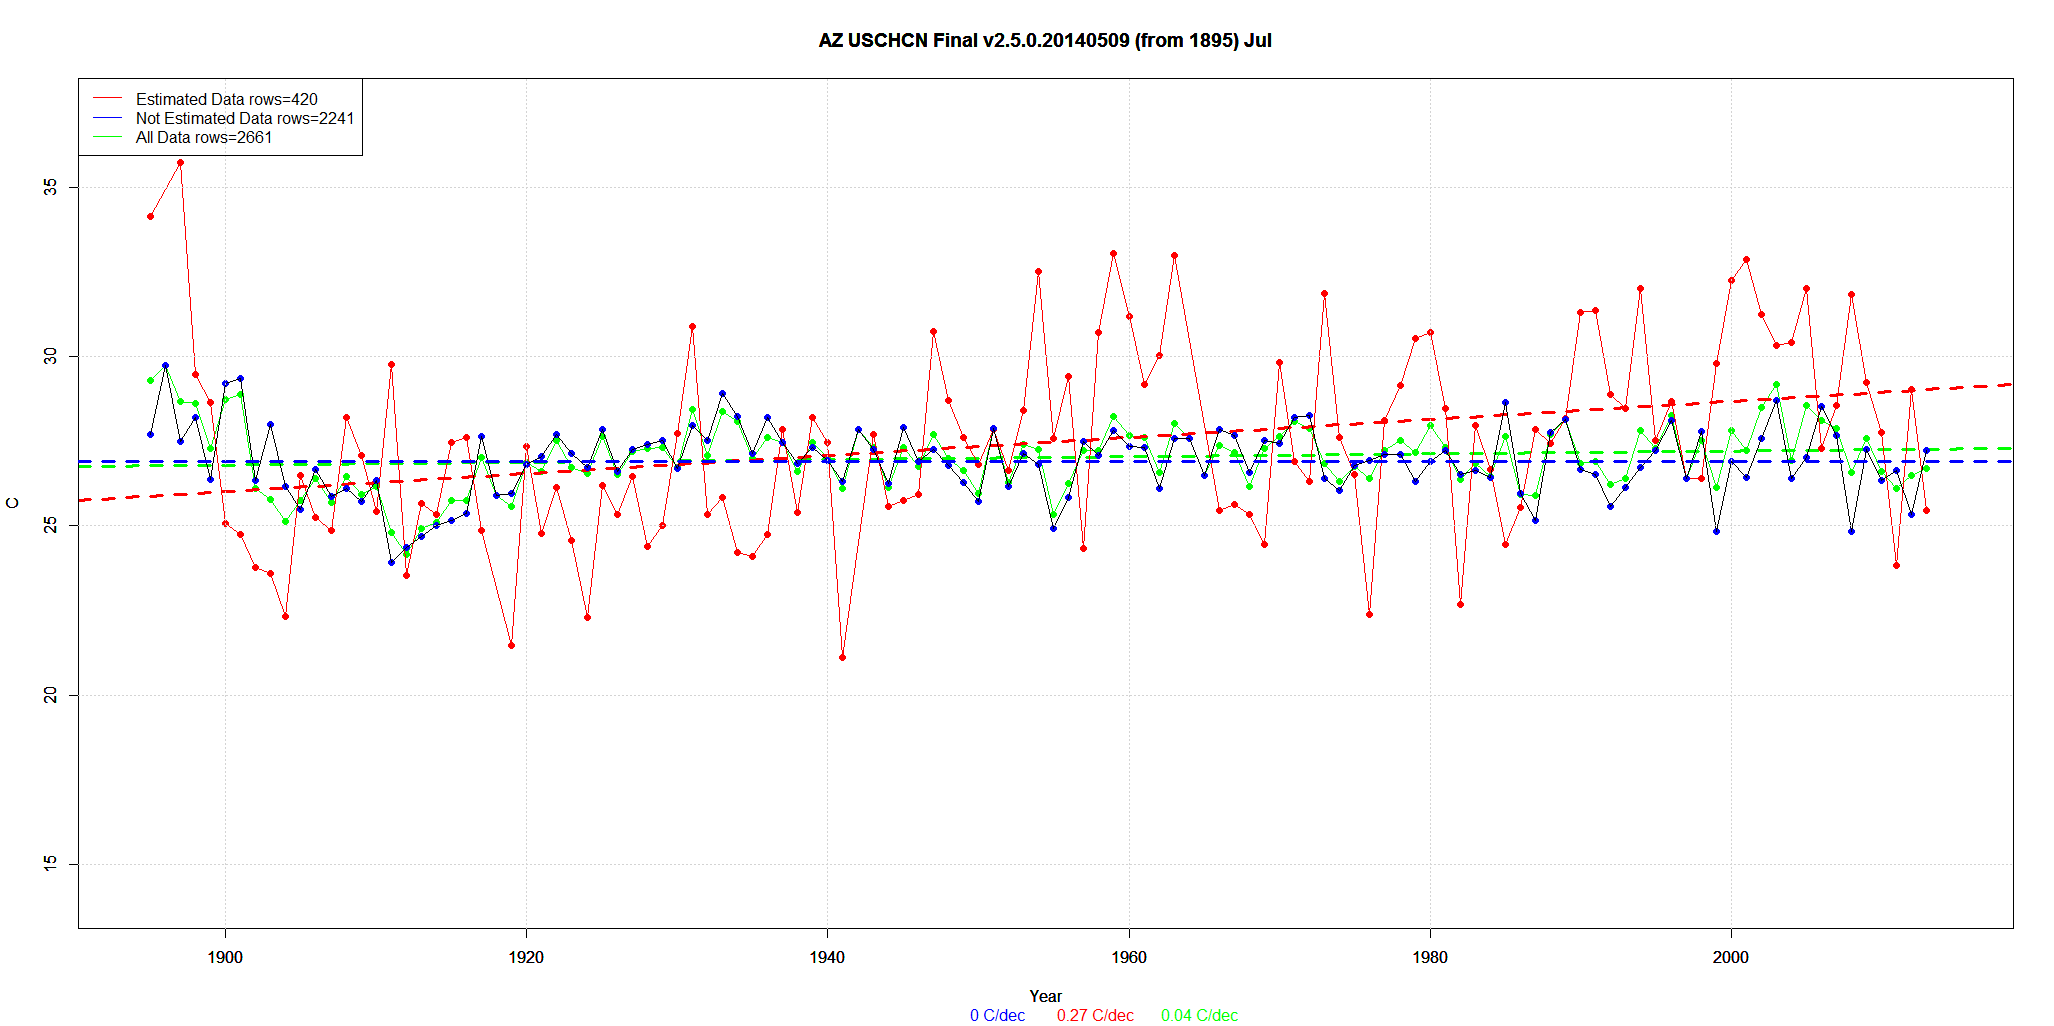
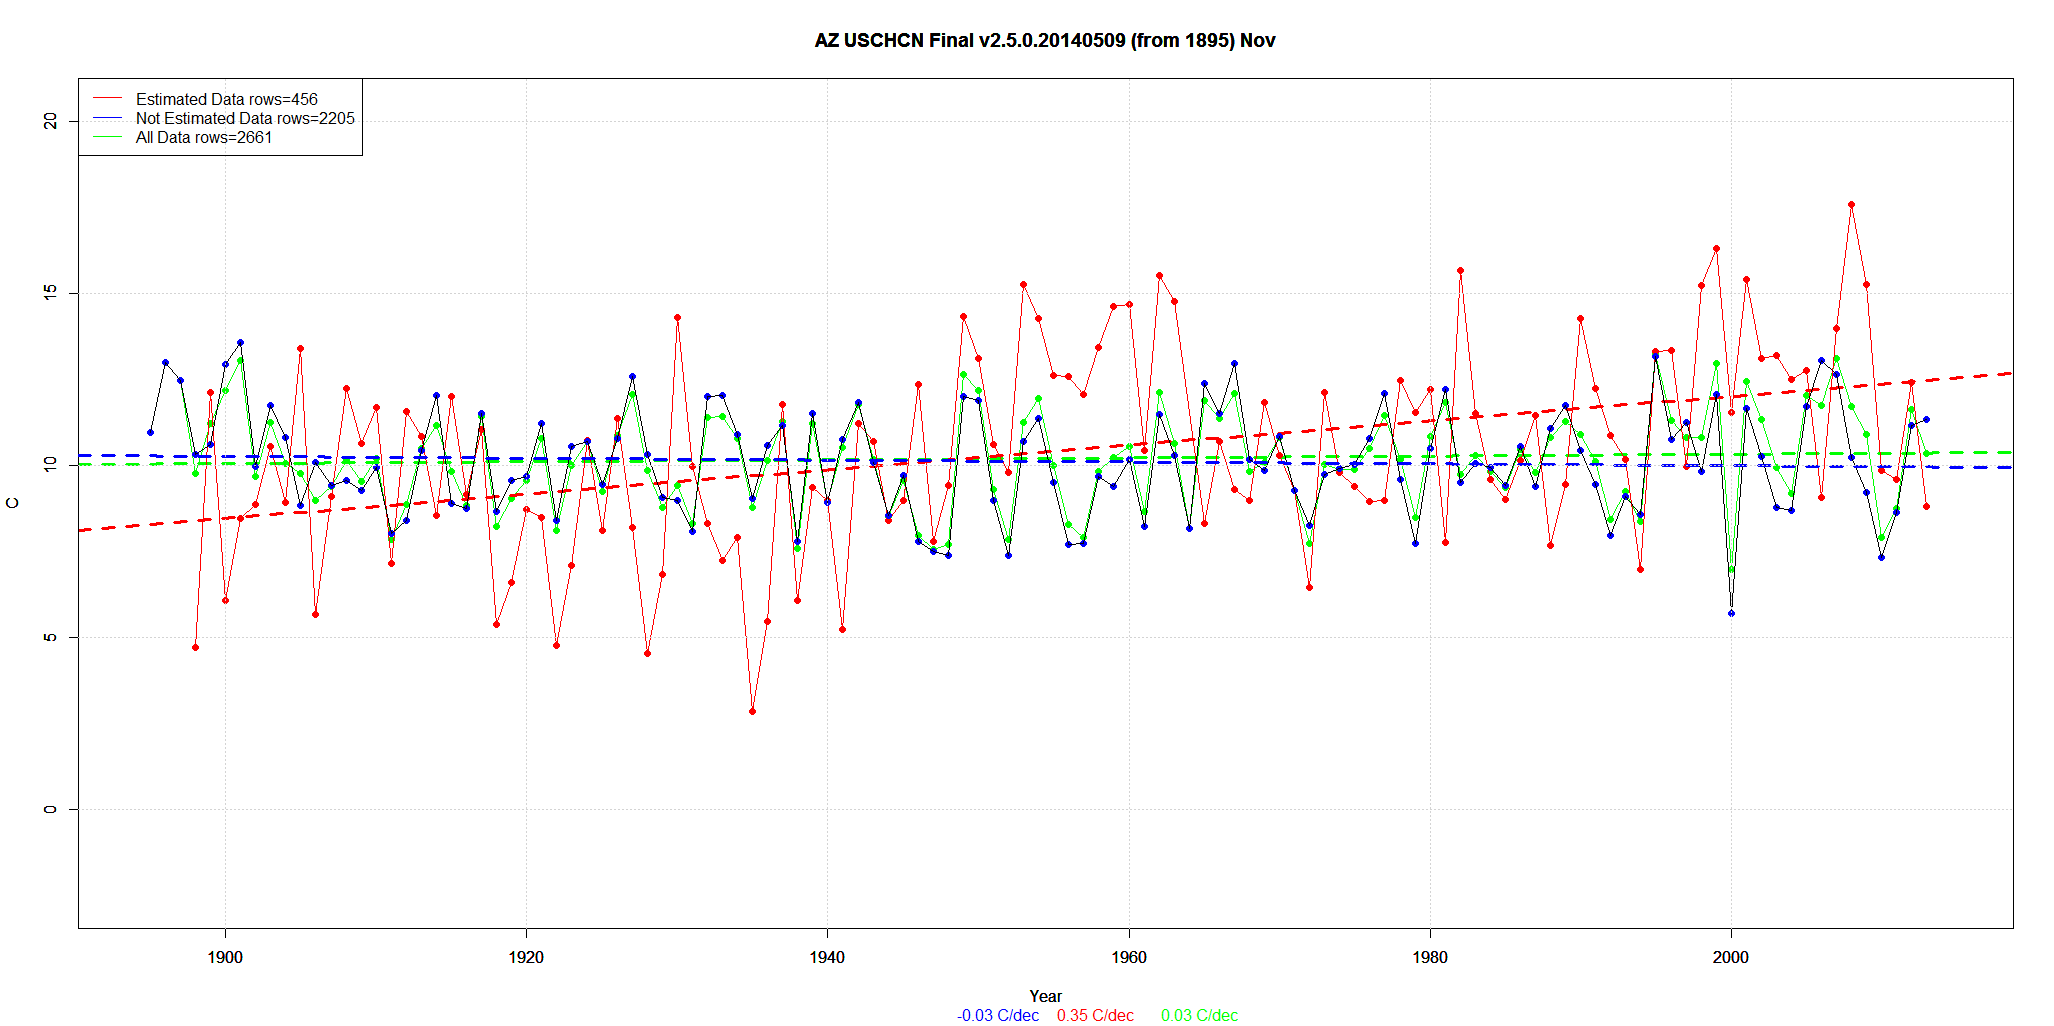
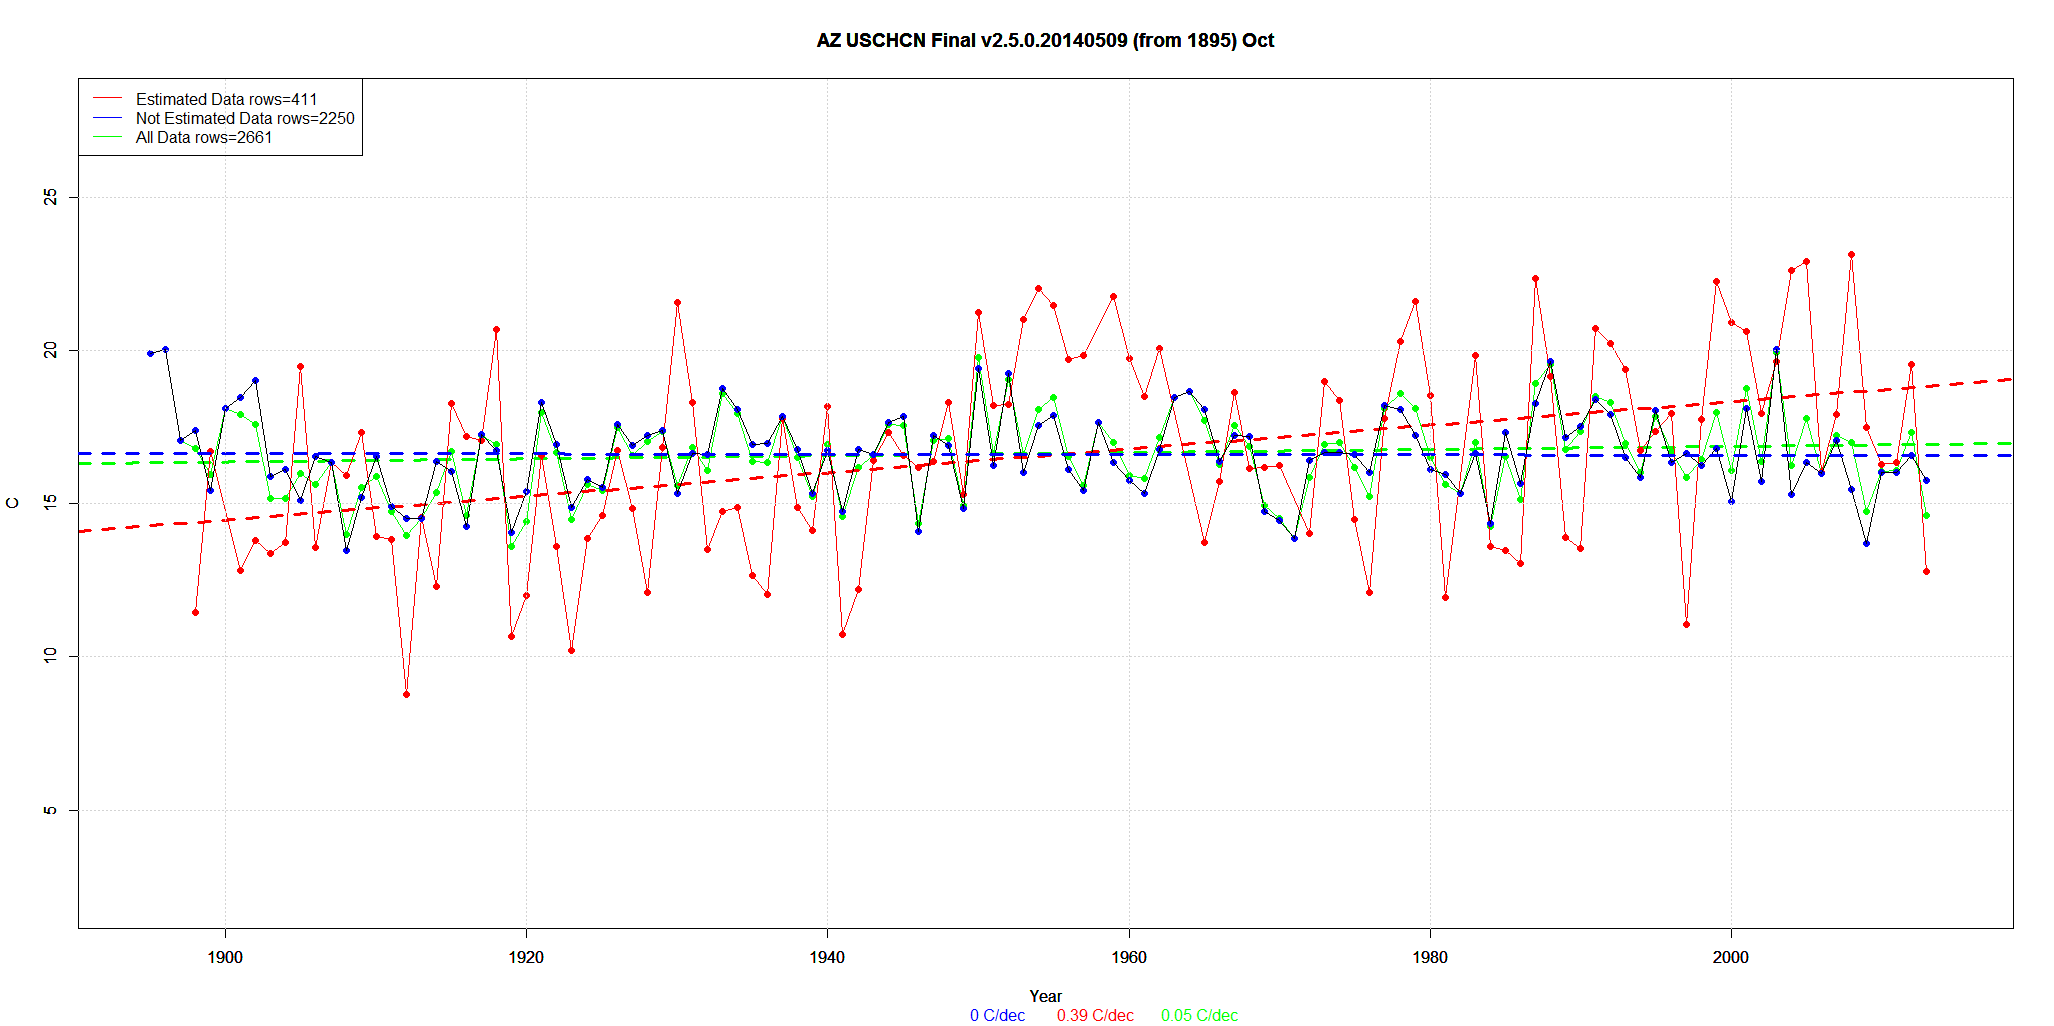
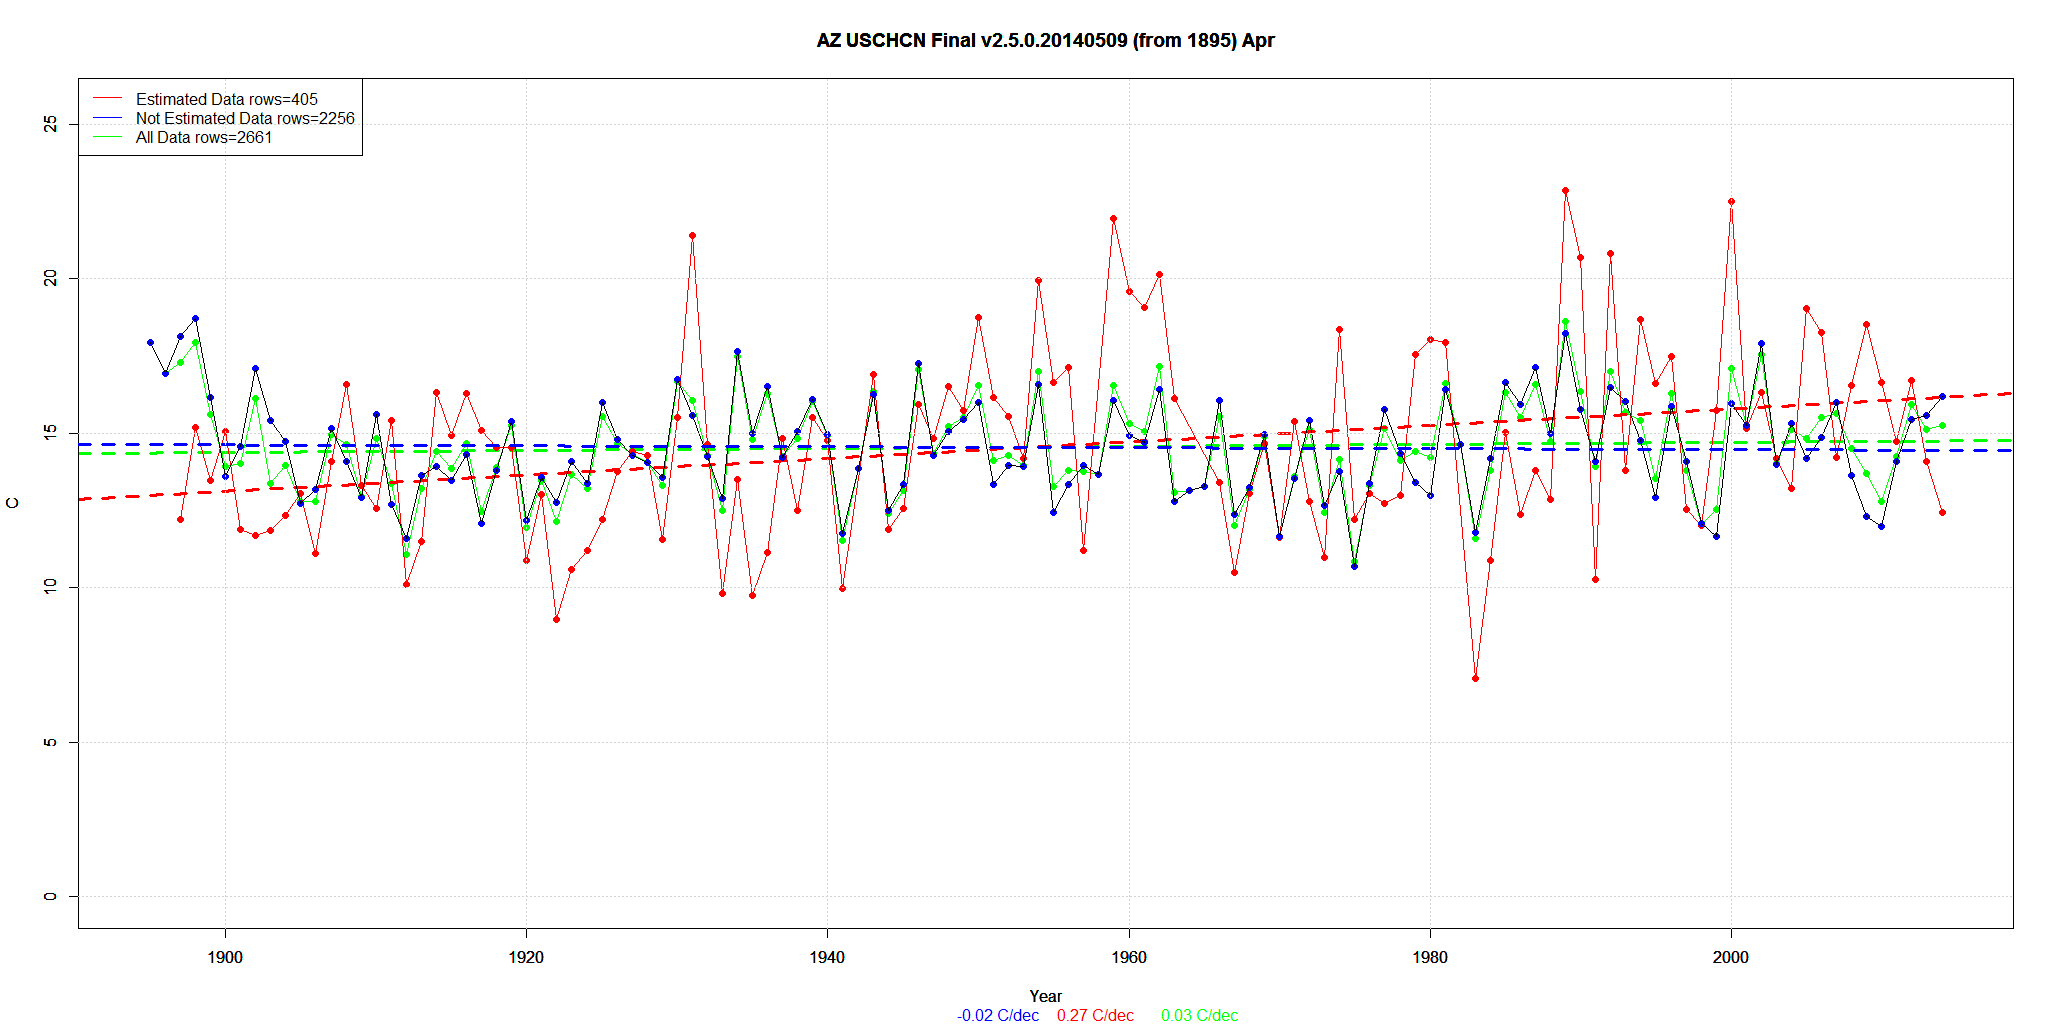
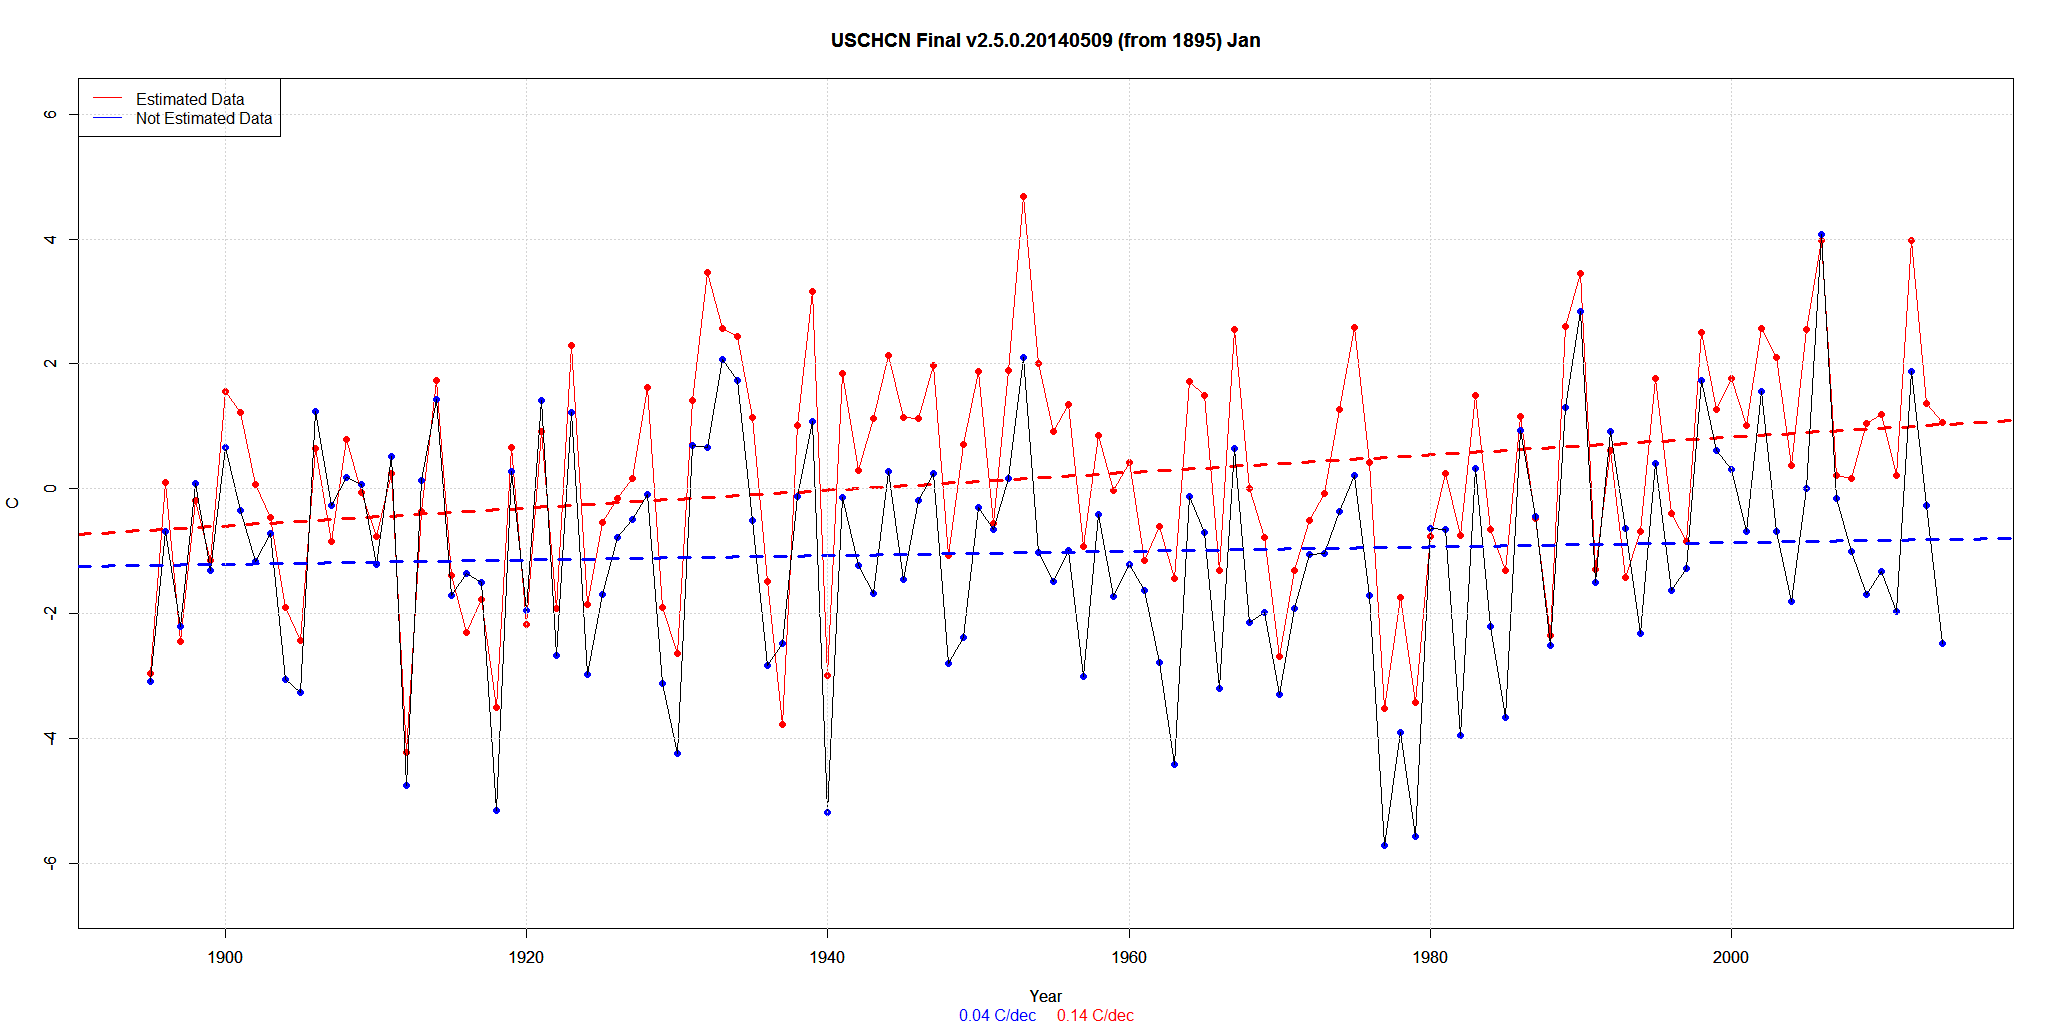
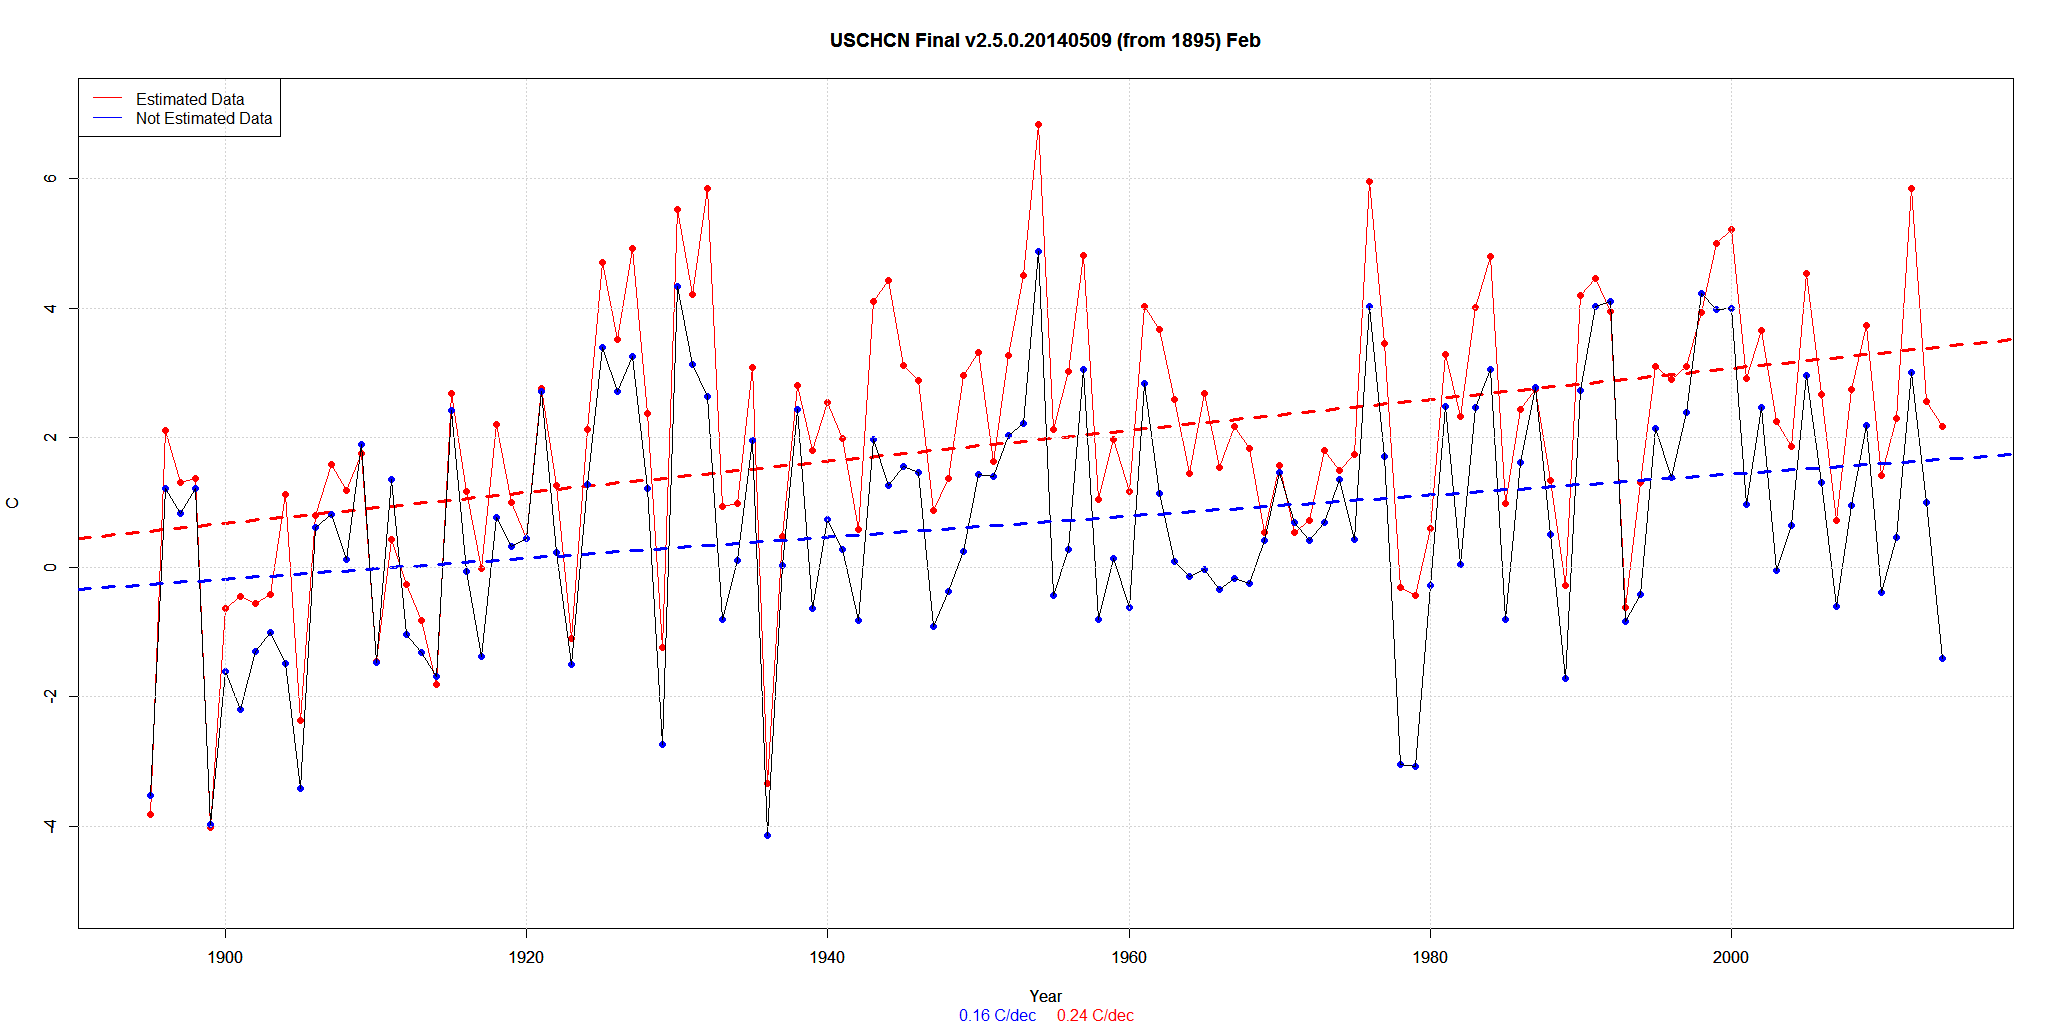
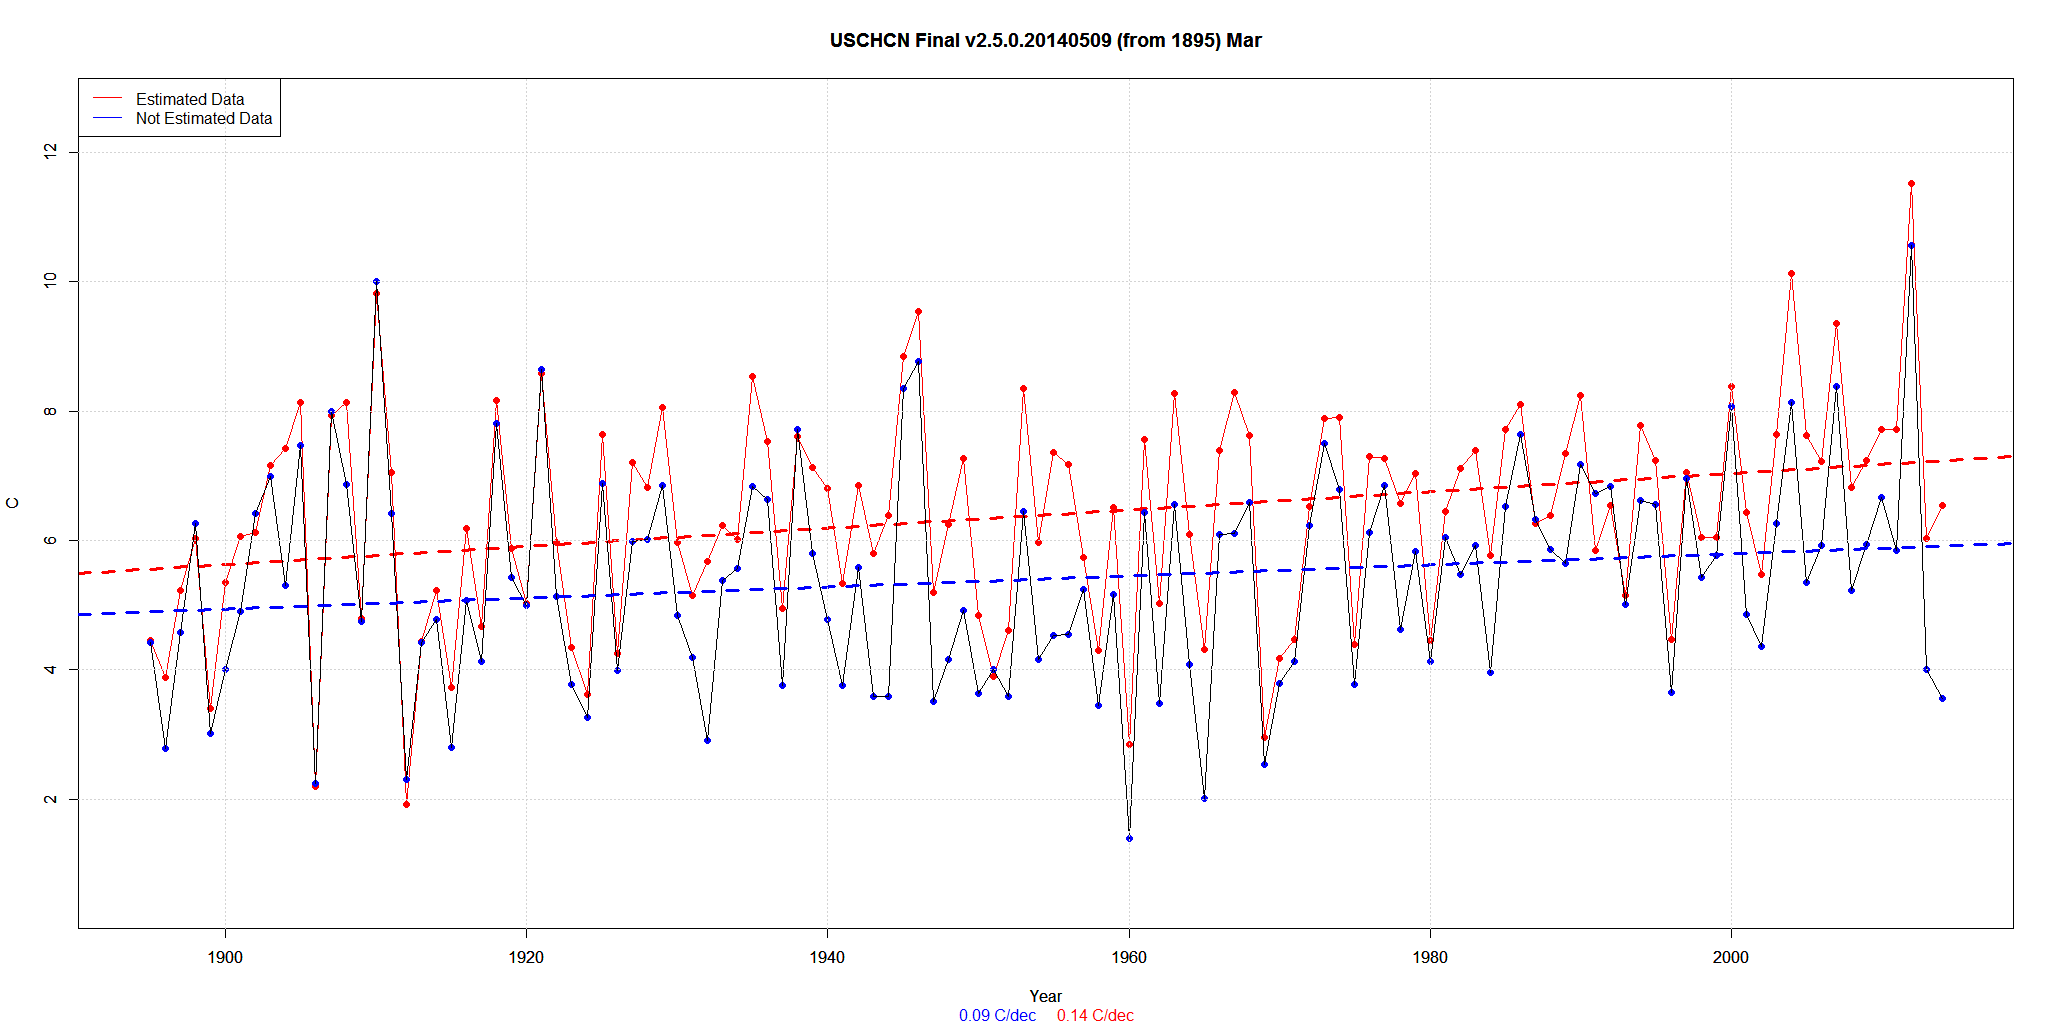
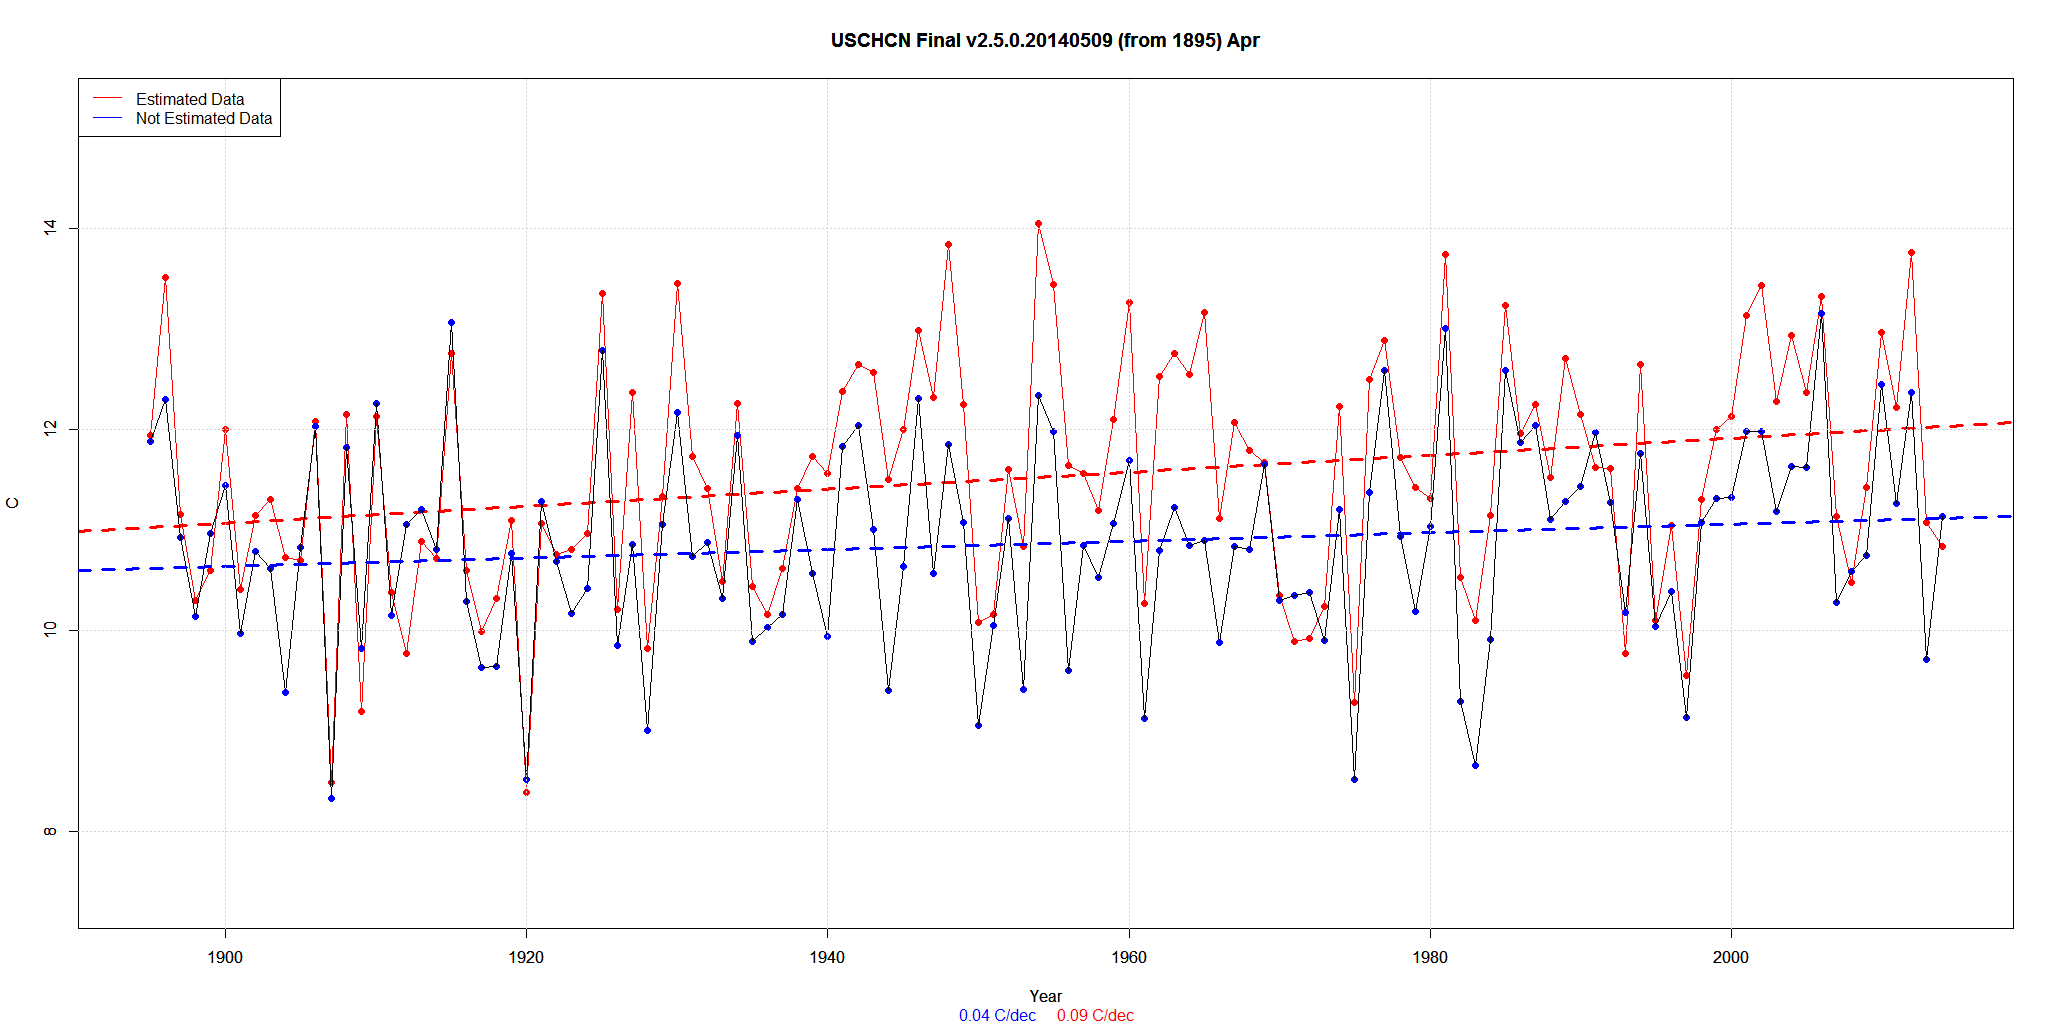
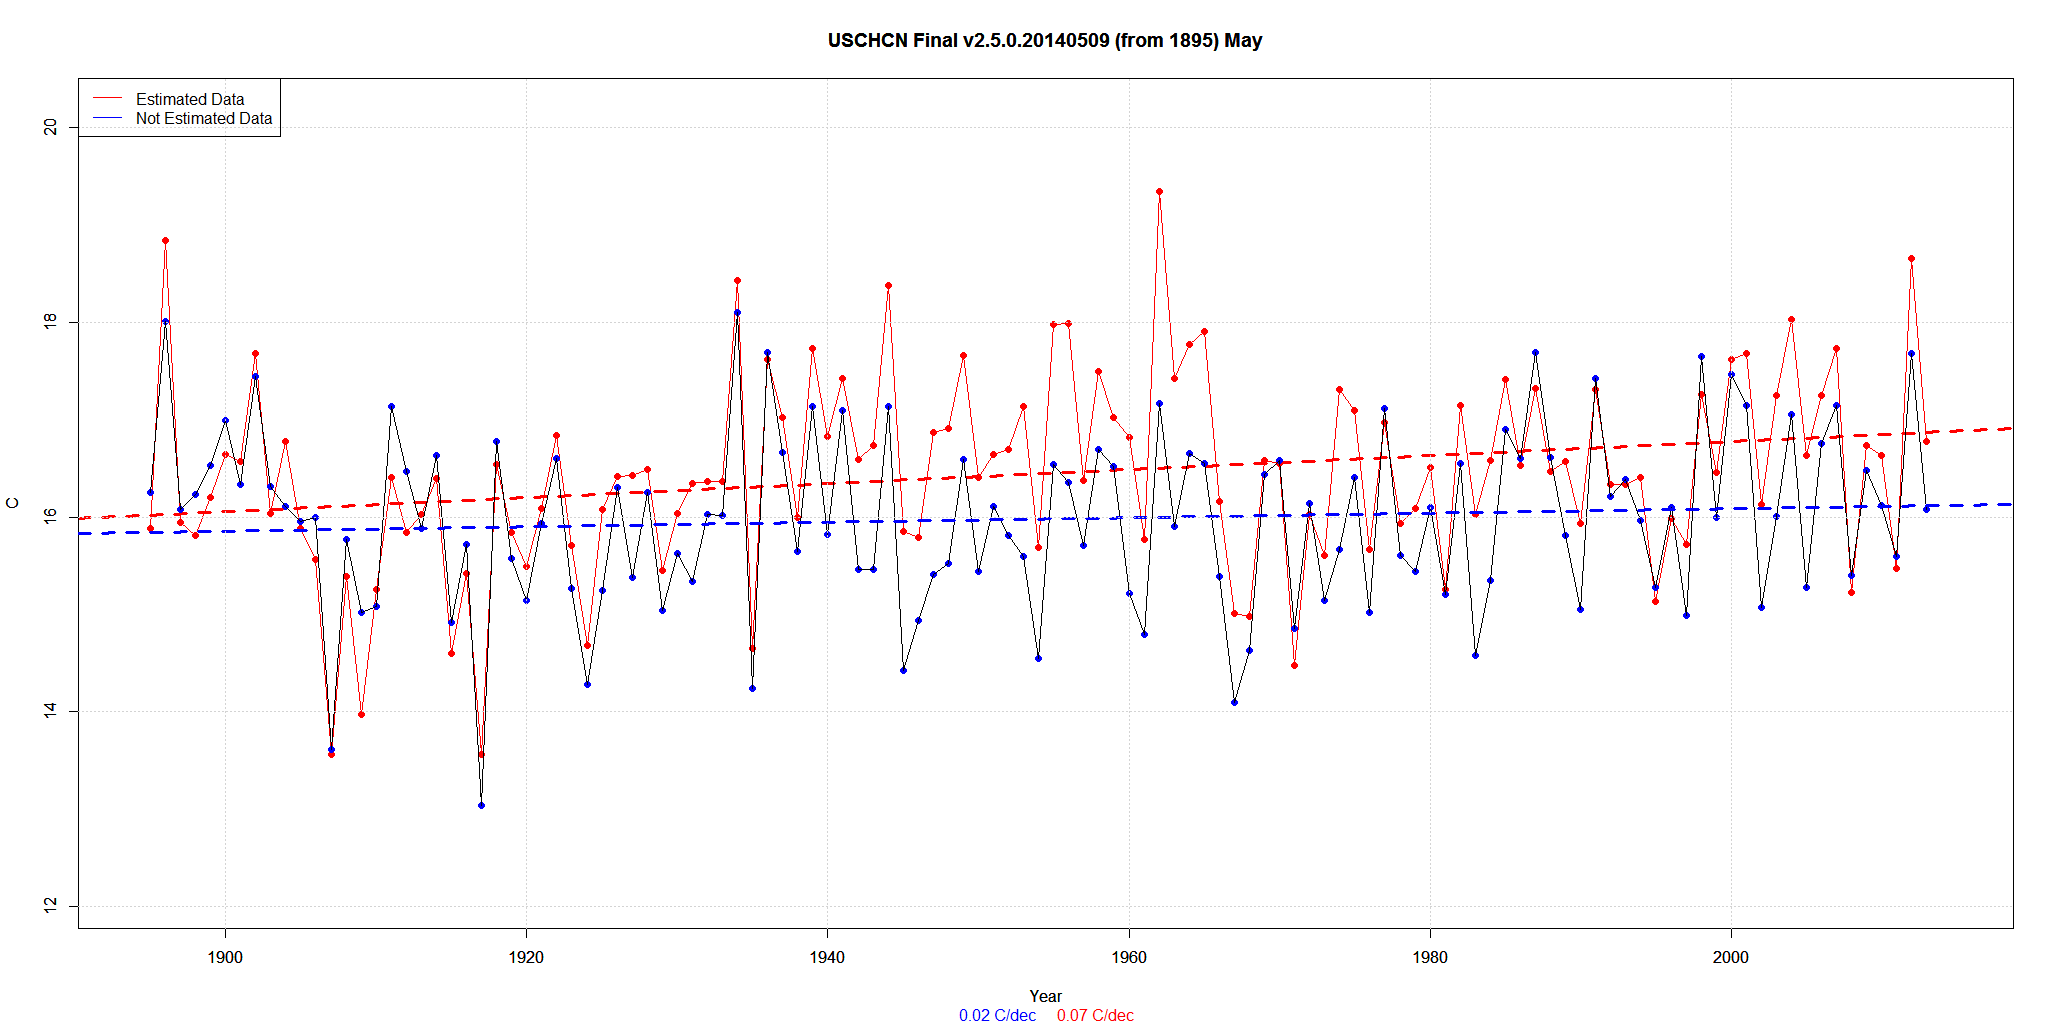
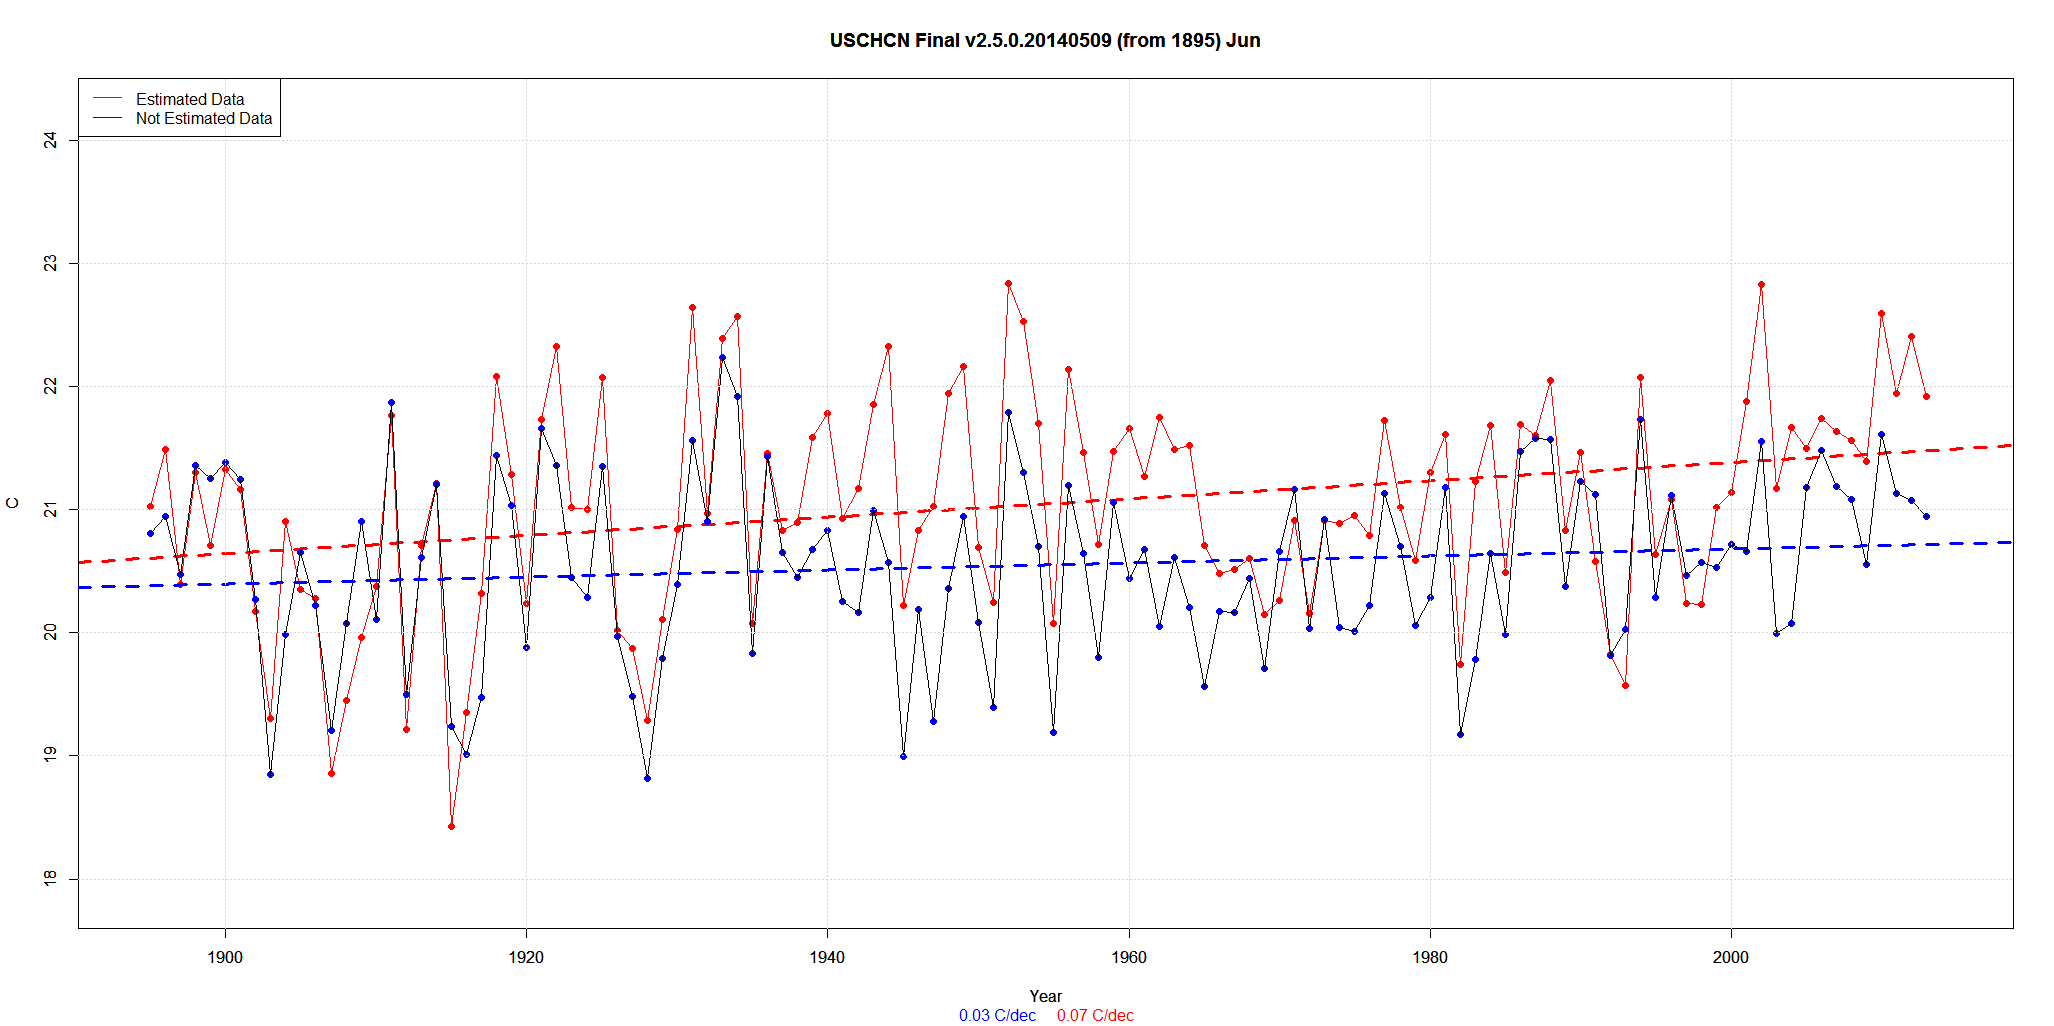
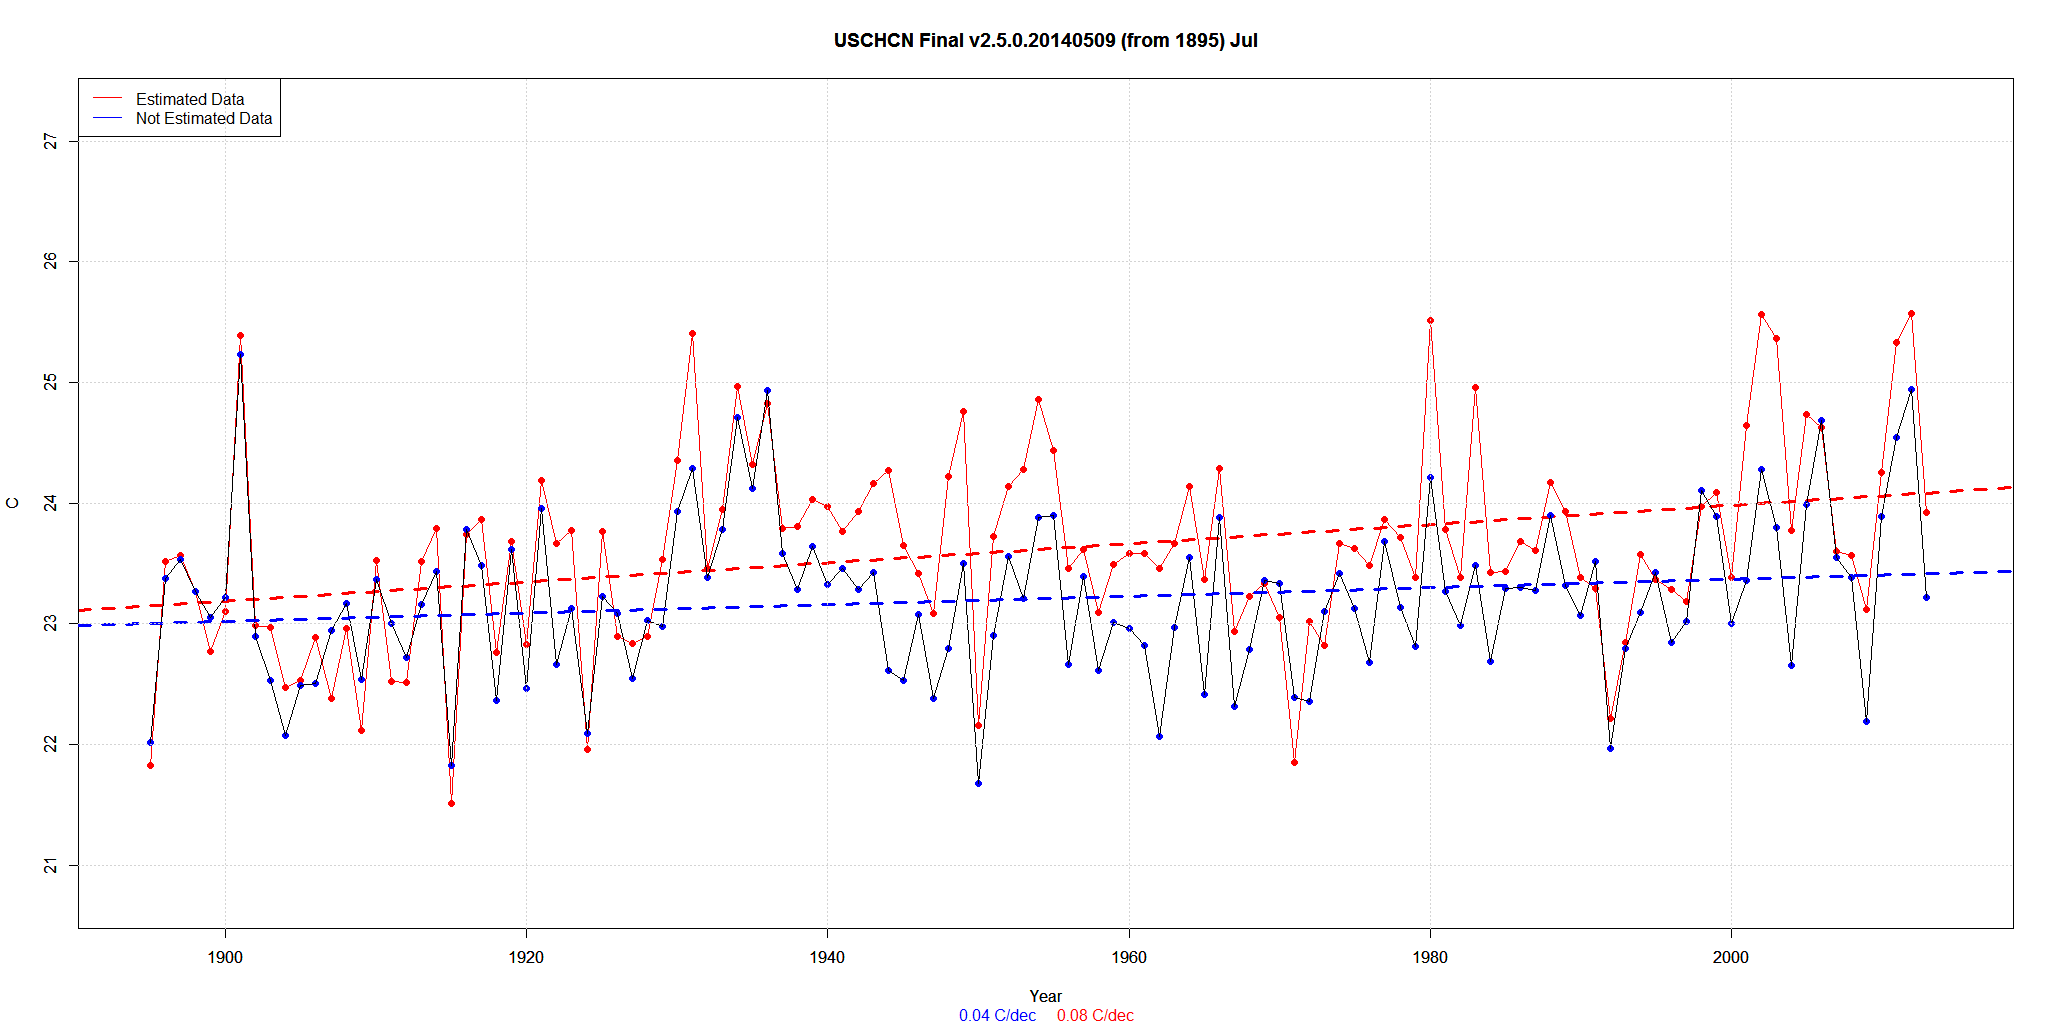
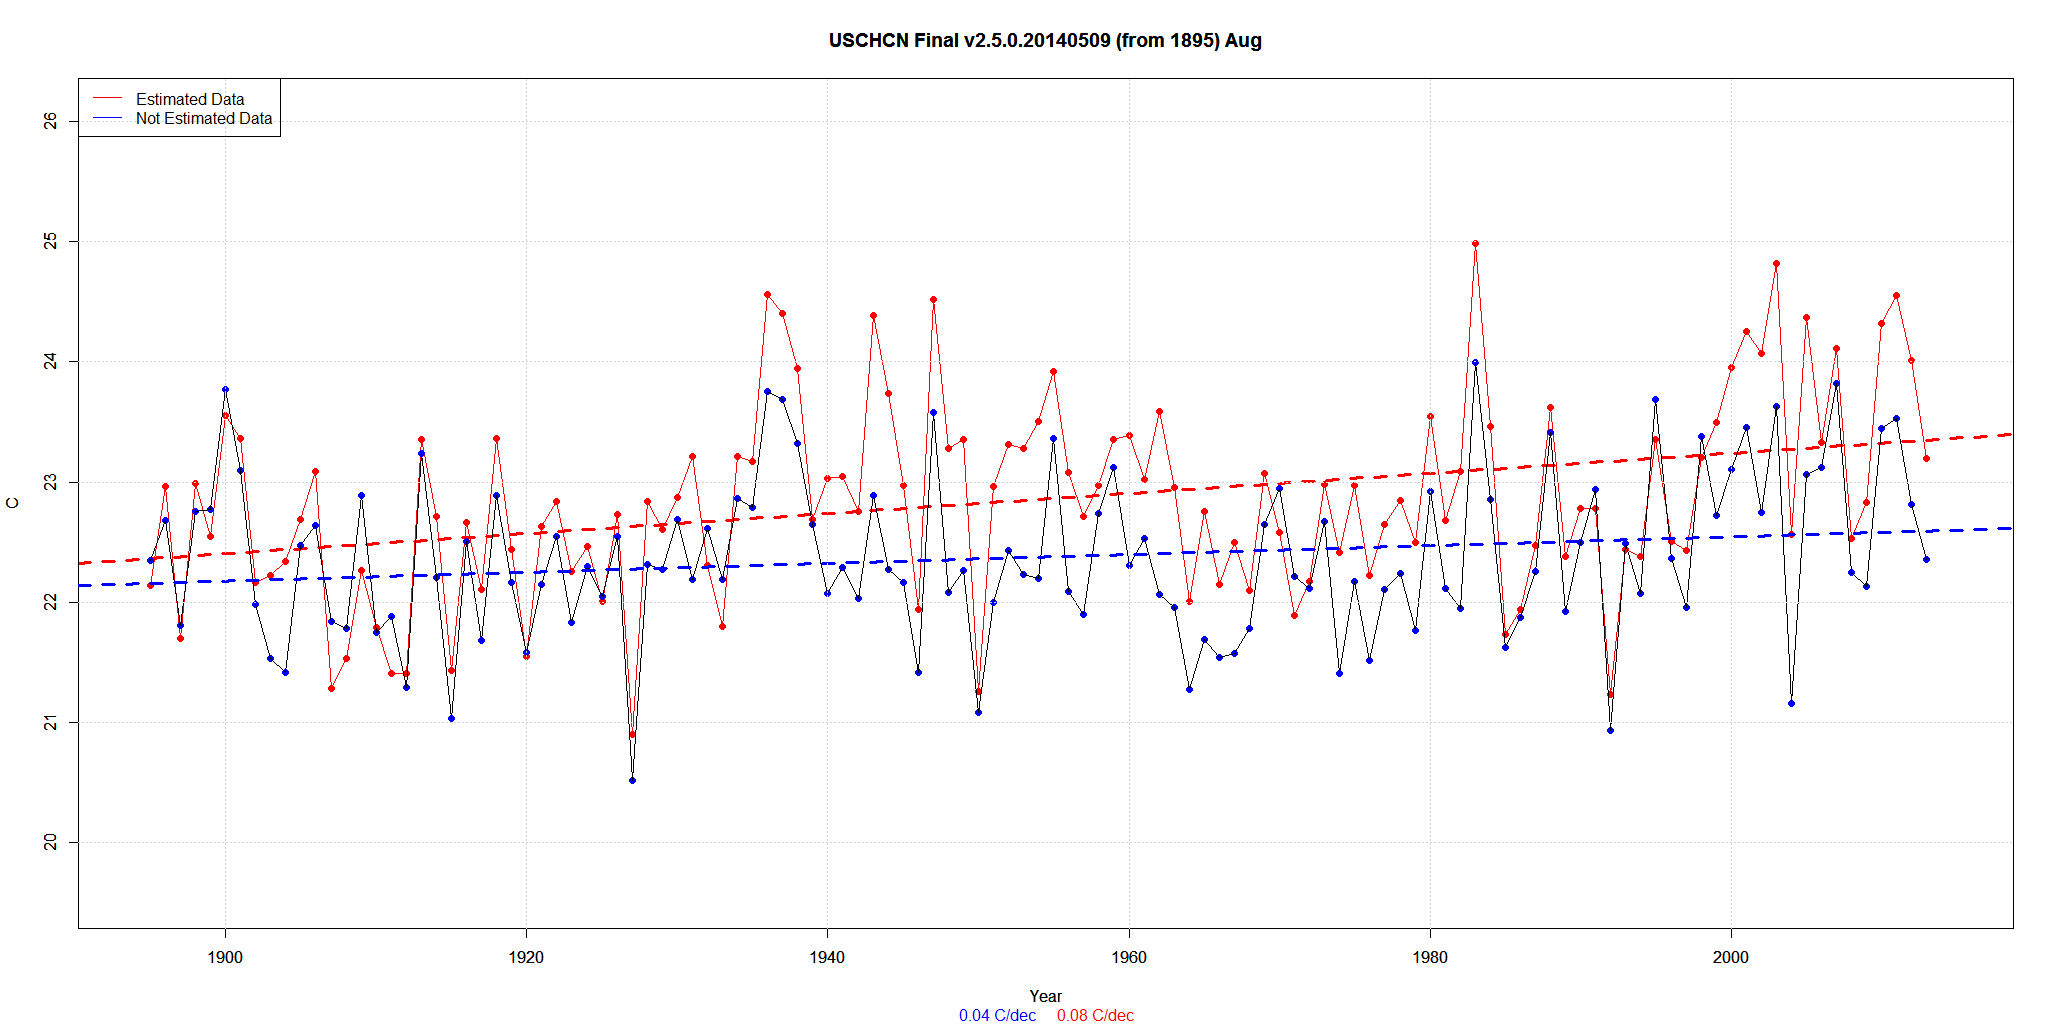
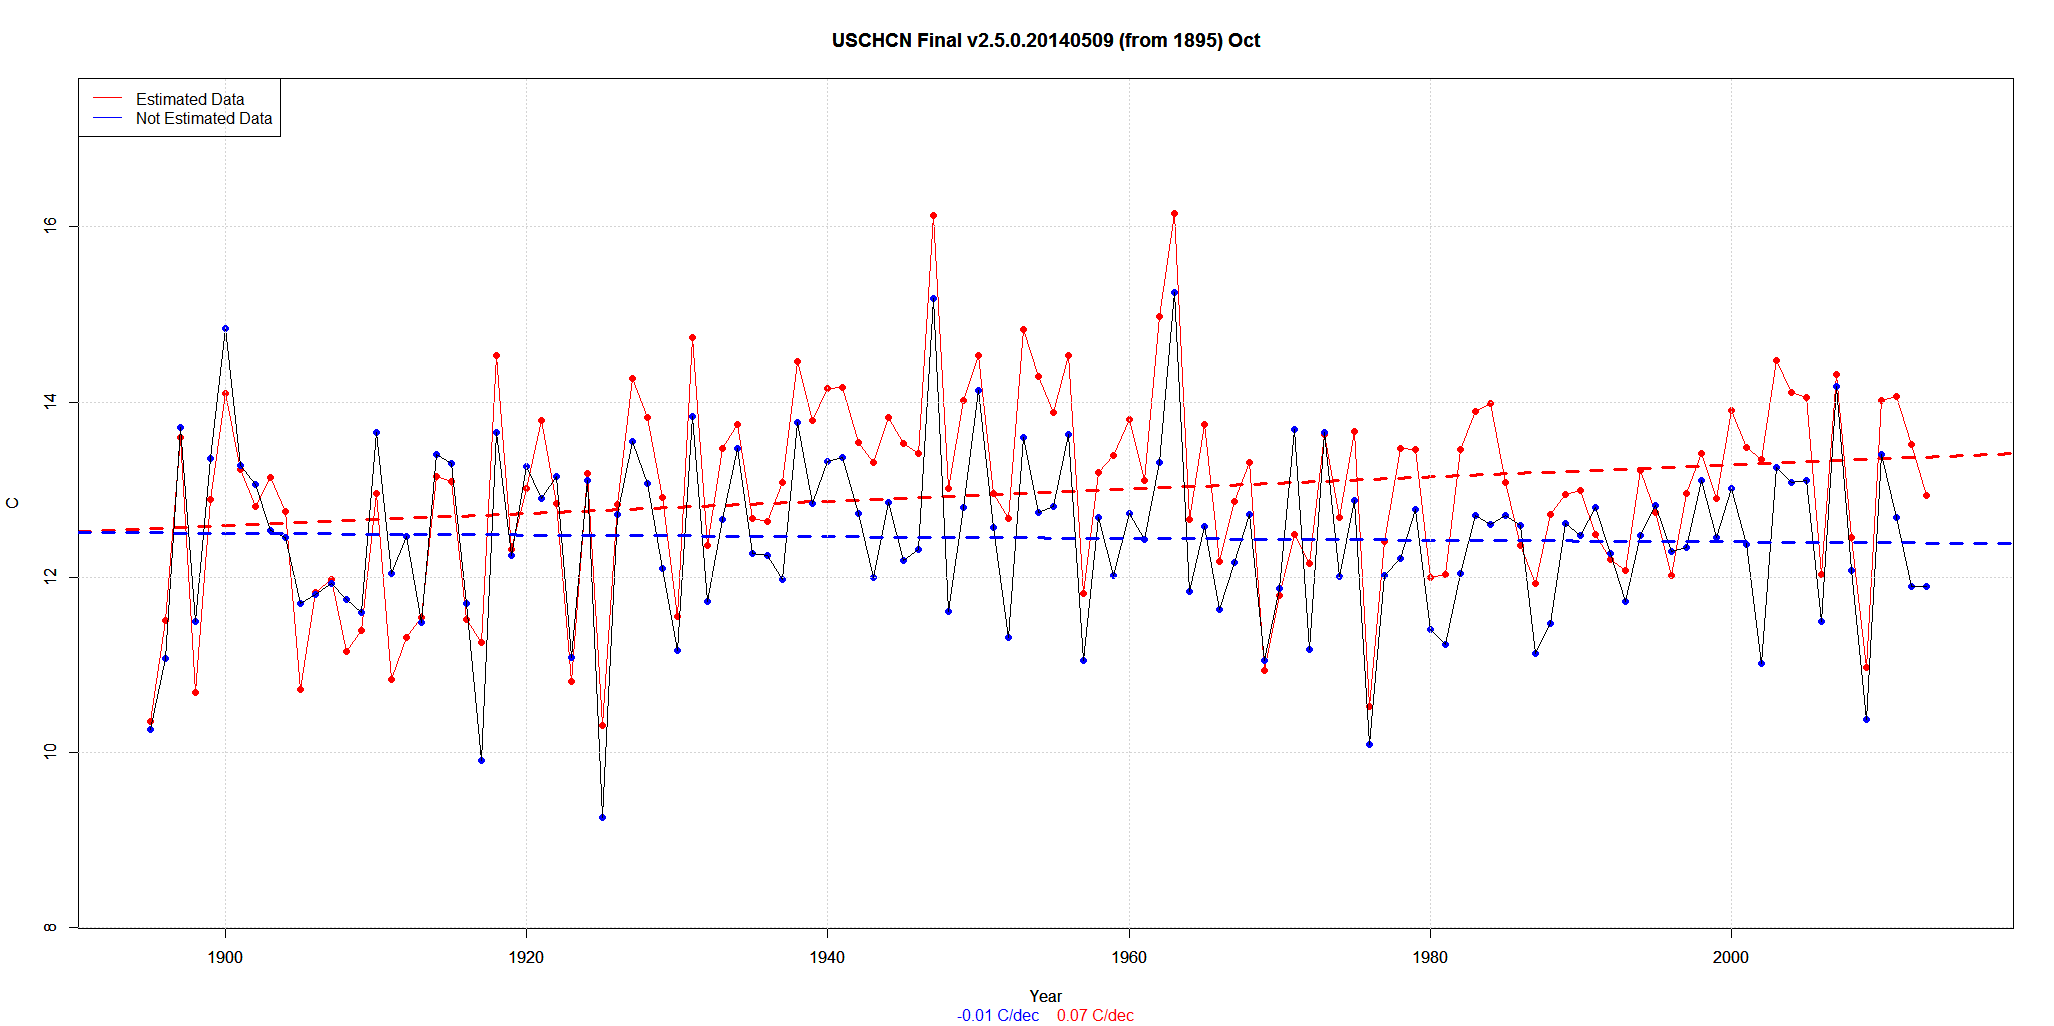
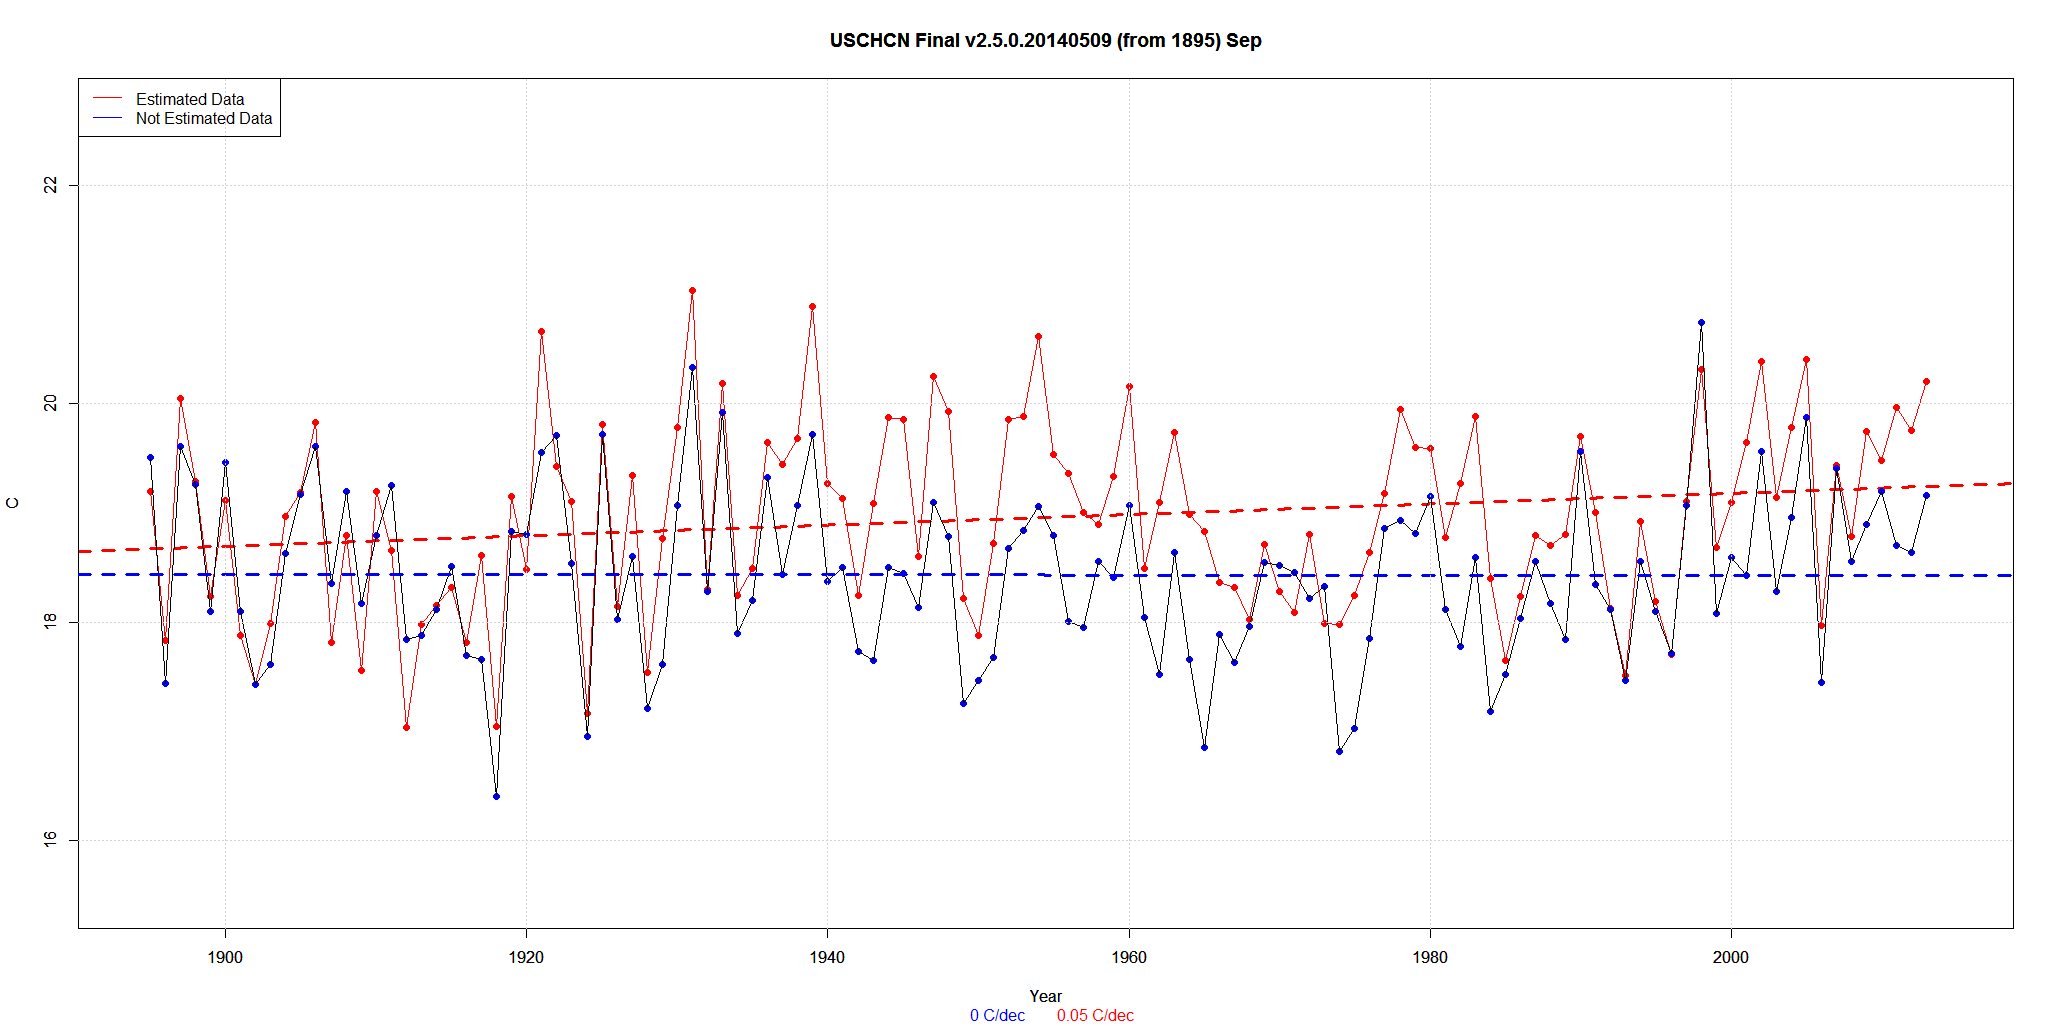
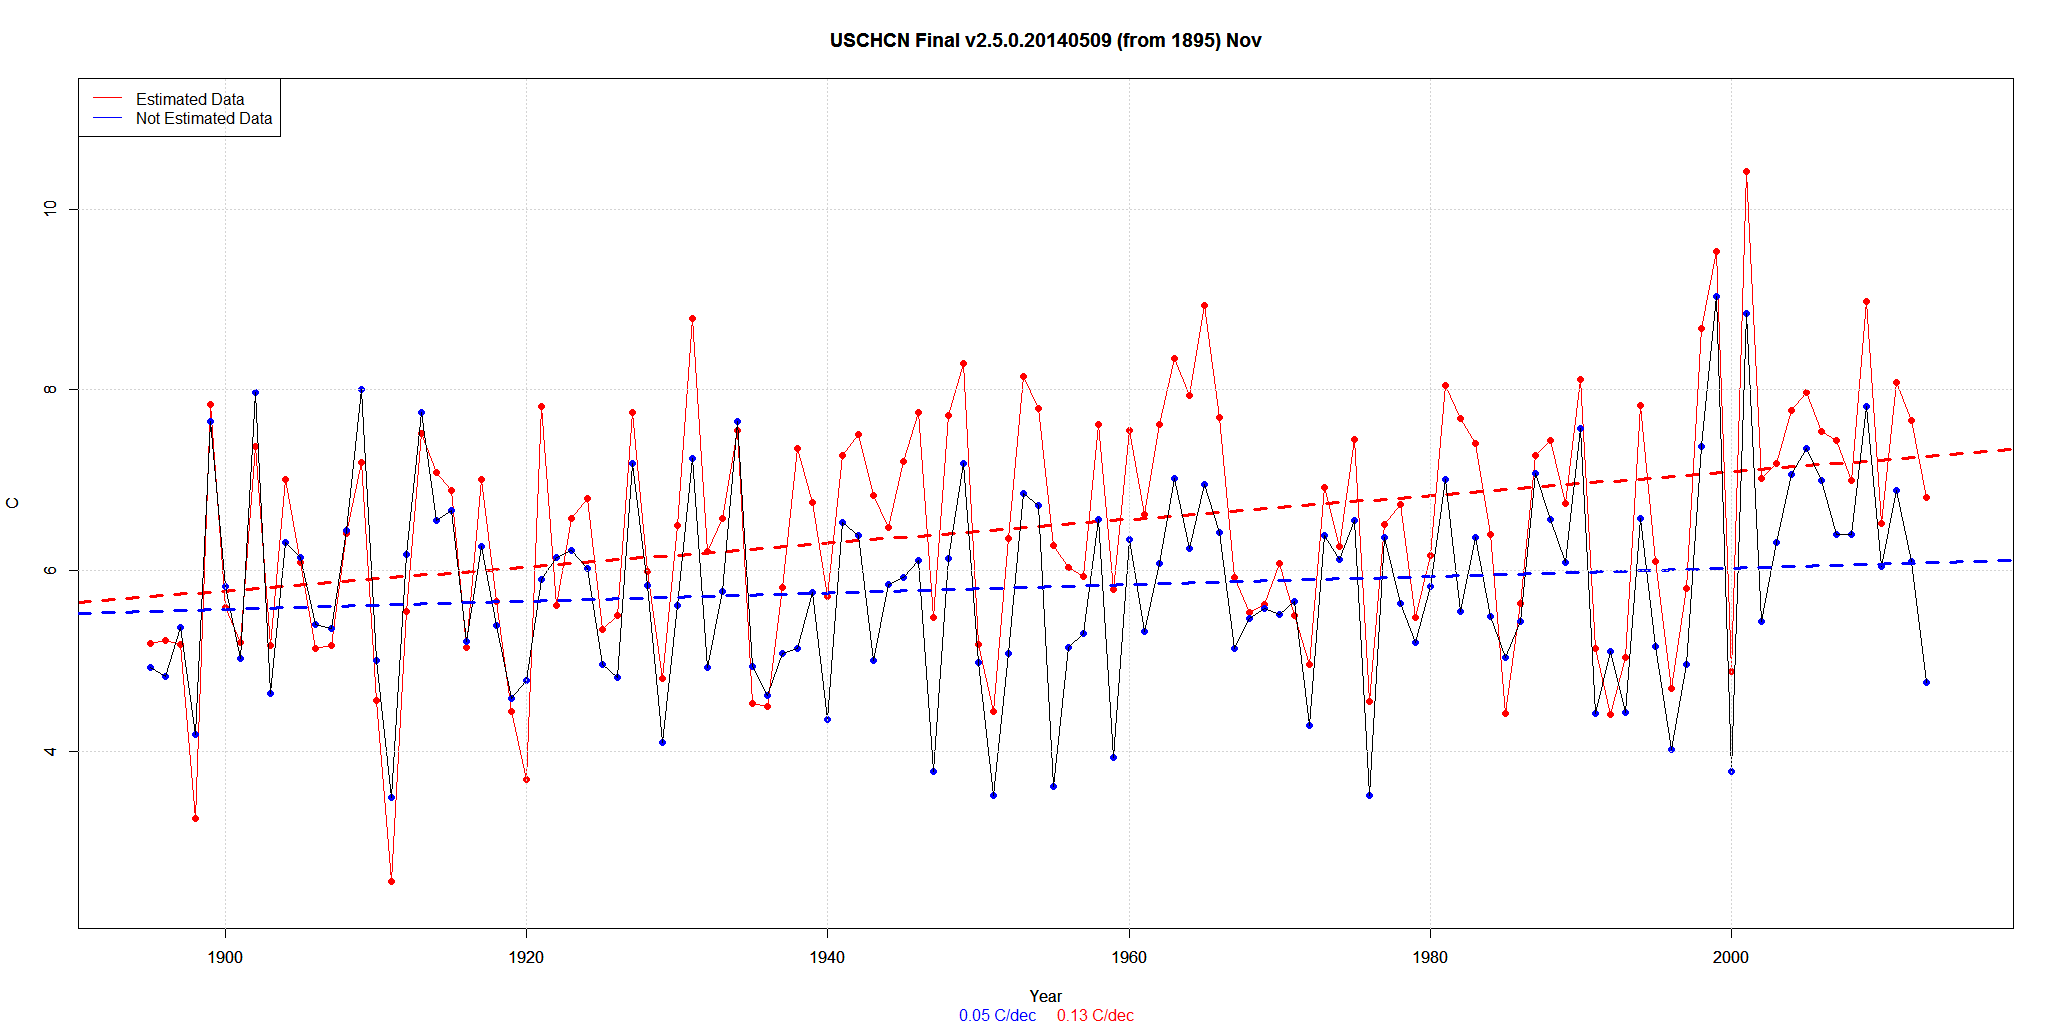
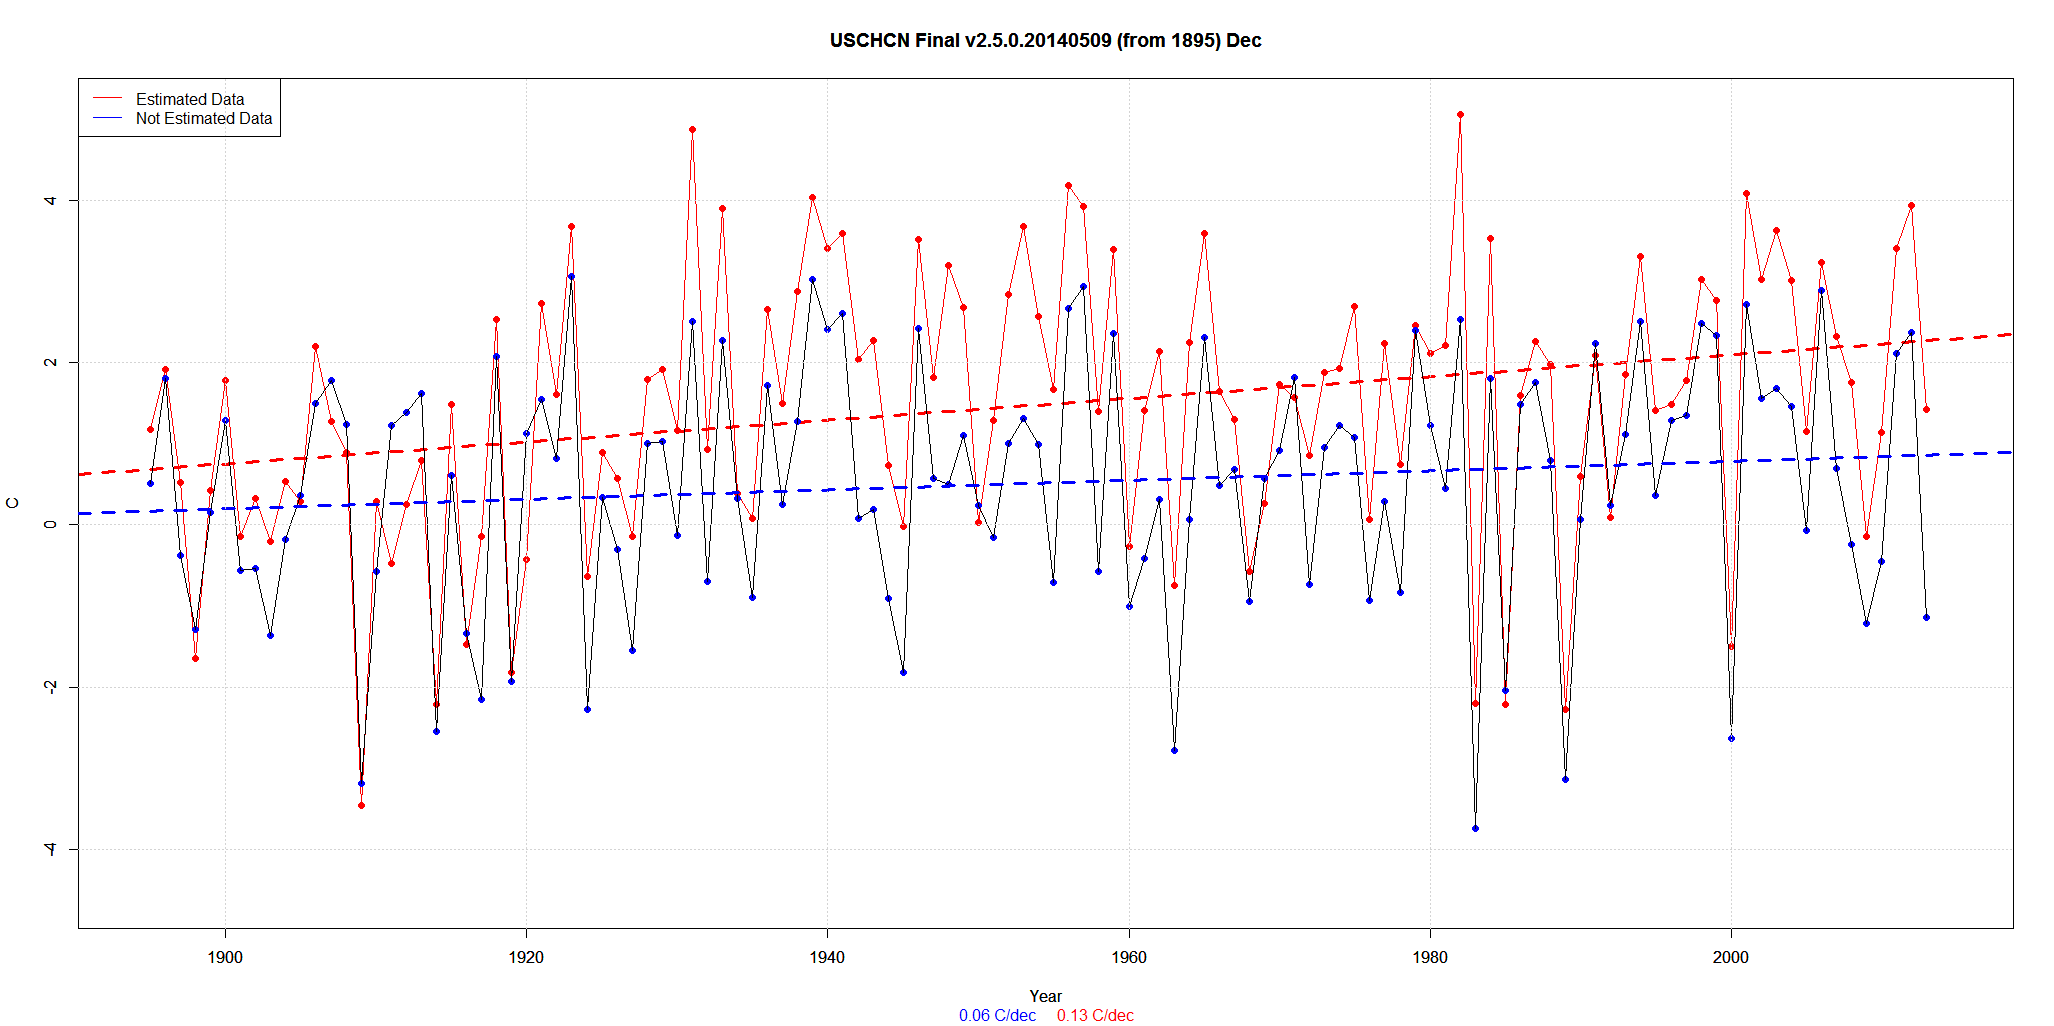
Today I have taken the Final data from 1895 to 2013 and am comparing the average for each month Estimated to Real in Celsius.
As you can see, in all cases the Estimated data is warmer. What a shock! (Not really).
| Month | Estimated | Real | Estimated minus Real |
| Jan | 0.17 | -1.02 | 1.19 |
| Feb | 1.95 | 0.8 | 1.15 |
| Mar | 6.39 | 5.42 | 0.97 |
| Apr | 11.53 | 10.85 | 0.68 |
| May | 16.45 | 15.96 | 0.49 |
| Jun | 21.05 | 20.54 | 0.51 |
| Jul | 23.61 | 23.21 | 0.4 |
| Aug | 22.86 | 22.37 | 0.49 |
| Sep | 18.94 | 18.42 | 0.52 |
| Oct | 12.97 | 12.45 | 0.52 |
| Nov | 6.5 | 5.82 | 0.68 |
| Dec | 1.5 | 0.54 | 0.96 |
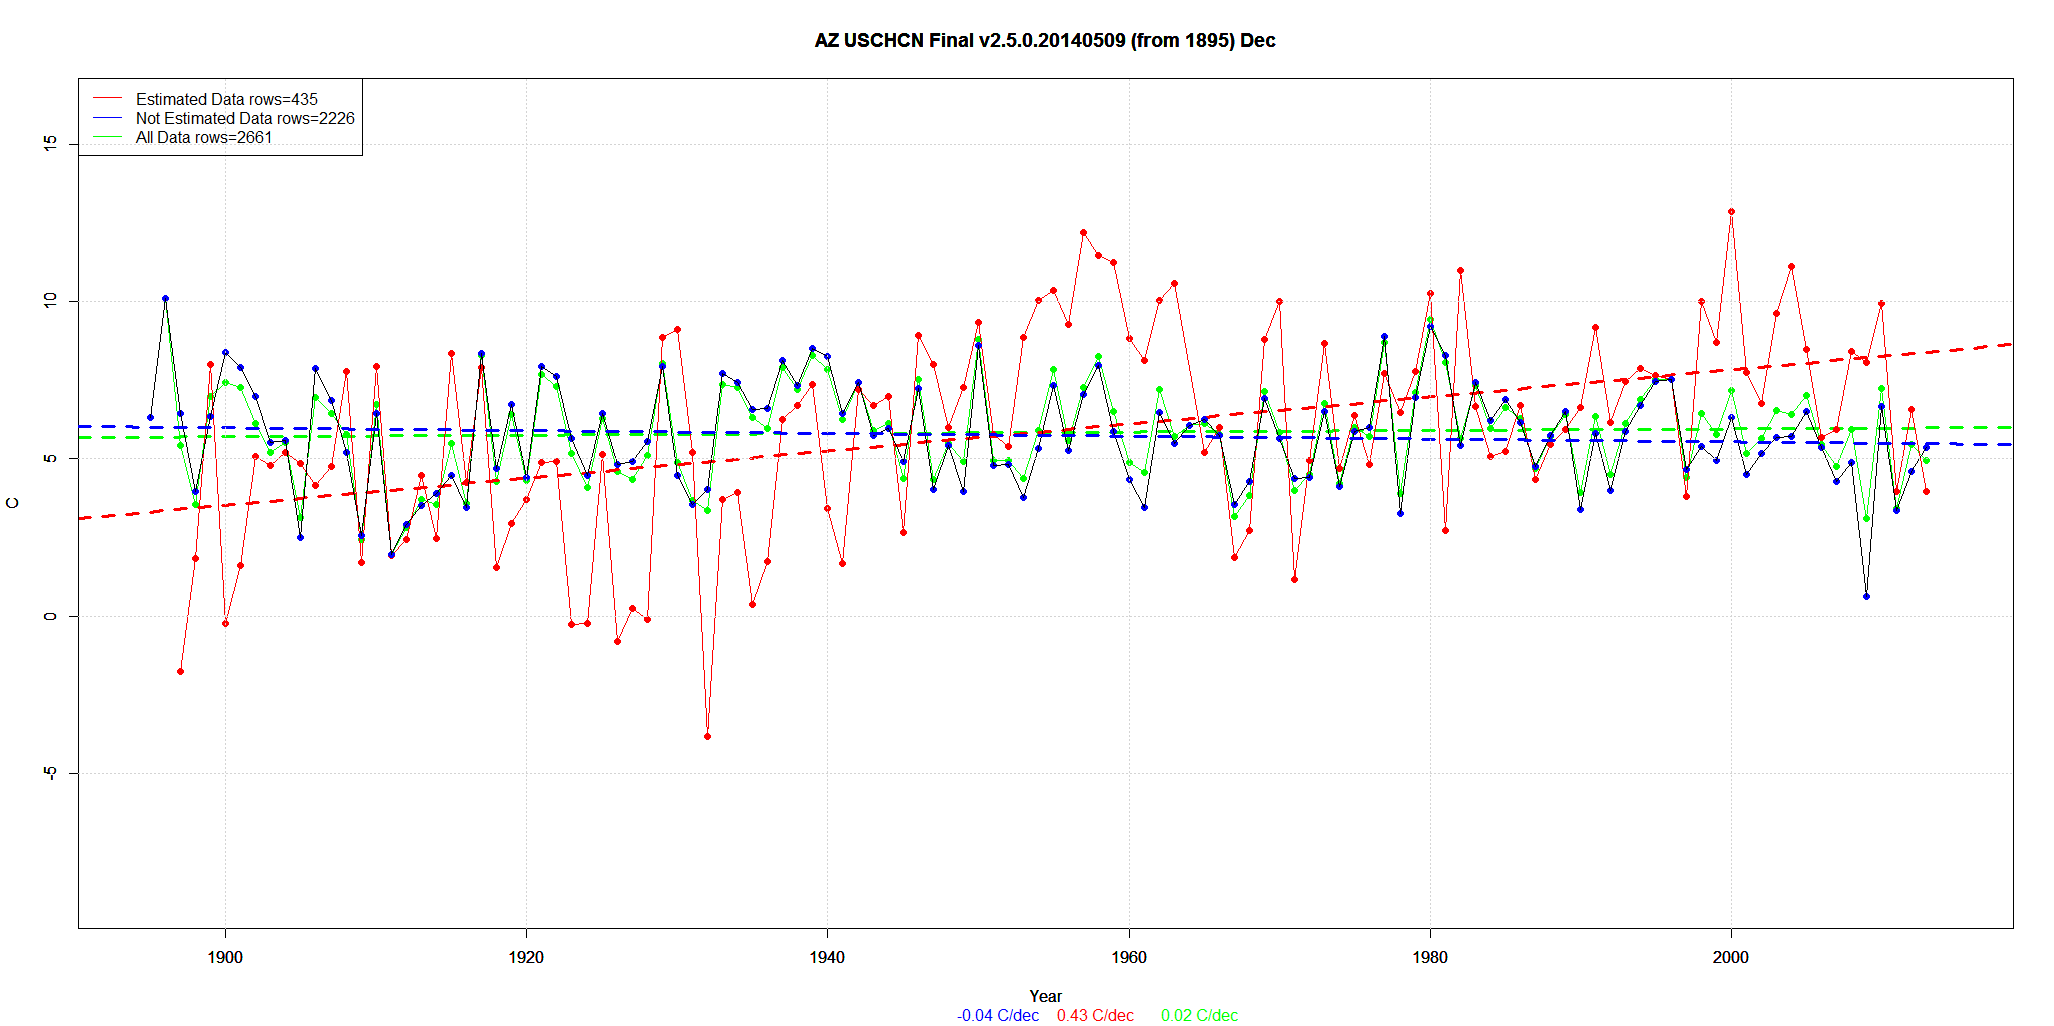
The next table is just the difference for each year and month. If Estimated is larger than Real, then the color will be red, otherwise blue. If the difference is more than 1 or -1, then bold will emphasize.
Red means the Estimated data is hotter than the non-estimated for that year and month.
Blue is much rarer than red. And bold blue is very rare indeed.
| Year | Jan | Feb | Mar | Apr | May | Jun | Jul | Aug | Sep | Oct | Nov | Dec |
| 1895 | 0.12 | -0.29 | 0.04 | 0.06 | -0.38 | 0.22 | -0.2 | -0.21 | -0.31 | 0.09 | 0.26 | 0.67 |
| 1896 | 0.78 | 0.9 | 1.08 | 1.21 | 0.84 | 0.54 | 0.15 | 0.29 | 0.39 | 0.43 | 0.4 | 0.1 |
| 1897 | -0.24 | 0.48 | 0.66 | 0.23 | -0.14 | -0.07 | 0.03 | -0.11 | 0.44 | -0.11 | -0.19 | 0.9 |
| 1898 | -0.27 | 0.16 | -0.24 | 0.16 | -0.41 | -0.05 | 0 | 0.23 | 0.03 | -0.82 | -0.93 | -0.35 |
| 1899 | 0.17 | -0.03 | 0.39 | -0.37 | -0.33 | -0.54 | -0.28 | -0.23 | 0.14 | -0.47 | 0.18 | 0.26 |
| 1900 | 0.89 | 0.97 | 1.35 | 0.56 | -0.35 | -0.05 | -0.11 | -0.22 | -0.34 | -0.74 | -0.23 | 0.48 |
| 1901 | 1.57 | 1.74 | 1.16 | 0.43 | 0.24 | -0.07 | 0.16 | 0.26 | -0.22 | -0.05 | 0.17 | 0.42 |
| 1902 | 1.25 | 0.74 | -0.3 | 0.37 | 0.25 | -0.1 | 0.09 | 0.18 | 0.01 | -0.25 | -0.6 | 0.87 |
| 1903 | 0.26 | 0.58 | 0.17 | 0.68 | -0.27 | 0.45 | 0.44 | 0.69 | 0.38 | 0.6 | 0.53 | 1.15 |
| 1904 | 1.16 | 2.62 | 2.11 | 1.34 | 0.67 | 0.92 | 0.39 | 0.92 | 0.34 | 0.29 | 0.7 | 0.72 |
| 1905 | 0.84 | 1.04 | 0.67 | -0.12 | -0.07 | -0.3 | 0.04 | 0.21 | 0.02 | -0.99 | -0.05 | -0.09 |
| 1906 | -0.59 | 0.19 | -0.05 | 0.05 | -0.43 | 0.06 | 0.39 | 0.45 | 0.22 | 0.03 | -0.27 | 0.69 |
| 1907 | -0.59 | 0.76 | -0.06 | 0.16 | -0.05 | -0.34 | -0.56 | -0.55 | -0.55 | 0.05 | -0.19 | -0.5 |
| 1908 | 0.6 | 1.07 | 1.28 | 0.34 | -0.38 | -0.63 | -0.21 | -0.25 | -0.4 | -0.58 | -0.04 | -0.34 |
| 1909 | -0.14 | -0.15 | 0.05 | -0.62 | -1.05 | -0.93 | -0.42 | -0.63 | -0.62 | -0.2 | -0.81 | -0.28 |
| 1910 | 0.45 | 0.01 | -0.19 | -0.14 | 0.18 | 0.26 | 0.16 | 0.04 | 0.41 | -0.71 | -0.45 | 0.86 |
| 1911 | -0.29 | -0.92 | 0.64 | 0.23 | -0.73 | -0.1 | -0.48 | -0.48 | -0.59 | -1.21 | -0.93 | -1.71 |
| 1912 | 0.52 | 0.77 | -0.39 | -1.29 | -0.63 | -0.29 | -0.21 | 0.11 | -0.8 | -1.14 | -0.63 | -1.13 |
| 1913 | -0.49 | 0.49 | 0.01 | -0.33 | 0.13 | 0.1 | 0.35 | 0.11 | 0.11 | 0.05 | -0.23 | -0.81 |
| 1914 | 0.3 | -0.11 | 0.46 | -0.09 | -0.24 | 0.02 | 0.35 | 0.51 | 0.03 | -0.25 | 0.53 | 0.33 |
| 1915 | 0.32 | 0.27 | 0.92 | -0.3 | -0.32 | -0.81 | -0.32 | 0.4 | -0.19 | -0.2 | 0.21 | 0.87 |
| 1916 | -0.95 | 1.24 | 1.12 | 0.31 | -0.29 | 0.34 | -0.04 | 0.15 | 0.11 | -0.18 | -0.07 | -0.13 |
| 1917 | -0.26 | 1.36 | 0.54 | 0.37 | 0.52 | 0.84 | 0.39 | 0.42 | 0.96 | 1.34 | 0.75 | 2.01 |
| 1918 | 1.65 | 1.44 | 0.36 | 0.67 | -0.23 | 0.64 | 0.4 | 0.48 | 0.65 | 0.89 | 0.26 | 0.45 |
| 1919 | 0.38 | 0.68 | 0.44 | 0.33 | 0.26 | 0.25 | 0.06 | 0.27 | 0.32 | 0.06 | -0.15 | 0.11 |
| 1920 | -0.23 | 0 | 0.04 | -0.12 | 0.35 | 0.35 | 0.36 | -0.03 | -0.31 | -0.24 | -1.1 | -1.55 |
| 1921 | -0.48 | 0.04 | -0.06 | -0.22 | 0.16 | 0.07 | 0.24 | 0.49 | 1.12 | 0.9 | 1.9 | 1.18 |
| 1922 | 0.74 | 1.04 | 0.84 | 0.06 | 0.24 | 0.96 | 1 | 0.29 | -0.28 | -0.31 | -0.52 | 0.79 |
| 1923 | 1.07 | 0.4 | 0.58 | 0.63 | 0.44 | 0.57 | 0.64 | 0.43 | 0.57 | -0.28 | 0.35 | 0.61 |
| 1924 | 1.11 | 0.85 | 0.35 | 0.55 | 0.4 | 0.72 | -0.13 | 0.17 | 0.21 | 0.08 | 0.78 | 1.65 |
| 1925 | 1.15 | 1.3 | 0.76 | 0.57 | 0.84 | 0.72 | 0.54 | -0.03 | 0.1 | 1.05 | 0.39 | 0.56 |
| 1926 | 0.62 | 0.8 | 0.26 | 0.37 | 0.12 | 0.05 | -0.19 | 0.18 | 0.13 | 0.11 | 0.68 | 0.87 |
| 1927 | 0.66 | 1.66 | 1.22 | 1.51 | 1.05 | 0.39 | 0.3 | 0.39 | 0.75 | 0.72 | 0.56 | 1.4 |
| 1928 | 1.72 | 1.14 | 0.81 | 0.82 | 0.23 | 0.48 | -0.13 | 0.52 | 0.33 | 0.75 | 0.16 | 0.79 |
| 1929 | 1.2 | 1.5 | 1.22 | 0.28 | 0.4 | 0.32 | 0.56 | 0.33 | 1.16 | 0.81 | 0.71 | 0.9 |
| 1930 | 1.6 | 1.2 | 1.13 | 1.28 | 0.41 | 0.44 | 0.42 | 0.18 | 0.71 | 0.38 | 0.9 | 1.29 |
| 1931 | 0.72 | 1.08 | 0.95 | 1 | 1 | 1.09 | 1.11 | 1.02 | 0.71 | 0.89 | 1.55 | 2.38 |
| 1932 | 2.79 | 3.21 | 2.77 | 0.53 | 0.34 | 0.07 | 0.08 | -0.3 | 0.02 | 0.64 | 1.28 | 1.63 |
| 1933 | 0.5 | 1.75 | 0.86 | 0.16 | 0.35 | 0.15 | 0.17 | -0.39 | 0.27 | 0.81 | 0.81 | 1.63 |
| 1934 | 0.72 | 0.89 | 0.46 | 0.32 | 0.33 | 0.65 | 0.26 | 0.35 | 0.35 | 0.27 | -0.09 | 0.07 |
| 1935 | 1.64 | 1.13 | 1.69 | 0.54 | 0.41 | 0.23 | 0.19 | 0.38 | 0.29 | 0.4 | -0.41 | 0.98 |
| 1936 | 1.35 | 0.82 | 0.89 | 0.12 | -0.08 | 0.03 | -0.12 | 0.82 | 0.31 | 0.39 | -0.11 | 0.94 |
| 1937 | -1.3 | 0.45 | 1.19 | 0.47 | 0.35 | 0.17 | 0.21 | 0.71 | 1 | 1.11 | 0.74 | 1.24 |
| 1938 | 1.14 | 0.36 | -0.11 | 0.11 | 0.35 | 0.45 | 0.52 | 0.63 | 0.61 | 0.71 | 2.21 | 1.6 |
| 1939 | 2.08 | 2.43 | 1.33 | 1.17 | 0.59 | 0.91 | 0.39 | 0.04 | 1.17 | 0.95 | 1 | 1.01 |
| 1940 | 2.19 | 1.81 | 2.04 | 1.62 | 1.01 | 0.94 | 0.65 | 0.96 | 0.9 | 0.83 | 1.36 | 1 |
| 1941 | 1.98 | 1.7 | 1.58 | 0.55 | 0.33 | 0.68 | 0.31 | 0.76 | 0.63 | 0.8 | 0.75 | 0.99 |
| 1942 | 1.53 | 1.4 | 1.28 | 0.6 | 1.13 | 1.01 | 0.65 | 0.73 | 0.52 | 0.81 | 1.12 | 1.96 |
| 1943 | 2.79 | 2.13 | 2.21 | 1.56 | 1.28 | 0.86 | 0.74 | 1.49 | 1.44 | 1.31 | 1.83 | 2.08 |
| 1944 | 1.86 | 3.17 | 2.79 | 2.1 | 1.24 | 1.75 | 1.66 | 1.47 | 1.37 | 0.97 | 0.62 | 1.64 |
| 1945 | 2.6 | 1.55 | 0.5 | 1.36 | 1.42 | 1.22 | 1.12 | 0.81 | 1.41 | 1.34 | 1.29 | 1.8 |
| 1946 | 1.31 | 1.42 | 0.78 | 0.69 | 0.85 | 0.64 | 0.35 | 0.53 | 0.46 | 1.09 | 1.63 | 1.11 |
| 1947 | 1.74 | 1.8 | 1.67 | 1.74 | 1.46 | 1.74 | 0.69 | 0.94 | 1.15 | 0.95 | 1.7 | 1.24 |
| 1948 | 1.74 | 1.75 | 2.07 | 1.99 | 1.39 | 1.58 | 1.42 | 1.2 | 1.15 | 1.41 | 1.58 | 2.71 |
| 1949 | 3.09 | 2.72 | 2.35 | 1.18 | 1.07 | 1.23 | 1.26 | 1.09 | 0.95 | 1.21 | 1.12 | 1.58 |
| 1950 | 2.17 | 1.89 | 1.21 | 1.02 | 0.96 | 0.61 | 0.48 | 0.18 | 0.42 | 0.39 | 0.19 | -0.22 |
| 1951 | 0.1 | 0.24 | -0.1 | 0.11 | 0.53 | 0.86 | 0.83 | 0.98 | 1.05 | 0.39 | 0.94 | 1.45 |
| 1952 | 1.74 | 1.23 | 1.03 | 0.49 | 0.87 | 1.05 | 0.57 | 0.88 | 1.18 | 1.36 | 1.27 | 1.84 |
| 1953 | 2.57 | 2.28 | 1.89 | 1.42 | 1.54 | 1.23 | 1.07 | 1.05 | 1.05 | 1.23 | 1.3 | 2.37 |
| 1954 | 3.03 | 1.96 | 1.8 | 1.71 | 1.14 | 1 | 0.98 | 1.3 | 1.56 | 1.55 | 1.07 | 1.56 |
| 1955 | 2.4 | 2.56 | 2.84 | 1.47 | 1.44 | 0.89 | 0.53 | 0.56 | 0.73 | 1.07 | 2.66 | 2.38 |
| 1956 | 2.34 | 2.75 | 2.63 | 2.04 | 1.64 | 0.94 | 0.8 | 0.99 | 1.35 | 0.9 | 0.89 | 1.51 |
| 1957 | 2.08 | 1.76 | 0.49 | 0.71 | 0.67 | 0.82 | 0.23 | 0.81 | 1.06 | 0.76 | 0.64 | 0.99 |
| 1958 | 1.26 | 1.86 | 0.85 | 0.66 | 0.8 | 0.91 | 0.49 | 0.23 | 0.34 | 0.51 | 1.05 | 1.97 |
| 1959 | 1.71 | 1.83 | 1.35 | 1.03 | 0.5 | 0.41 | 0.48 | 0.23 | 0.93 | 1.37 | 1.87 | 1.03 |
| 1960 | 1.63 | 1.78 | 1.47 | 1.58 | 1.6 | 1.22 | 0.62 | 1.09 | 1.09 | 1.07 | 1.2 | 0.73 |
| 1961 | 0.49 | 1.19 | 1.12 | 1.15 | 0.97 | 0.6 | 0.76 | 0.49 | 0.44 | 0.66 | 1.3 | 1.82 |
| 1962 | 2.18 | 2.52 | 1.54 | 1.73 | 2.17 | 1.69 | 1.39 | 1.52 | 1.58 | 1.67 | 1.54 | 1.83 |
| 1963 | 2.97 | 2.51 | 1.71 | 1.53 | 1.51 | 0.88 | 0.69 | 0.99 | 1.1 | 0.9 | 1.32 | 2.04 |
| 1964 | 1.83 | 1.6 | 2 | 1.69 | 1.12 | 1.32 | 0.59 | 0.73 | 1.34 | 0.82 | 1.69 | 2.19 |
| 1965 | 2.19 | 2.71 | 2.31 | 2.27 | 1.35 | 1.15 | 0.95 | 1.06 | 1.98 | 1.16 | 1.98 | 1.28 |
| 1966 | 1.9 | 1.88 | 1.31 | 1.23 | 0.77 | 0.31 | 0.4 | 0.6 | 0.48 | 0.55 | 1.27 | 1.16 |
| 1967 | 1.9 | 2.34 | 2.17 | 1.23 | 0.92 | 0.35 | 0.62 | 0.92 | 0.69 | 0.7 | 0.78 | 0.62 |
| 1968 | 2.15 | 2.09 | 1.05 | 0.98 | 0.35 | 0.16 | 0.44 | 0.32 | 0.07 | 0.59 | 0.06 | 0.38 |
| 1969 | 1.2 | 0.12 | 0.42 | 0.02 | 0.14 | 0.44 | -0.02 | 0.43 | 0.16 | -0.12 | 0.04 | -0.31 |
| 1970 | 0.61 | 0.1 | 0.39 | 0.06 | -0.03 | -0.4 | -0.28 | -0.37 | -0.24 | -0.07 | 0.57 | 0.81 |
| 1971 | 0.61 | -0.16 | 0.34 | -0.45 | -0.37 | -0.25 | -0.54 | -0.32 | -0.37 | -1.2 | -0.15 | -0.25 |
| 1972 | 0.54 | 0.3 | 0.29 | -0.46 | -0.11 | 0.12 | 0.66 | 0.05 | 0.6 | 0.97 | 0.67 | 1.59 |
| 1973 | 0.97 | 1.11 | 0.38 | 0.35 | 0.47 | -0.01 | -0.28 | 0.31 | -0.33 | -0.02 | 0.53 | 0.92 |
| 1974 | 1.64 | 0.14 | 1.1 | 1.02 | 1.64 | 0.84 | 0.26 | 1 | 1.16 | 0.67 | 0.15 | 0.7 |
| 1975 | 2.37 | 1.31 | 0.6 | 0.76 | 0.69 | 0.95 | 0.51 | 0.8 | 1.21 | 0.78 | 0.9 | 1.61 |
| 1976 | 2.12 | 1.92 | 1.16 | 1.12 | 0.65 | 0.57 | 0.81 | 0.71 | 0.79 | 0.43 | 1.05 | 1 |
| 1977 | 2.2 | 1.74 | 0.42 | 0.29 | -0.14 | 0.6 | 0.18 | 0.55 | 0.32 | 0.39 | 0.14 | 1.96 |
| 1978 | 2.17 | 2.74 | 1.95 | 0.79 | 0.33 | 0.32 | 0.58 | 0.6 | 1.02 | 1.25 | 1.09 | 1.57 |
| 1979 | 2.13 | 2.65 | 1.21 | 1.24 | 0.65 | 0.53 | 0.57 | 0.73 | 0.79 | 0.68 | 0.28 | 0.05 |
| 1980 | -0.13 | 0.89 | 0.32 | 0.28 | 0.41 | 1.01 | 1.3 | 0.62 | 0.44 | 0.59 | 0.33 | 0.88 |
| 1981 | 0.91 | 0.81 | 0.4 | 0.72 | 0.05 | 0.43 | 0.51 | 0.57 | 0.67 | 0.8 | 1.03 | 1.76 |
| 1982 | 3.21 | 2.28 | 1.64 | 1.23 | 0.59 | 0.57 | 0.39 | 1.14 | 1.49 | 1.42 | 2.14 | 2.52 |
| 1983 | 1.18 | 1.55 | 1.46 | 1.44 | 1.45 | 1.44 | 1.46 | 0.99 | 1.3 | 1.18 | 1.04 | 1.53 |
| 1984 | 1.56 | 1.75 | 1.82 | 1.23 | 1.24 | 1.03 | 0.73 | 0.6 | 1.22 | 1.37 | 0.91 | 1.72 |
| 1985 | 2.37 | 1.79 | 1.2 | 0.64 | 0.51 | 0.5 | 0.14 | 0.11 | 0.13 | 0.37 | -0.62 | -0.18 |
| 1986 | 0.22 | 0.82 | 0.45 | 0.1 | -0.06 | 0.22 | 0.38 | 0.07 | 0.19 | -0.23 | 0.19 | 0.12 |
| 1987 | -0.03 | -0.03 | -0.06 | 0.21 | -0.38 | 0.02 | 0.33 | 0.21 | 0.24 | 0.8 | 0.19 | 0.5 |
| 1988 | 0.16 | 0.84 | 0.53 | 0.42 | -0.14 | 0.48 | 0.27 | 0.21 | 0.53 | 1.23 | 0.87 | 1.19 |
| 1989 | 1.3 | 1.43 | 1.7 | 1.43 | 0.76 | 0.45 | 0.61 | 0.46 | 0.96 | 0.33 | 0.65 | 0.85 |
| 1990 | 0.6 | 1.47 | 1.06 | 0.71 | 0.89 | 0.23 | 0.31 | 0.29 | 0.13 | 0.52 | 0.54 | 0.53 |
| 1991 | 0.2 | 0.43 | -0.87 | -0.35 | -0.11 | -0.55 | -0.22 | -0.15 | 0.66 | -0.31 | 0.72 | -0.14 |
| 1992 | -0.31 | -0.15 | -0.29 | 0.34 | 0.13 | 0 | 0.24 | 0.3 | 0.02 | -0.07 | -0.69 | -0.15 |
| 1993 | -0.78 | 0.22 | 0.13 | -0.41 | -0.05 | -0.46 | 0.05 | -0.06 | 0.04 | 0.34 | 0.6 | 0.75 |
| 1994 | 1.62 | 1.72 | 1.15 | 0.88 | 0.45 | 0.34 | 0.48 | 0.31 | 0.37 | 0.74 | 1.25 | 0.81 |
| 1995 | 1.36 | 0.96 | 0.67 | 0.06 | -0.14 | 0.36 | -0.05 | -0.33 | 0.09 | -0.08 | 0.94 | 1.04 |
| 1996 | 1.23 | 1.51 | 0.81 | 0.66 | -0.12 | -0.02 | 0.44 | 0.14 | -0.01 | -0.28 | 0.68 | 0.19 |
| 1997 | 0.43 | 0.7 | 0.1 | 0.42 | 0.73 | -0.22 | 0.16 | 0.47 | 0.04 | 0.61 | 0.84 | 0.44 |
| 1998 | 0.76 | -0.3 | 0.62 | 0.23 | -0.39 | -0.34 | -0.13 | -0.17 | -0.43 | 0.31 | 1.3 | 0.54 |
| 1999 | 0.65 | 1.02 | 0.27 | 0.69 | 0.46 | 0.48 | 0.2 | 0.77 | 0.6 | 0.44 | 0.49 | 0.43 |
| 2000 | 1.46 | 1.21 | 0.3 | 0.8 | 0.16 | 0.42 | 0.39 | 0.84 | 0.51 | 0.89 | 1.11 | 1.13 |
| 2001 | 1.69 | 1.95 | 1.58 | 1.16 | 0.53 | 1.21 | 1.28 | 0.81 | 1.21 | 1.1 | 1.56 | 1.36 |
| 2002 | 1 | 1.19 | 1.1 | 1.45 | 1.06 | 1.28 | 1.28 | 1.33 | 0.82 | 2.34 | 1.58 | 1.46 |
| 2003 | 2.79 | 2.3 | 1.38 | 1.1 | 1.24 | 1.19 | 1.57 | 1.19 | 0.86 | 1.23 | 0.87 | 1.95 |
| 2004 | 2.17 | 1.21 | 2 | 1.3 | 0.97 | 1.6 | 1.12 | 1.4 | 0.83 | 1.03 | 0.71 | 1.55 |
| 2005 | 2.55 | 1.57 | 2.26 | 0.74 | 1.36 | 0.32 | 0.74 | 1.3 | 0.52 | 0.95 | 0.61 | 1.22 |
| 2006 | -0.1 | 1.36 | 1.29 | 0.17 | 0.5 | 0.26 | -0.05 | 0.21 | 0.52 | 0.54 | 0.54 | 0.35 |
| 2007 | 0.37 | 1.33 | 0.96 | 0.86 | 0.58 | 0.45 | 0.05 | 0.29 | 0.03 | 0.14 | 1.04 | 1.63 |
| 2008 | 1.17 | 1.8 | 1.6 | -0.1 | -0.18 | 0.48 | 0.19 | 0.28 | 0.22 | 0.37 | 0.6 | 1.99 |
| 2009 | 2.74 | 1.54 | 1.3 | 0.67 | 0.26 | 0.84 | 0.93 | 0.7 | 0.86 | 0.6 | 1.15 | 1.07 |
| 2010 | 2.51 | 1.8 | 1.06 | 0.51 | 0.51 | 0.99 | 0.36 | 0.87 | 0.28 | 0.62 | 0.47 | 1.59 |
| 2011 | 2.17 | 1.84 | 1.87 | 0.96 | -0.12 | 0.82 | 0.79 | 1.02 | 1.27 | 1.38 | 1.19 | 1.29 |
| 2012 | 2.1 | 2.83 | 0.95 | 1.39 | 0.96 | 1.33 | 0.63 | 1.2 | 1.13 | 1.63 | 1.56 | 1.56 |
| 2013 | 1.64 | 1.56 | 2.02 | 1.36 | 0.69 | 0.97 | 0.7 | 0.85 | 1.04 | 1.04 | 2.05 | 2.56 |


![cag_[ Statewide Precipitation Anomalies (accumulation between Mar 2014 and Apr 2014) ]](https://sunshinehours.net/wp-content/uploads/2014/05/cag_-statewide-precipitation-anomalies-accumulation-between-mar-2014-and-apr-2014.jpg)