10 MORE Random Canadian Tmax from 1980

A few days I published 10 randomly chosen graphs of TMAX using Environment Canada’s monthly summaries.

I picked 1980 to 2015 partly to create a round number and partly because that is sort of when AGW became noticeable.

I picked TMAX because I think TMIN’s are rising because of UHI.

The red lines indicate a warming trend. The blue a cooling trend.

Anyone see evidence of CO2 making it warm?

Here are 10 more.

Tx - BONILLA ISLAND BC - 1980 to 2015

Tx - CASTLEGAR A BC - 1980 to 2015

Tx - BRANDON A MB - 1980 to 2015

Tx - GOLDEN A BC - 1980 to 2015

Tx - KANANASKIS POCATERRA AB - 1980 to 2015

Tx - MICA DAM BC - 1980 to 2015

Tx - SWIFT CURRENT CDA SK - 1980 to 2015

Tx - FORT MCMURRAY A AB - 1980 to 2015

Tx - VANCOUVER HARBOUR CS BC - 1980 to 2015

Tx - BONILLA ISLAND BC

NASA Predicts: ‘there are no guarantees’

I was quite sure NASA knew exactly what was going to happen. Don’t they model the climate? Don’t they use those models to ask for big grants. Now they are saying that literally anything could happen. Then what use are they?

‘If past events help predict future ones, then we have probably reached the peak of the 2015–2016 El Niño,’ the space agency said.

‘Warmer-than-average waters in the eastern tropical Pacific Ocean should start to cool off and shift westward.

‘By summer, the tropical Pacific might be back in a neutral state or La Niña cooling could kick in, as it did after major El Niños of the past.

But will the ocean respond in 2016 the way it did in 1998 and 1983? Given that the planet is hotter than at any time in the past 135 years, there are no guarantees.’

Read more: http://www.dailymail.co.uk/sciencetech/article-3412610/Is-end-El-Ni-o-Nasa-say-phenomenon-start-disappear-warn-global-warming-means-happen.html

10 Random Canadian Tmax from 1980

Every once in a while I visit the data for the Canada. Earlier today I looked at the station nearest me (NANAIMO A).

But since I have the code … I thought why not look at 10 random stations that have data in 1980 and 2015.

Today I am looking at TMAX monthly data (using Environment Canada monthly summaries) for 10 random stations from 1980.

Each line of graphs is a season  – Dec/Jan/Feb …. etc.


Tx Average BEAUCEVILLE QC


Tx Average NEW GLASGOW ON


Tx Average TERRACE A BC


Tx Average WHITECOURT A AB


Tx Average AROOSTOOK NB


Tx Average BARWICK ON


Tx Average MIDLAND WATER POLLUTION CONTROL PLANT ON


Tx Average QUALICUM R FISH RESEARCH BC


Tx Average UCLUELET KENNEDY CAMP BC


Tx Average GIBSONS GOWER POINT BC


Nanaimo Tmax from 1980

Every once in a while I visit the data for the weather station closest to my hometown on the west coast of Canada.

Today I am looking at TMAX monthly data (using Environment Canada monthly summaries) for NANAIMO A from 1980.

Each line of graphs is a season  – Dec/Jan/Feb …. etc.

5 months are warming. 4 are cooling. 3 are cooling ever so slightly.

If there is a CO2 signal in there I am missing it.

Tx Average NANAIMO A


Increased carbon dioxide enhances plankton growth


CO2 is good.

“Coccolithophores–tiny calcifying plants that are part of the foundation of the marine food web–have been increasing in relative abundance in the North Atlantic over the last 45 years, as carbon input into ocean waters has increased. Their relative abundance has increased 10 times, or by an order of magnitude, during this sampling period, report researchers.”

We never expected to see the relative abundance of coccolithophores to increase 10 times in the North Atlantic over barely half a century. If anything, we expected that these sensitive calcifying algae would have decreased in the face of increasing ocean acidification (associated with increasing carbon dioxide entering the ocean from the burning of fossil-fuels). Instead, we see how these carbon-limited organisms appear to be using the extra carbon from CO2 to increase their relative abundance by an order of magnitude.

Gephyrocapsa_oceanica_color

http://www.sciencedaily.com/releases/2016/01/160116215419.htm


Thermometertree: A magic tree selected out of a forest

The big magic tree con continues. Take millions of trees and select a few that sort of match the temperature records and claim trees are magic thermometers. Never publish the data of the rejected trees. Collect grant money.


“So instead of a validation of the robustness of the data, or the robustness of the field, what we have is is a paper demonstrating the robust willingness of climate scientists to sell trickery as science for both money and for the cause. These authors should be ashamed but even when caught truncating series, they simply push on producing ever more garbage for the small brained sheep in the media, politics and the public to use as propaganda for the government agenda.”

Capture


https://noconsensus.wordpress.com/2016/01/16/nearly-two-teams-of-hockey-sticks-used-in-massive-wilson-super-reconstruction/


Nanaimo BC Temperature Range

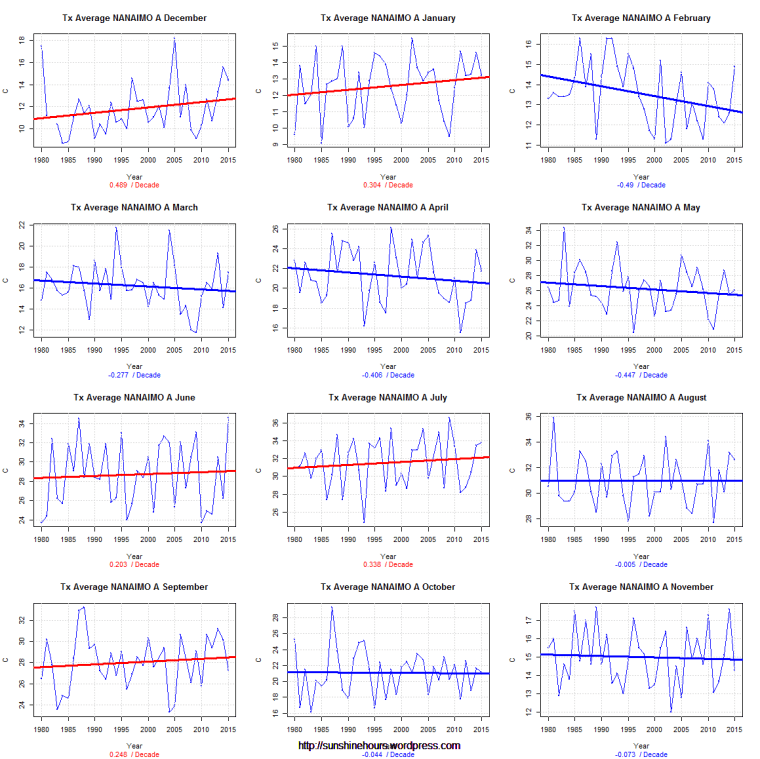
I live near Nanaimo BC (data from 1947 at “NANAIMO A”). I was curious what the temperature range for any given day would be.

By temperature range I mean find the warmest it has ever been for a particular day and then subtract the coldest it has ever been.

December 1st , February 4th, November 14th and May 16 have the biggest range = 32.8C.

November 18th has the lowest range = 16.9C. (I find it interesting it has never been colder than -4.4C on November 18 when it has been -16.1C on November 14th.

(Remember this when someone says humans and animals will notice a 1C change in the next 100 years).

Top 10 and bottom 10 below.

Biggest Difference:

Month Day Min Max Difference
12 1 -18.9 13.9 32.8
2 4 -16.7 16.1 32.8
11 14 -16.1 16.7 32.8
5 16 -4.4 28.4 32.8
6 17 0.6 33.3 32.7
5 29 1.7 34.3 32.6
5 12 0 32.4 32.4
5 28 0.6 33 32.4
5 14 -0.6 31.7 32.3
12 24 -13.9 18.2 32.1

Lowest Difference:

Month Day Min Max Diffference
11 18 -4.1 12.8 16.9
3 15 -3.3 14.5 17.8
12 5 -7.1 12.1 19.2
11 10 -4.4 14.9 19.3
12 11 -6.1 13.5 19.6
12 3 -5.9 14 19.9
12 12 -6.3 13.9 20.2
2 23 -5.6 14.6 20.2
3 14 -3.9 16.6 20.5
3 17 -5 15.7 20.7

Another UK Coal Power Plant Converted To Burn US Wood

This is just insane.

Burning wood pellets releases as much or even more carbon dioxide per unit of energy as burning coal.


“One of Britain’s dozen remaining coal-fired power plants is to be converted to burn wood pellets shipped in from North America, after the European Commission approved a £1bn subsidy contract for the project.

RWE’s Lynemouth power station in Northumberland is due to close by the end of this year under environmental rules, but will now be resurrected as a biomass plant following EU state aid approval for the consumer-funded subsidies.

The 420 megawatt plant, which produces enough electricity to power 450,000 homes, could be up and running again within 18 months, subject to a final investment decision early next year, RWE said.

The decision also boosted Drax, the Yorkshire coal plant that is awaiting state aid approval of a similar subsidy contract for the conversion of one of its units to burn biomass.”

http://www.thegwpf.com/green-madness-coal-plant-gets-green-light-to-burn-american-wood-pelets