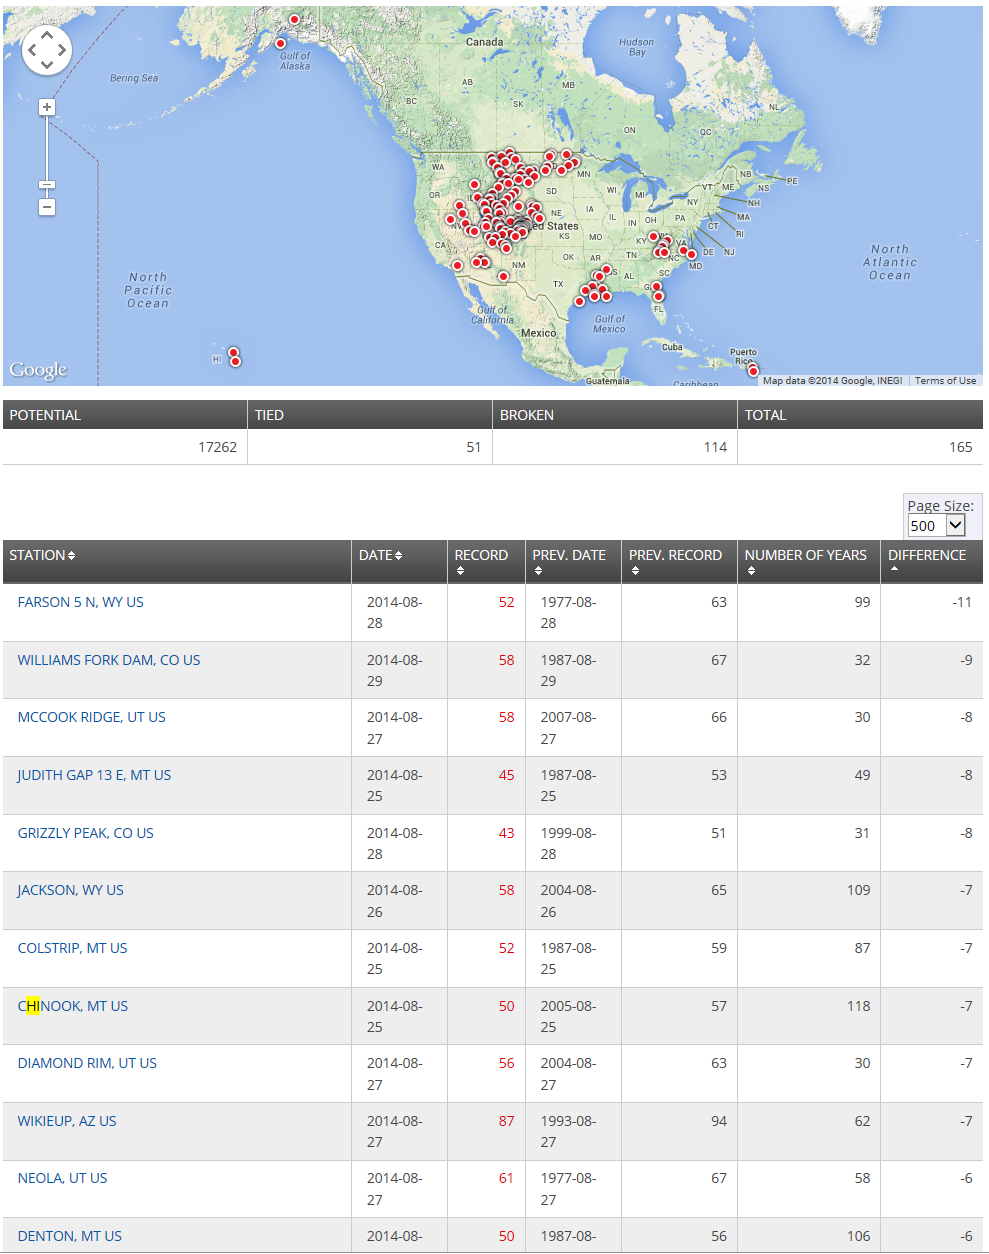
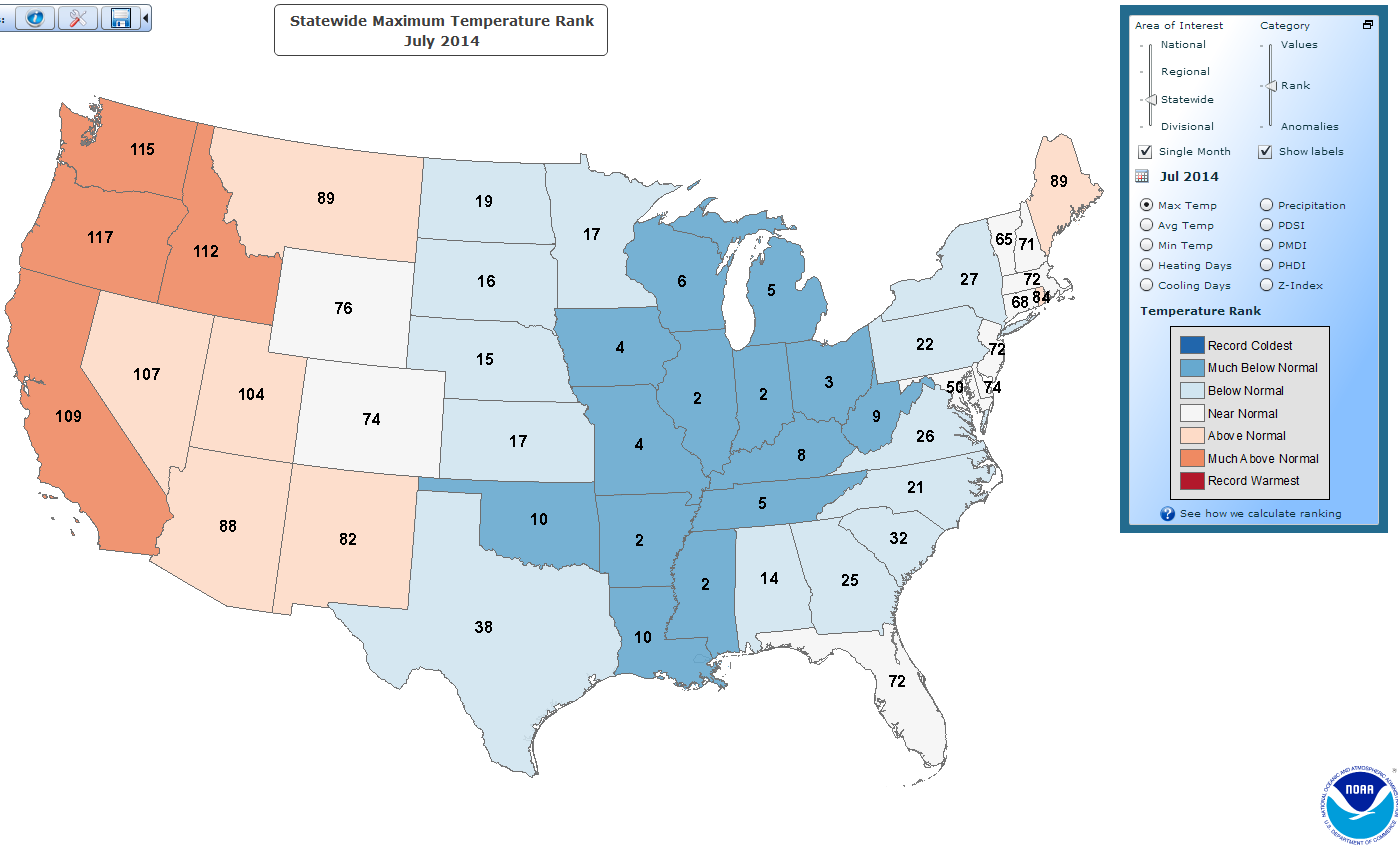
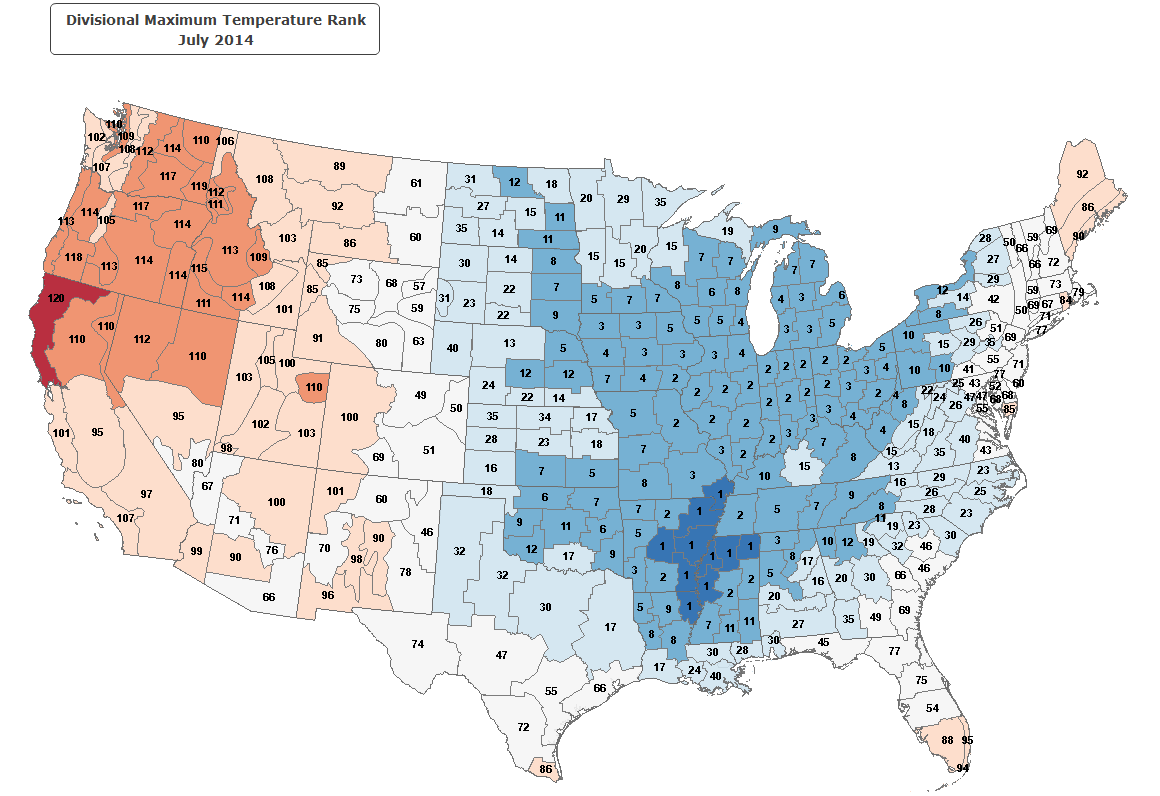
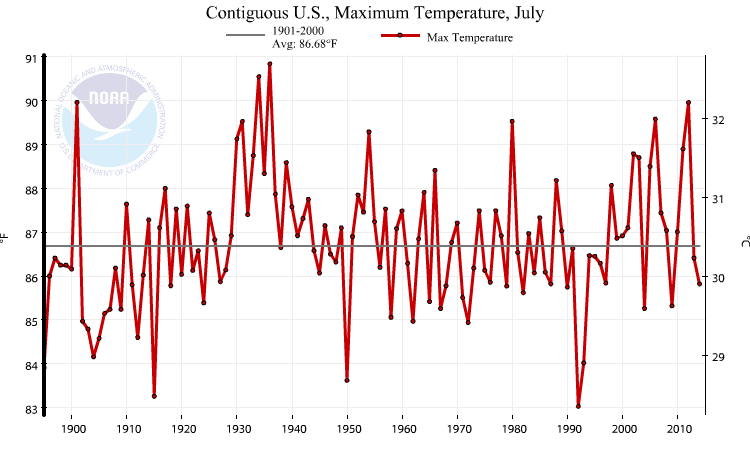
According to the NOAA, July 2014 ranked 29th coldest out of 120 using the Maximum temperature
The list in order of warmest to coldest.
1936,1934,1901,2012,2006,1931,1980,1954,1930,2011,2002,1933,2003,1939,2005,1966,1935,1988,1998,1917,1964
1937,1952,1943,1910,1921,1940,1919,1957,1960,1974,1977,1953,1925,2007,1932,1985,1942,1914,1955,1970,1946
1916,1949,2001,1959,2008,1989,2010,1983,1929,1941,1978,2000,1951,1999,1963,1926,1969,1938,1991,1923,1944
1981,1947,1994,1995,1897,2013,1948,1961,1996,1898,1899,1956,1908,1973,1900,1928,1922,1975,1986,1945,1984
1920,1913,1896,1927,1976,1997,1987,2014,1911,1918,1968,1979,1990,1982,1971,1965,1924,2009,1967,2004
1907,1909,1906,1958,1902,1962,1972,1903,1912,1905,1904,1993,1895,1950,1915,1992
The scary thing is … 2009 and 2004 were colder than 2014.