Wind turbine collapses in high wind

Would you want your hospital reliant on wind turbines that can’t handle 50mph gusts?

“A 35-metre turbine has collapsed near Holsworthy leaving the tower lying on the ground. The turbine at East Ash Farm in Bradworthy was erected in 2010 by Dulas Ltd. Dulas confirmed this morning that an “incident” had occurred with the turbine and said the situation is currently being investigated”


Japan Meterological Agency Show Global Temperature .25C Colder Than NASA/MET/NOAA

Tom Nelson has a blog post pointing out that NASA is claiming the Japan Meterological Agency Global Temperature average “agrees” with the MET and NASA and NOAA.

The trouble with that claim is that Japan’s line on the graph shows a sudden .25C downward divergence after 2000.


Japan Meteorological Agency

Has the AMO Peaked? May-Oct says No and Nov-Apr says Yes.

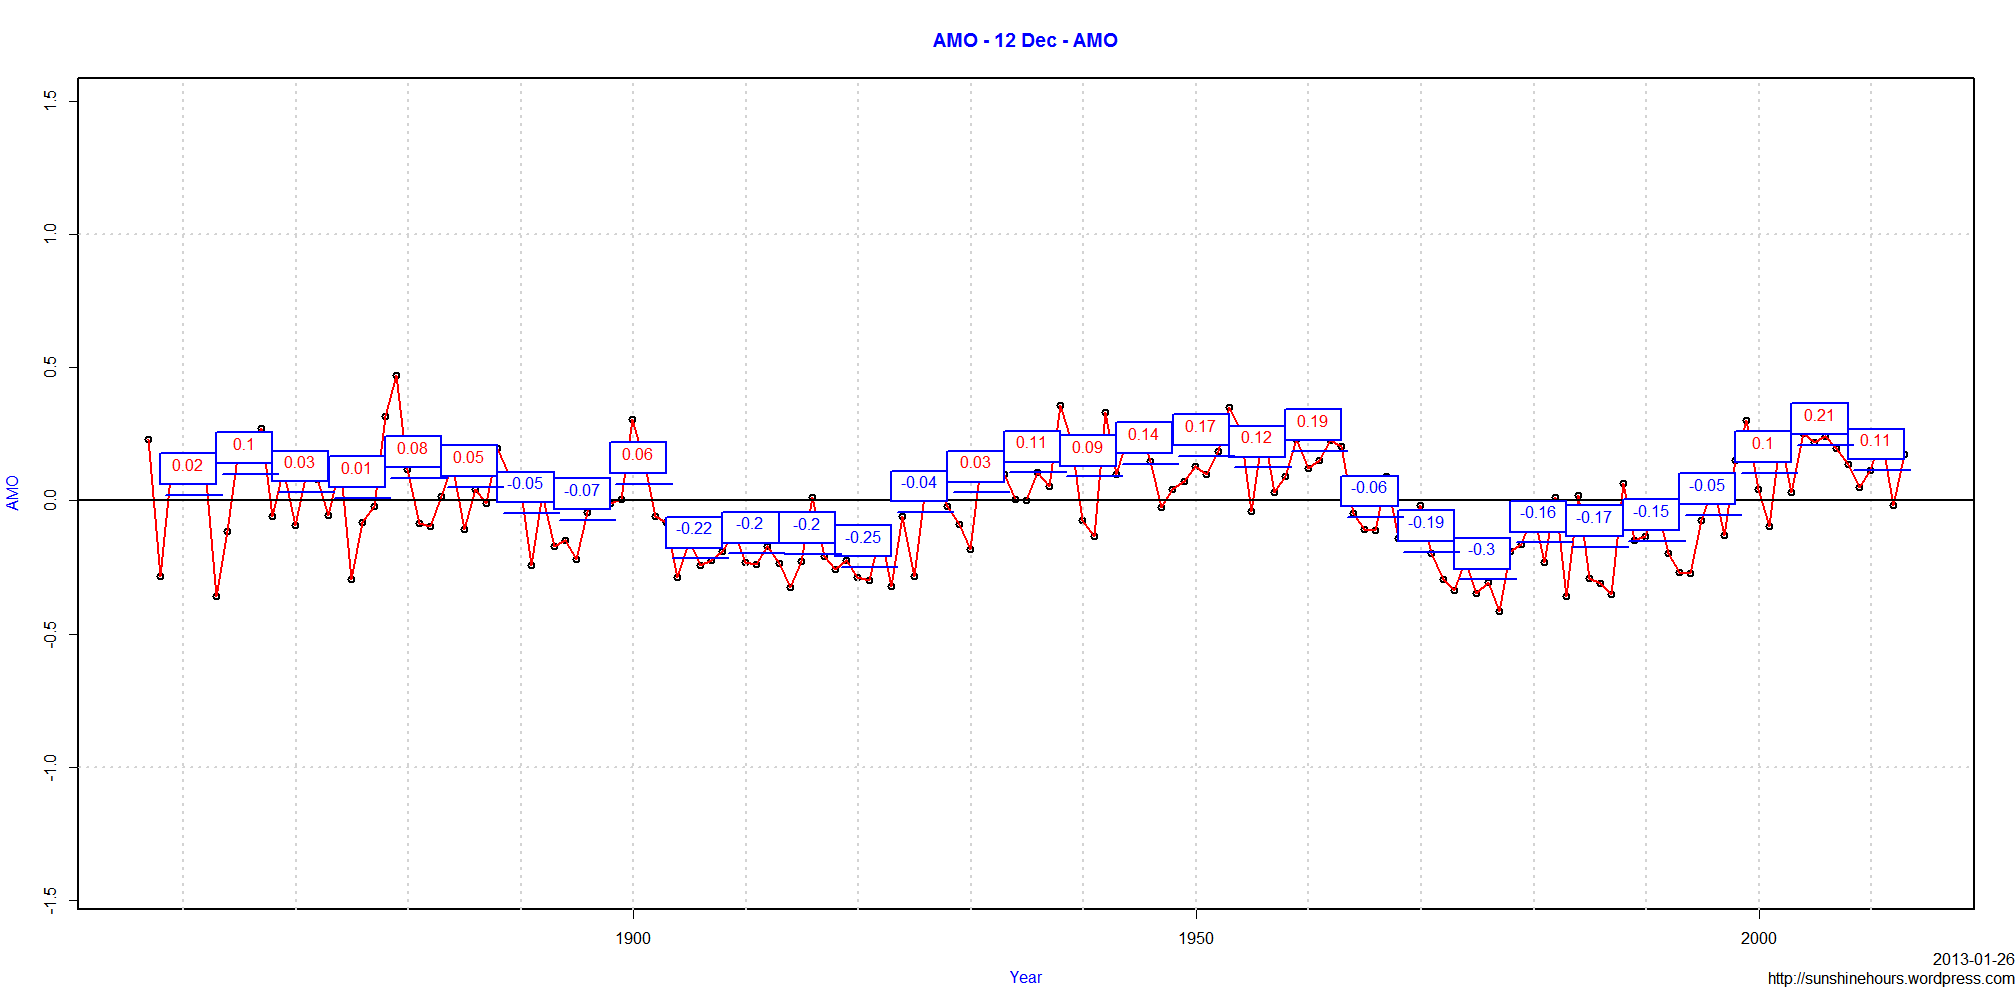
Has the AMO Peaked and started its drop towards negative?  The answer is yes for winter months and no for summer months.

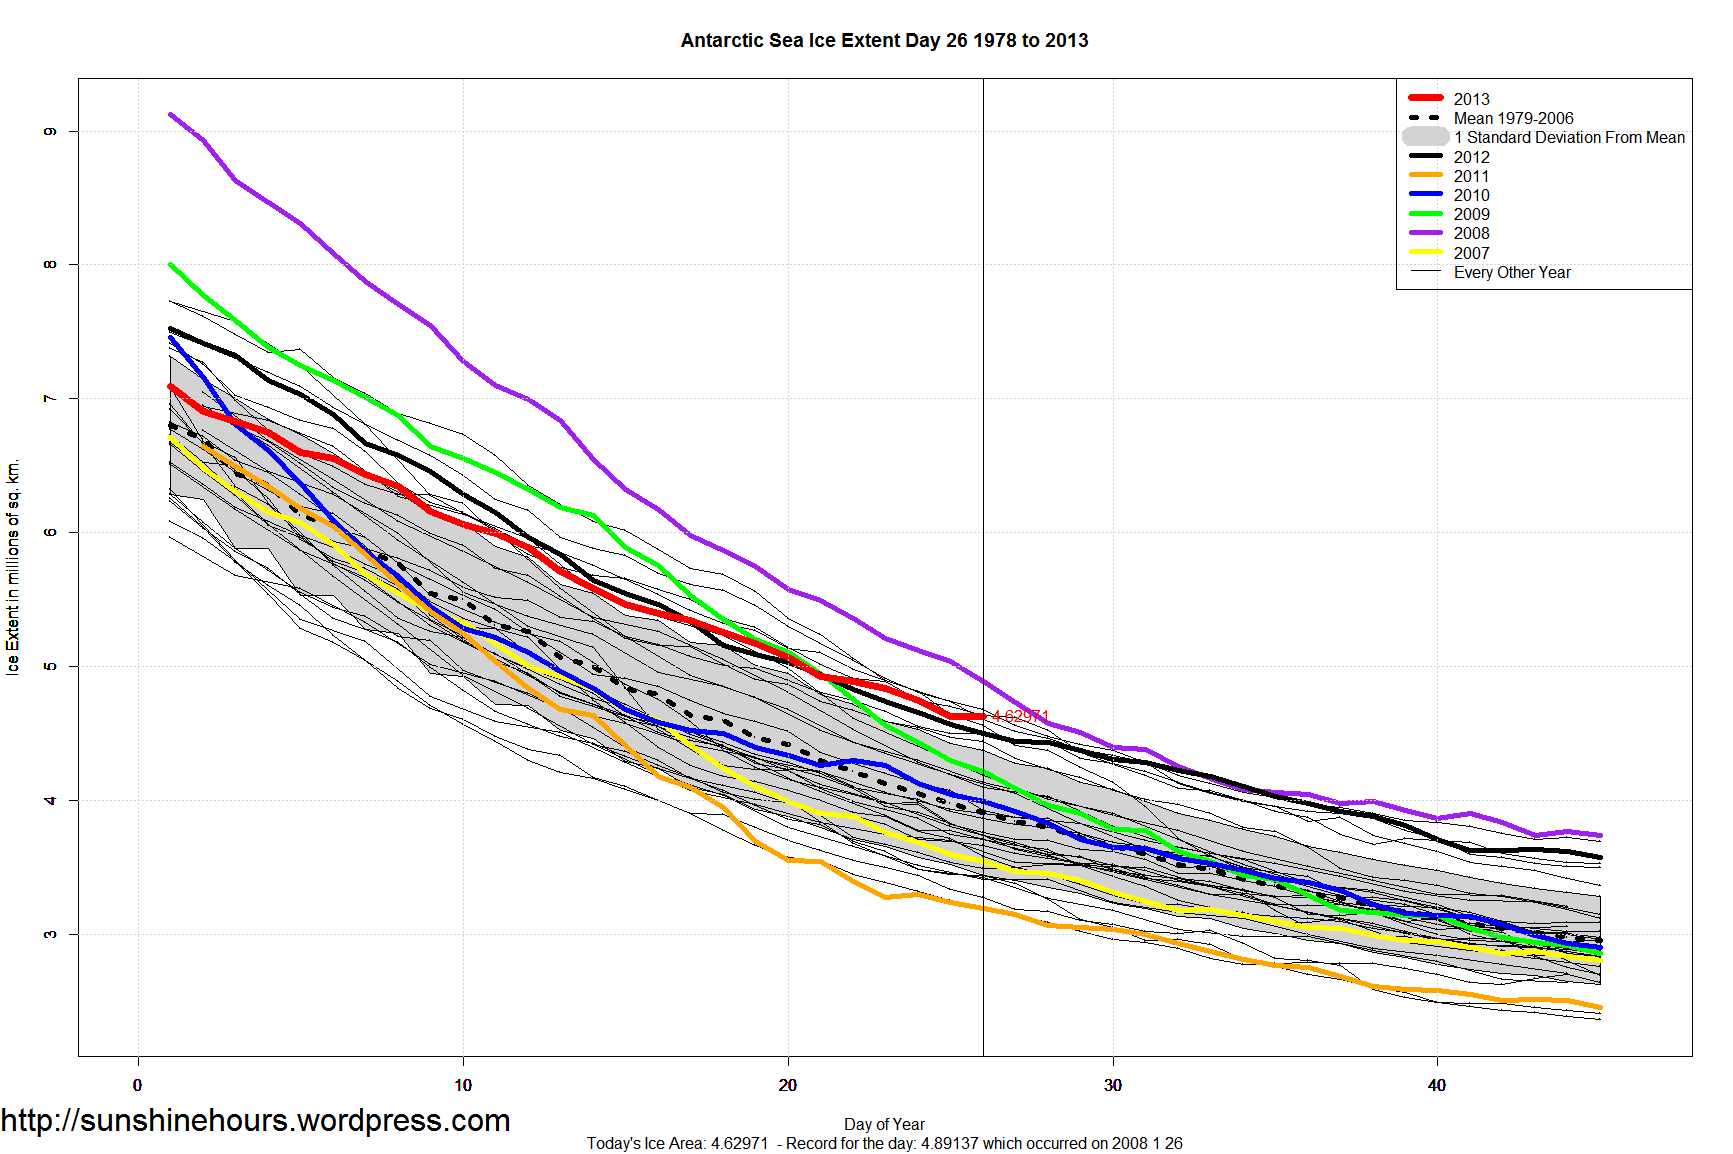
Maybe thats why winter Arctic Ice is doing fine and summer Arctic Ice is not doing fine.

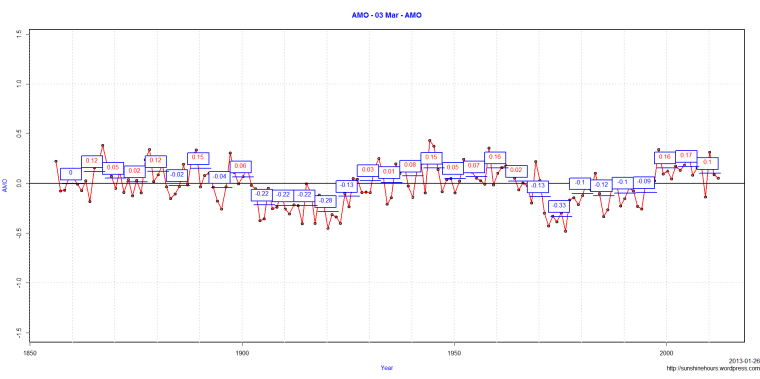
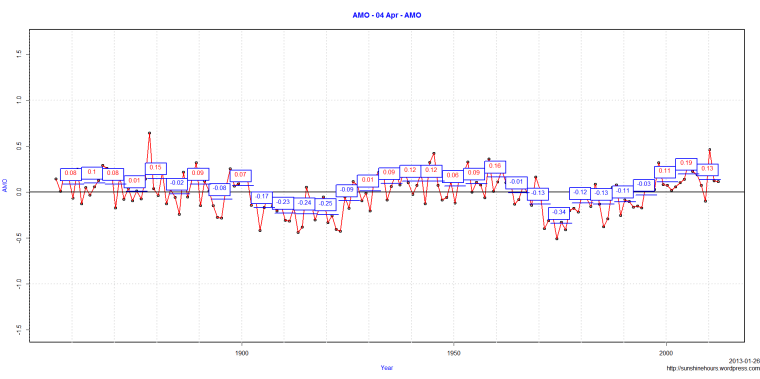
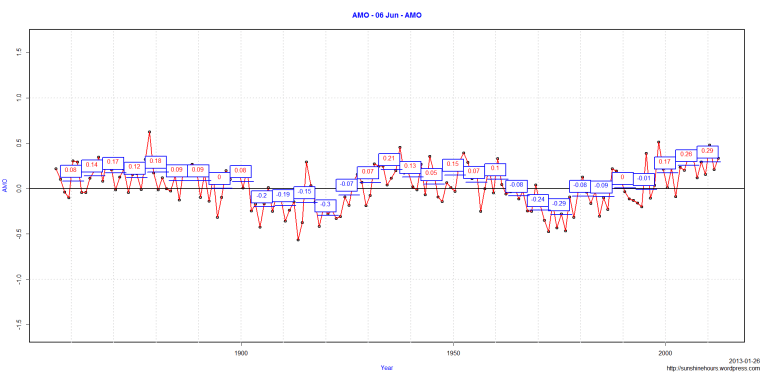
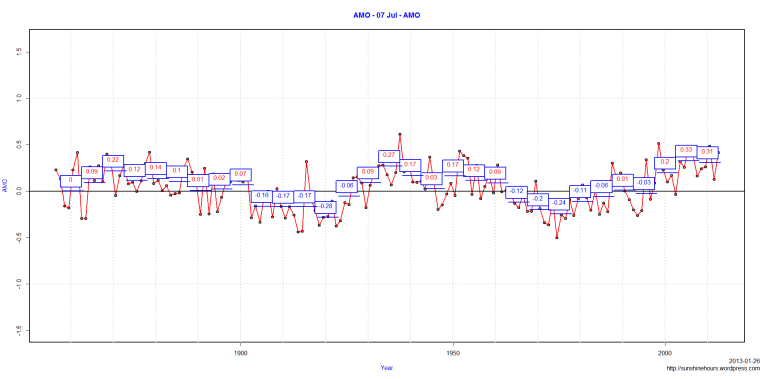
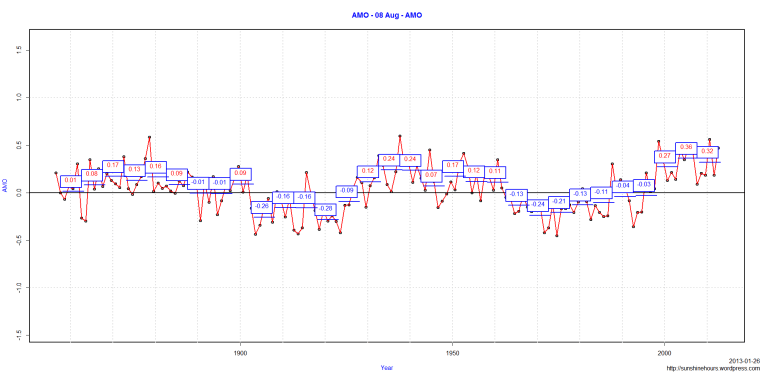
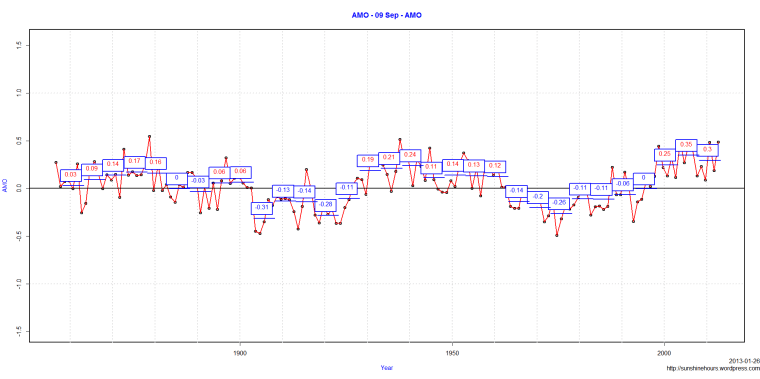
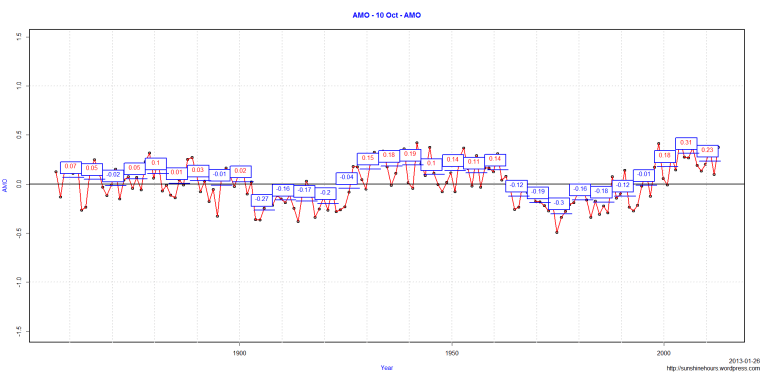
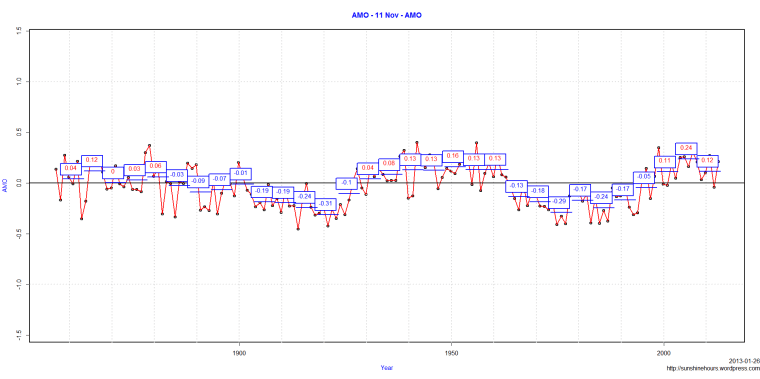
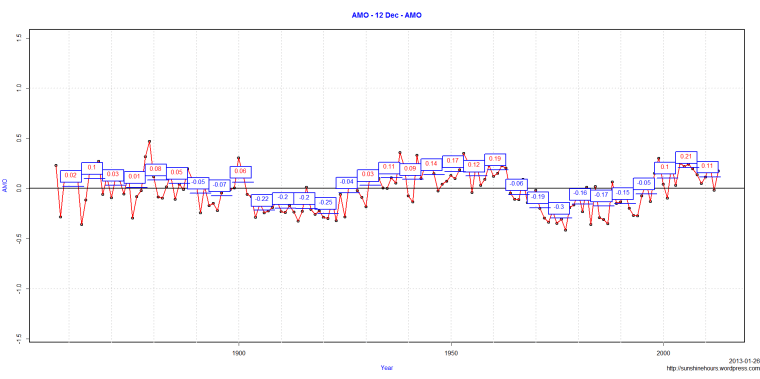
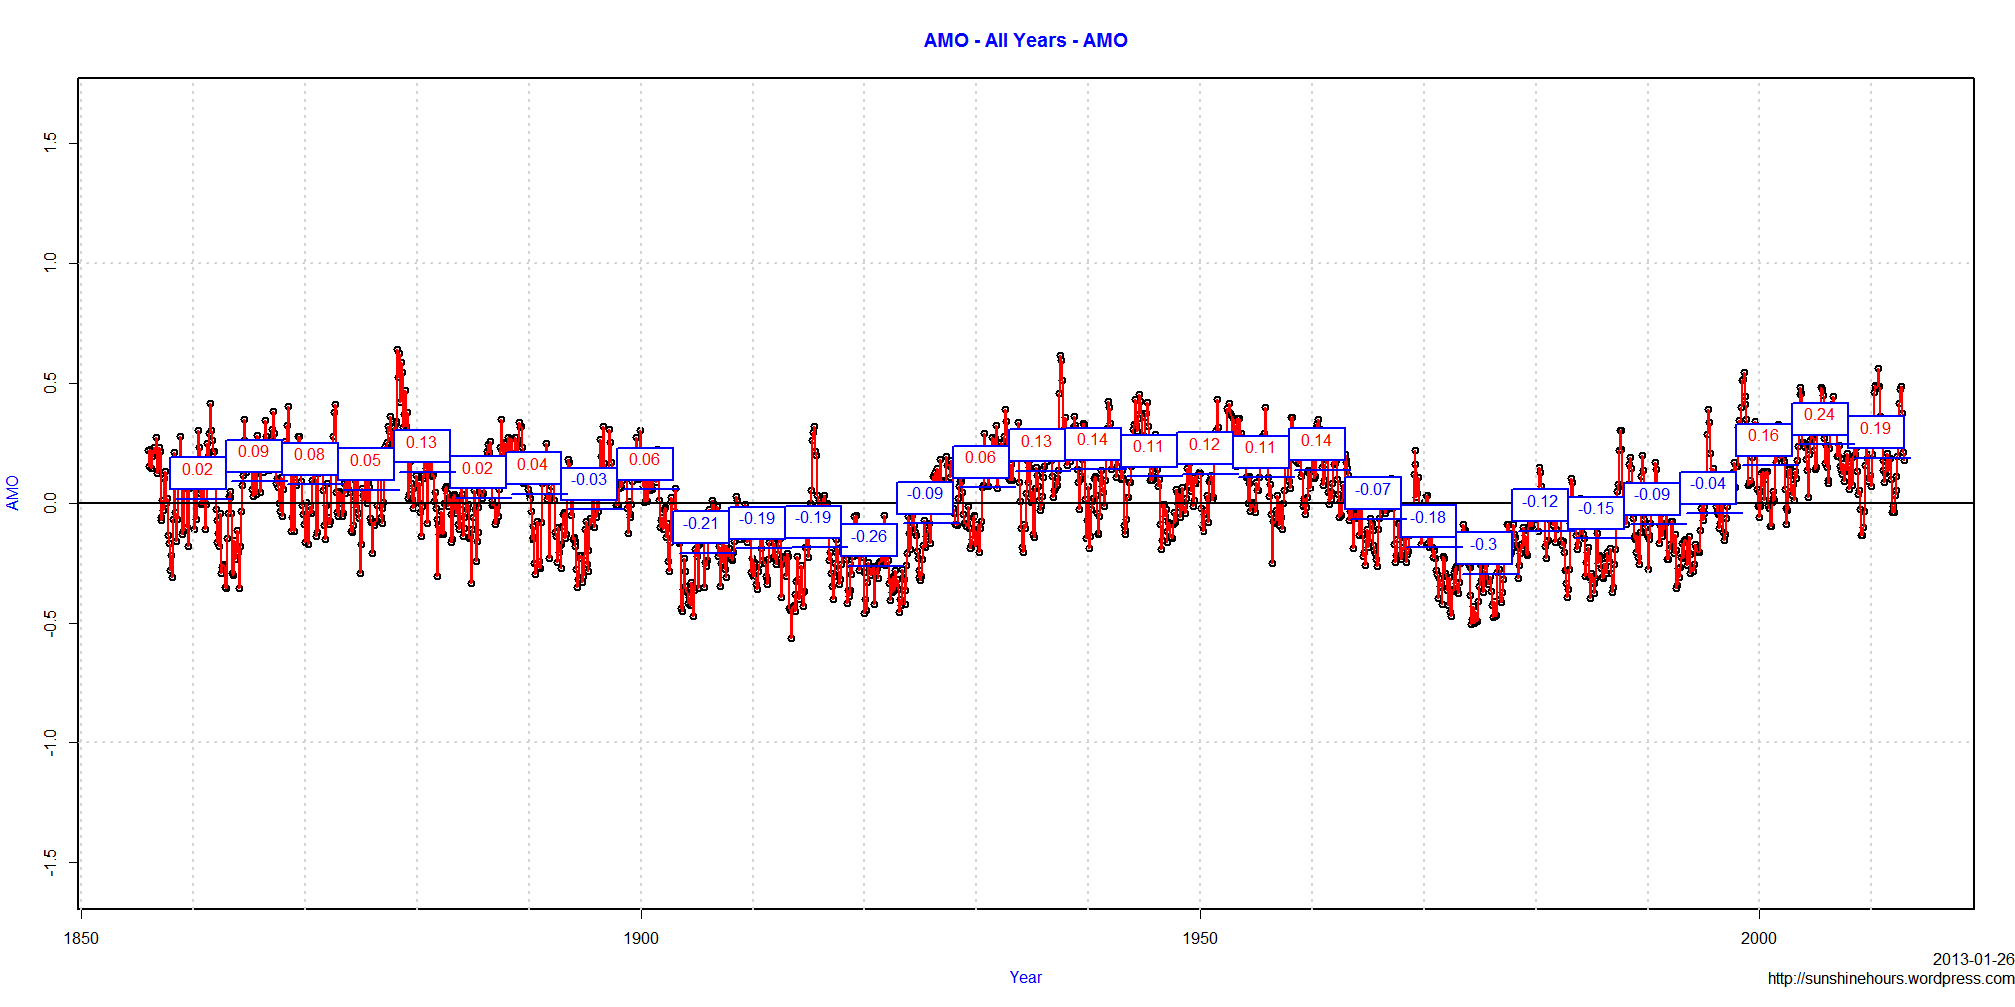
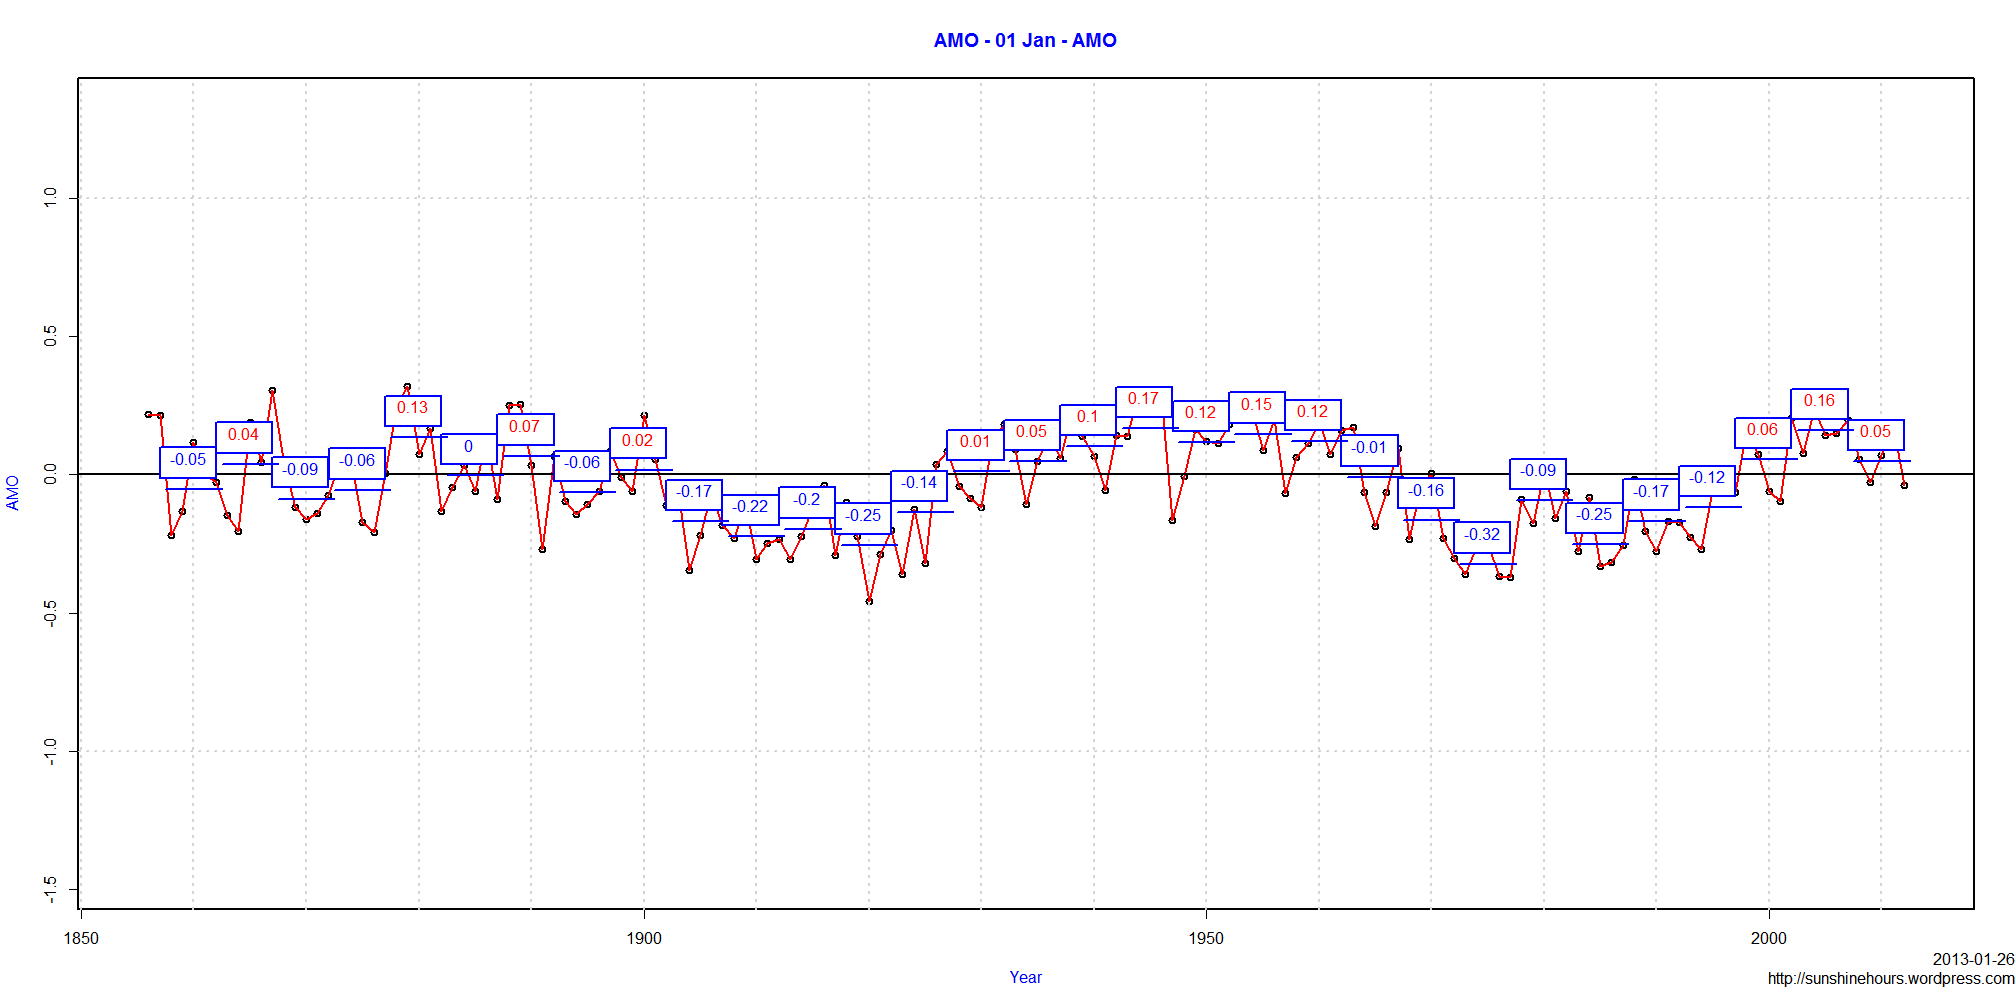
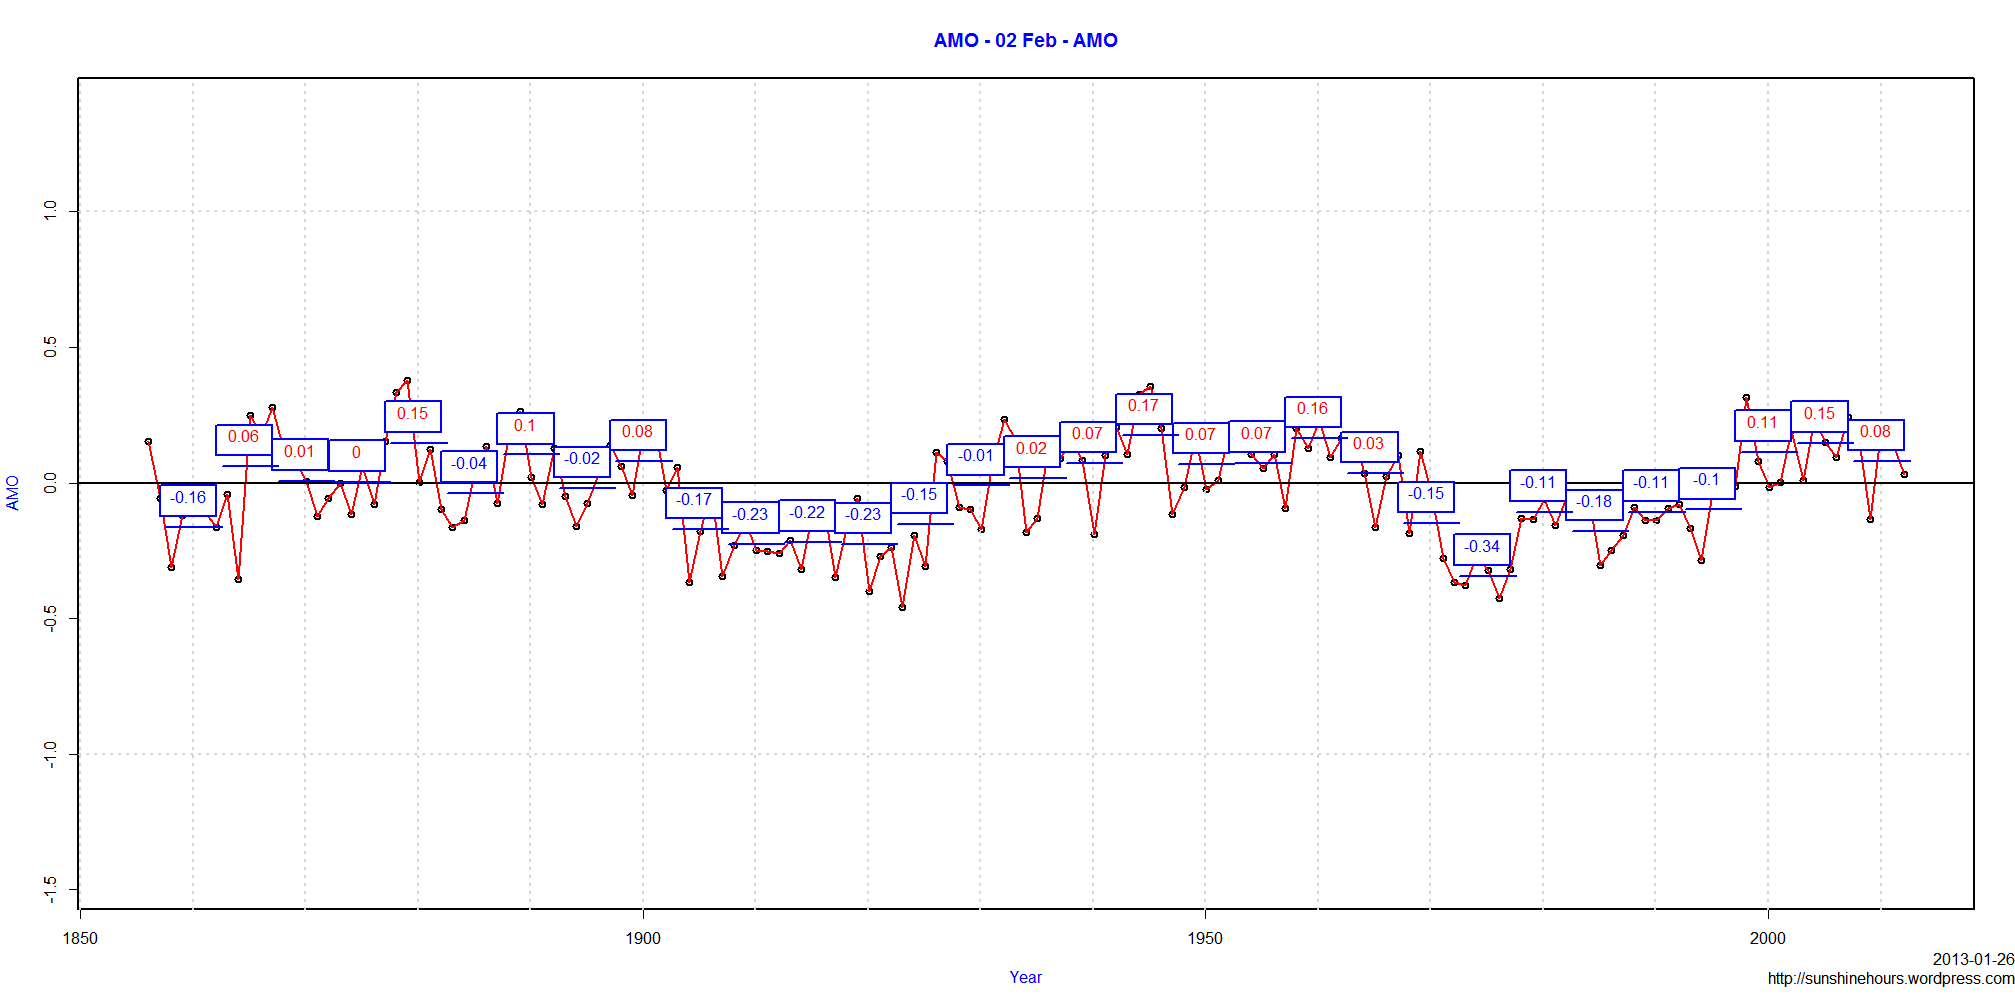
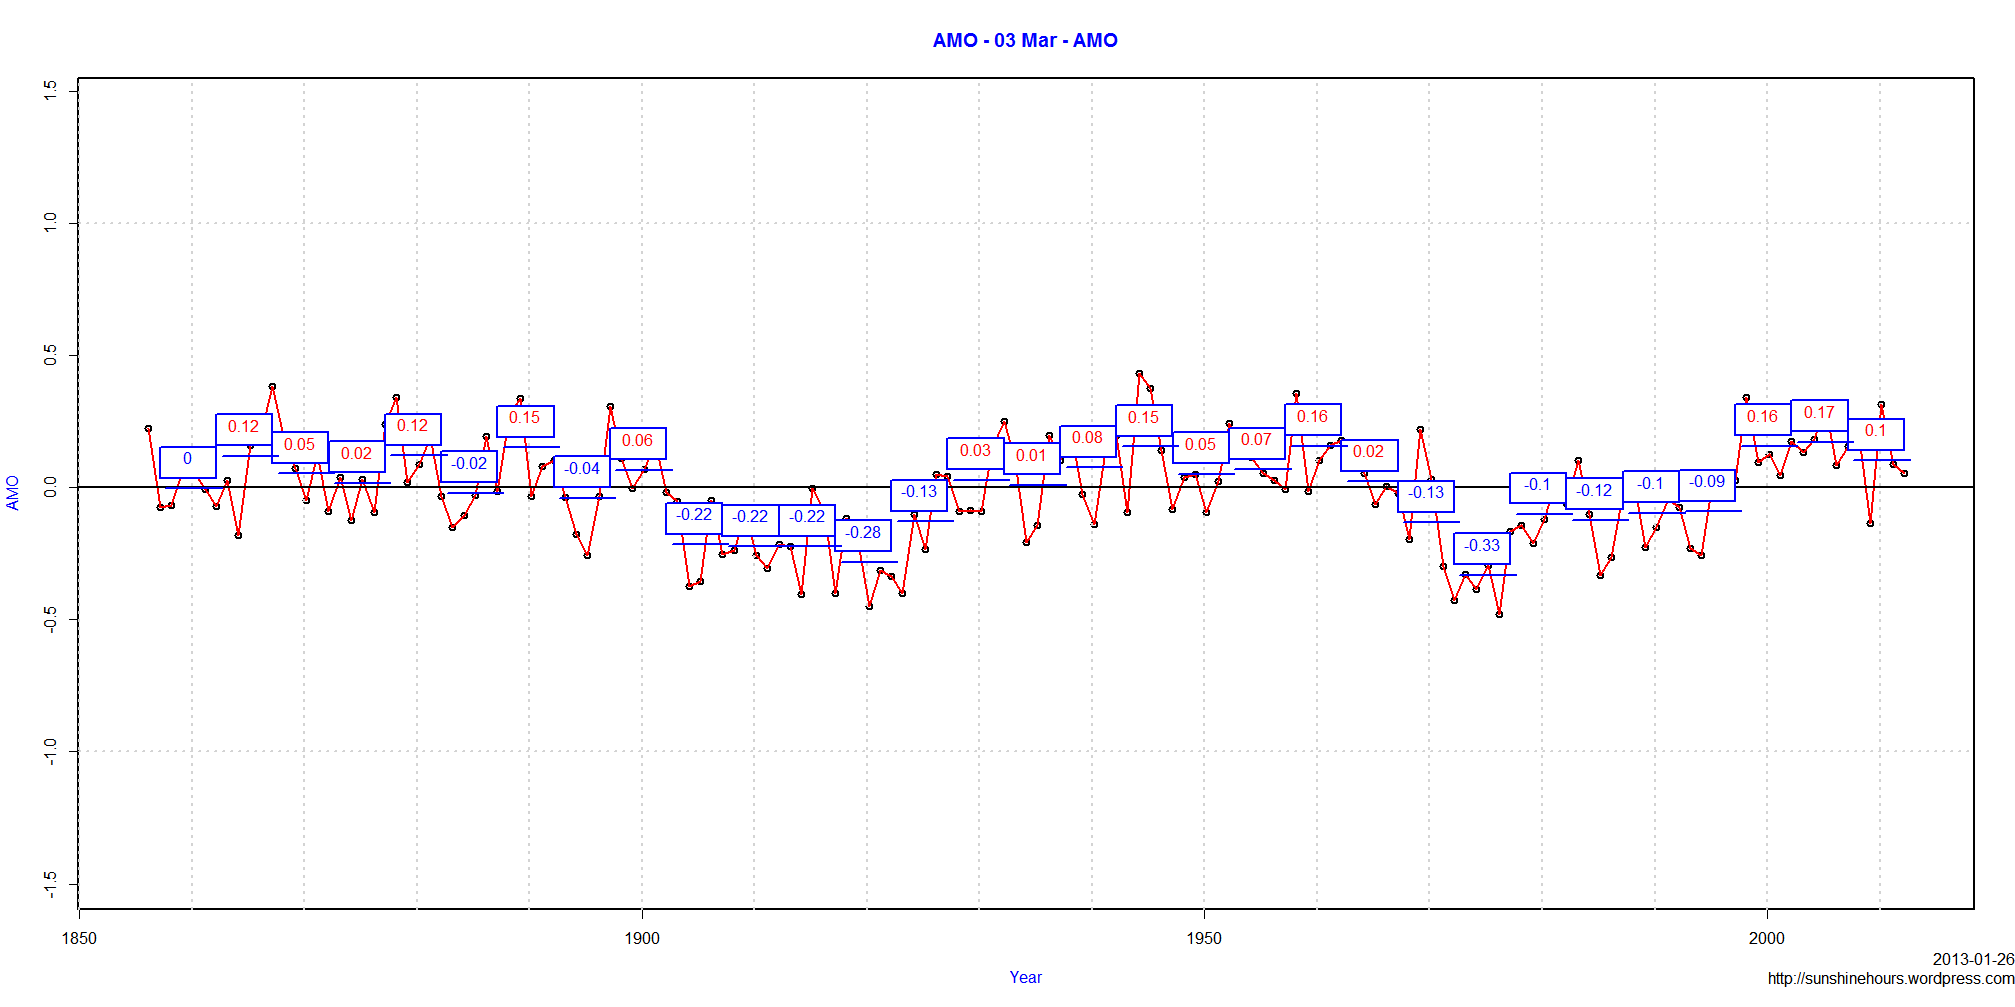
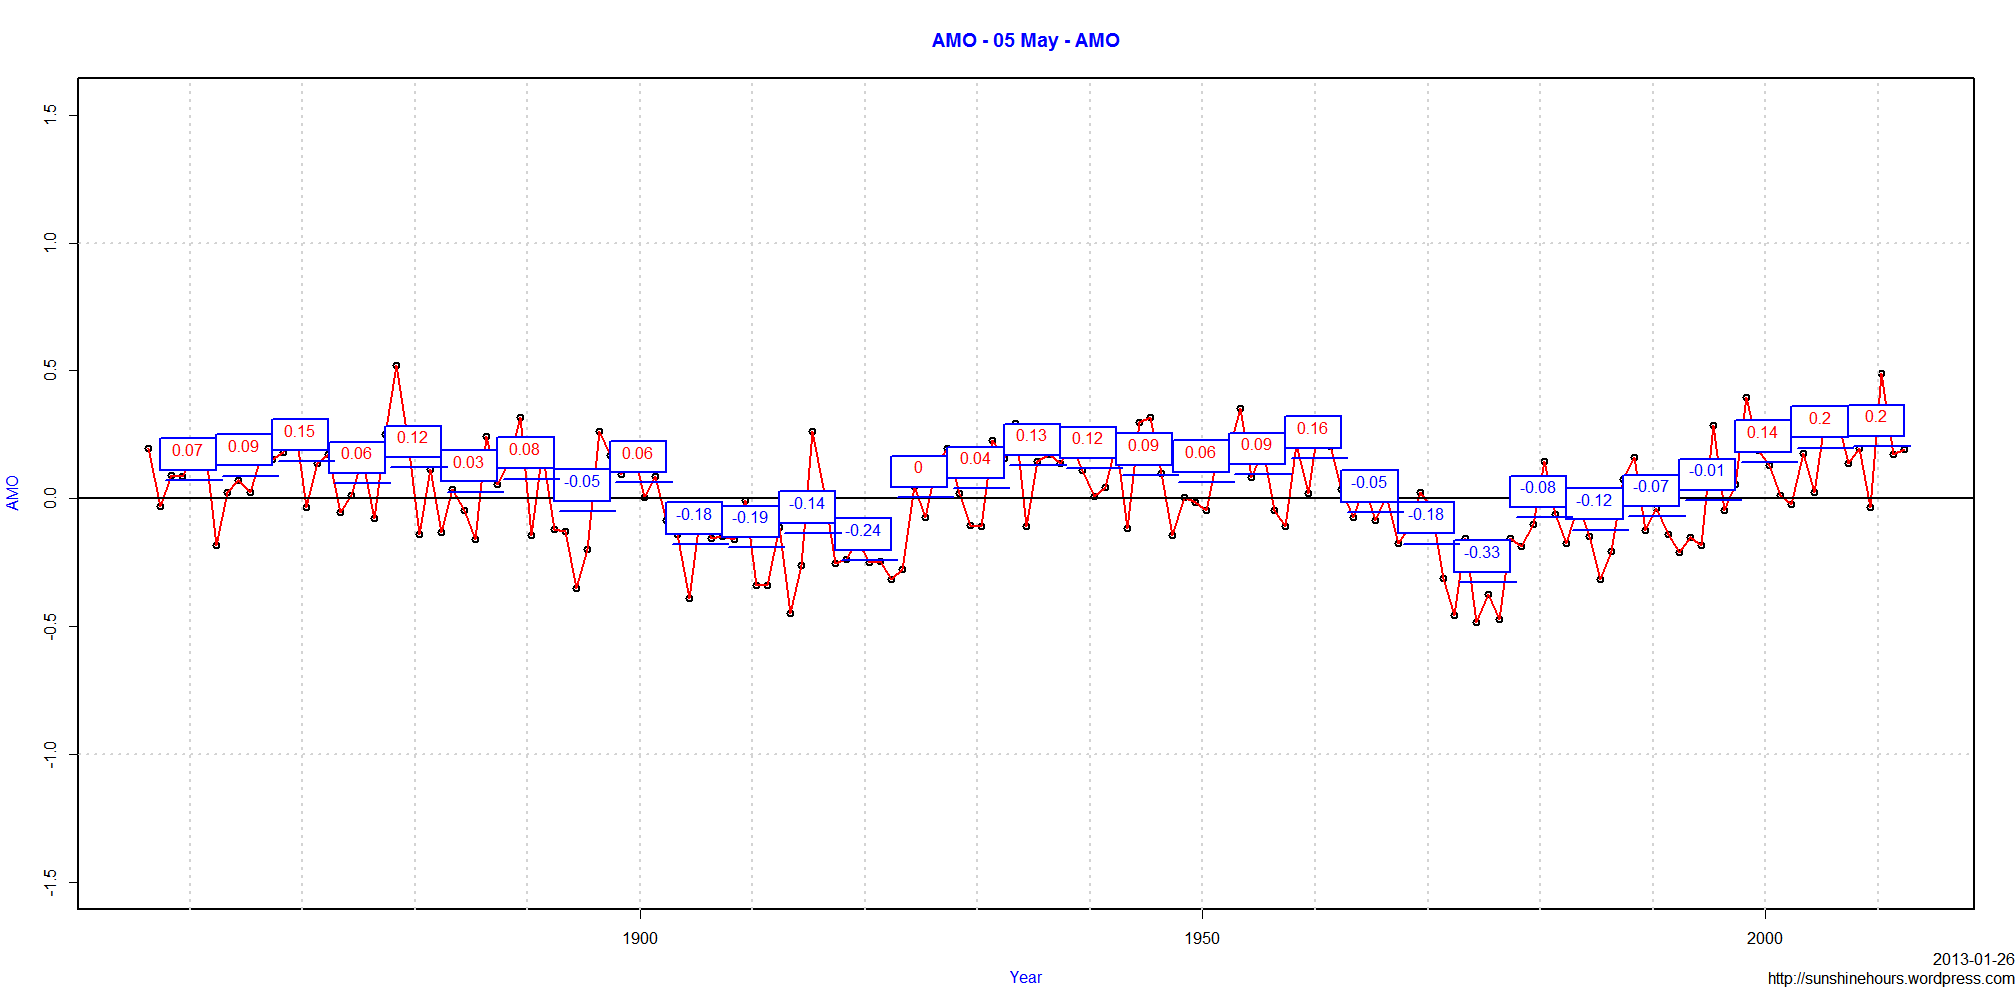
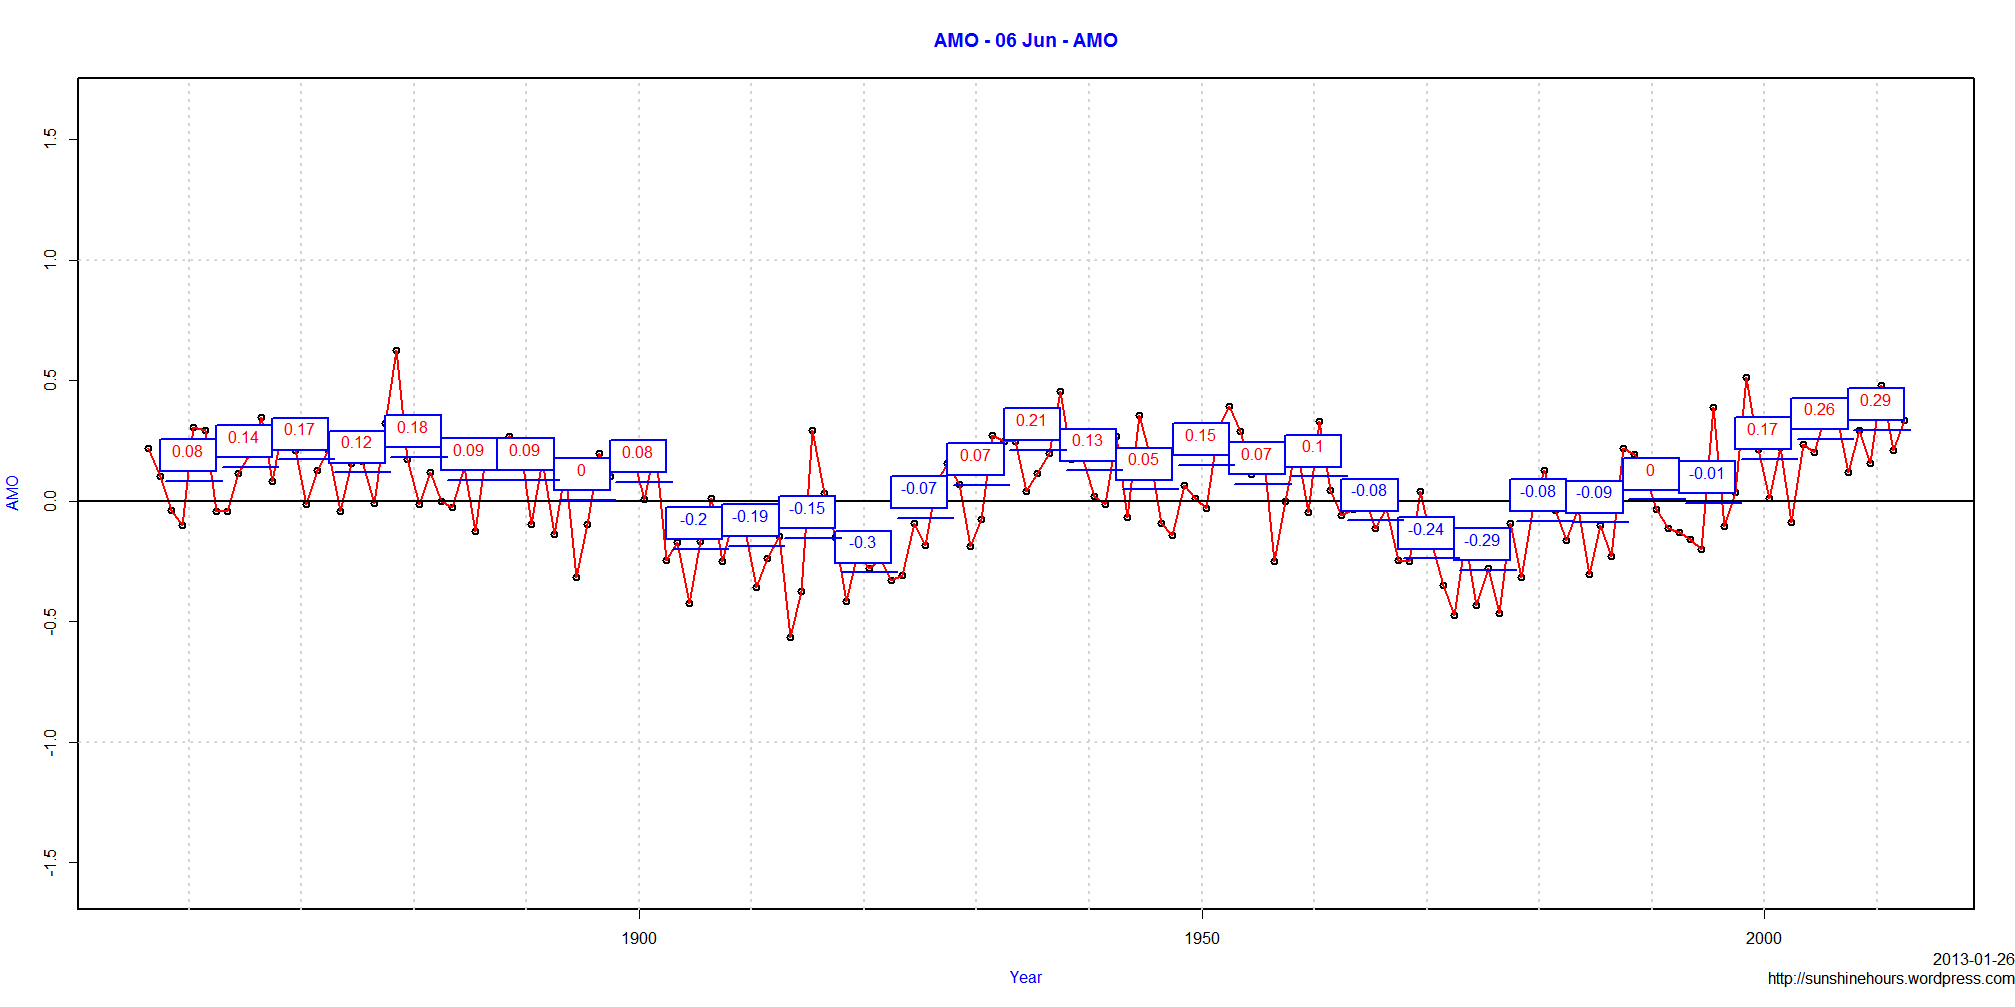
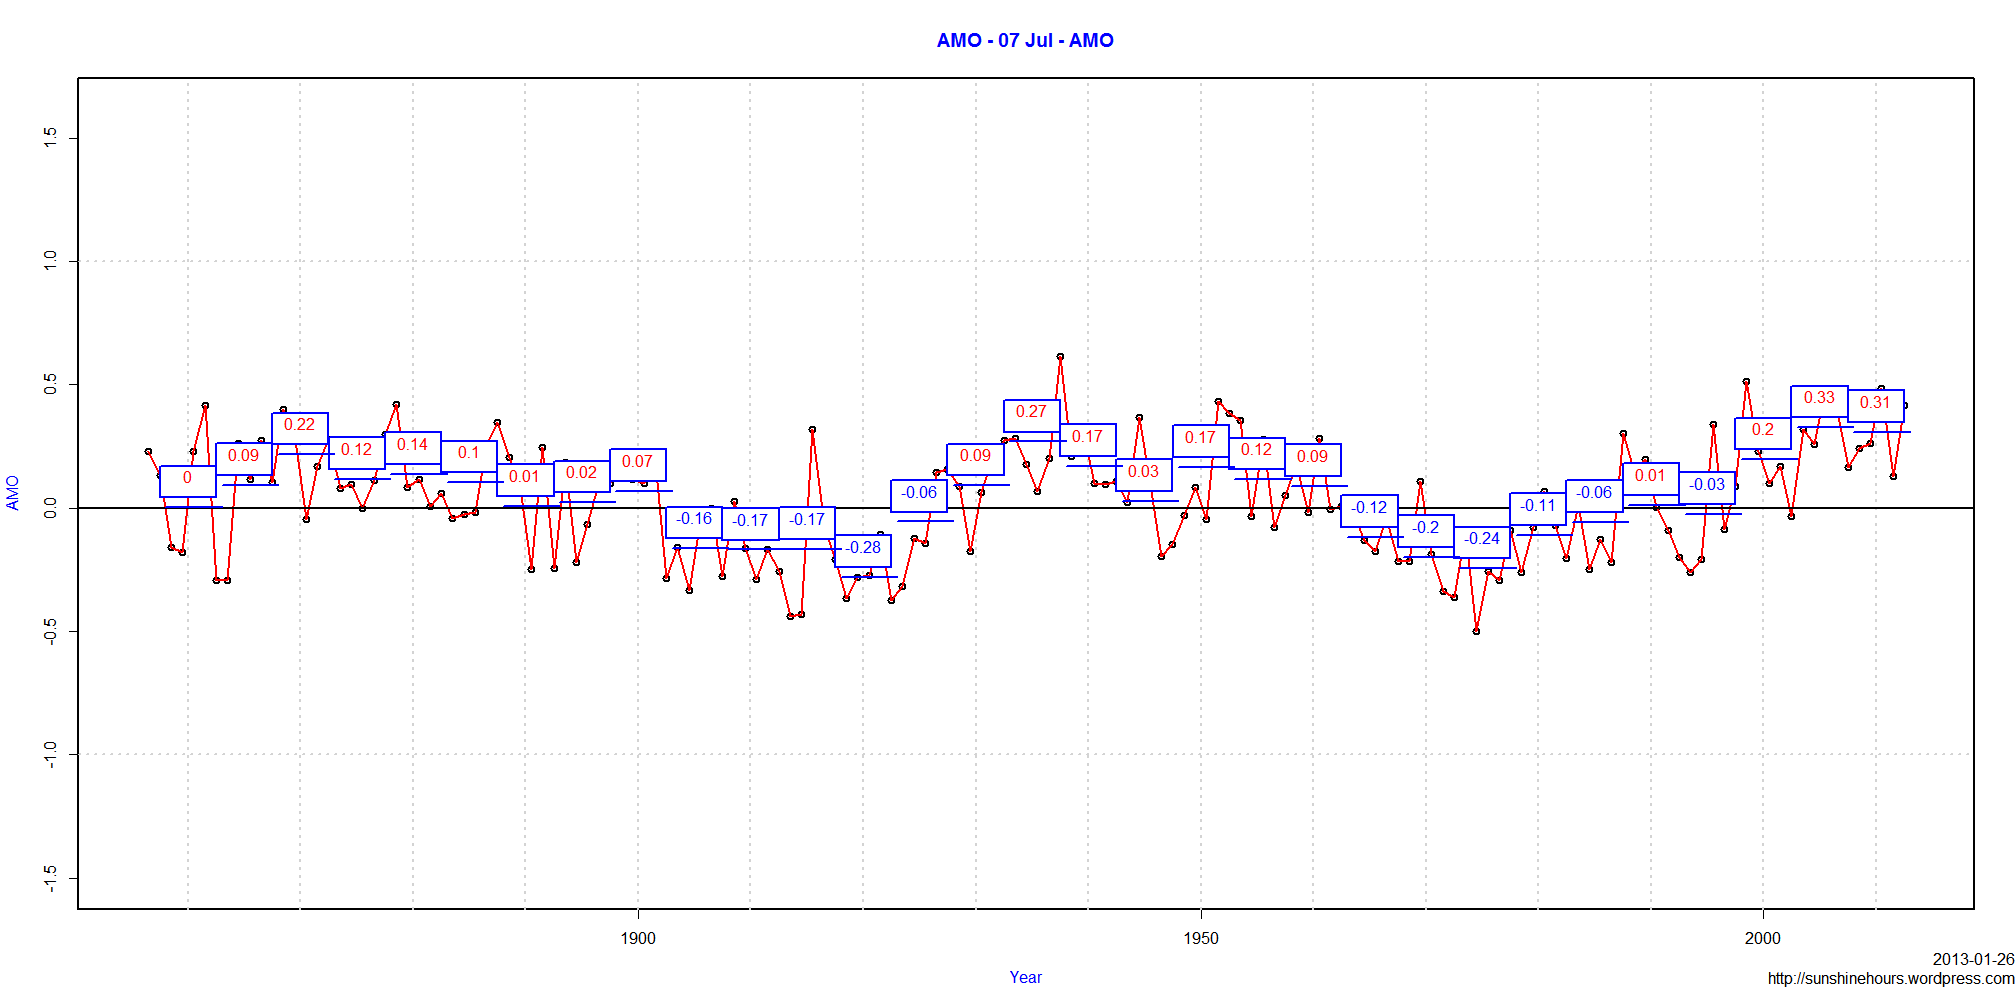
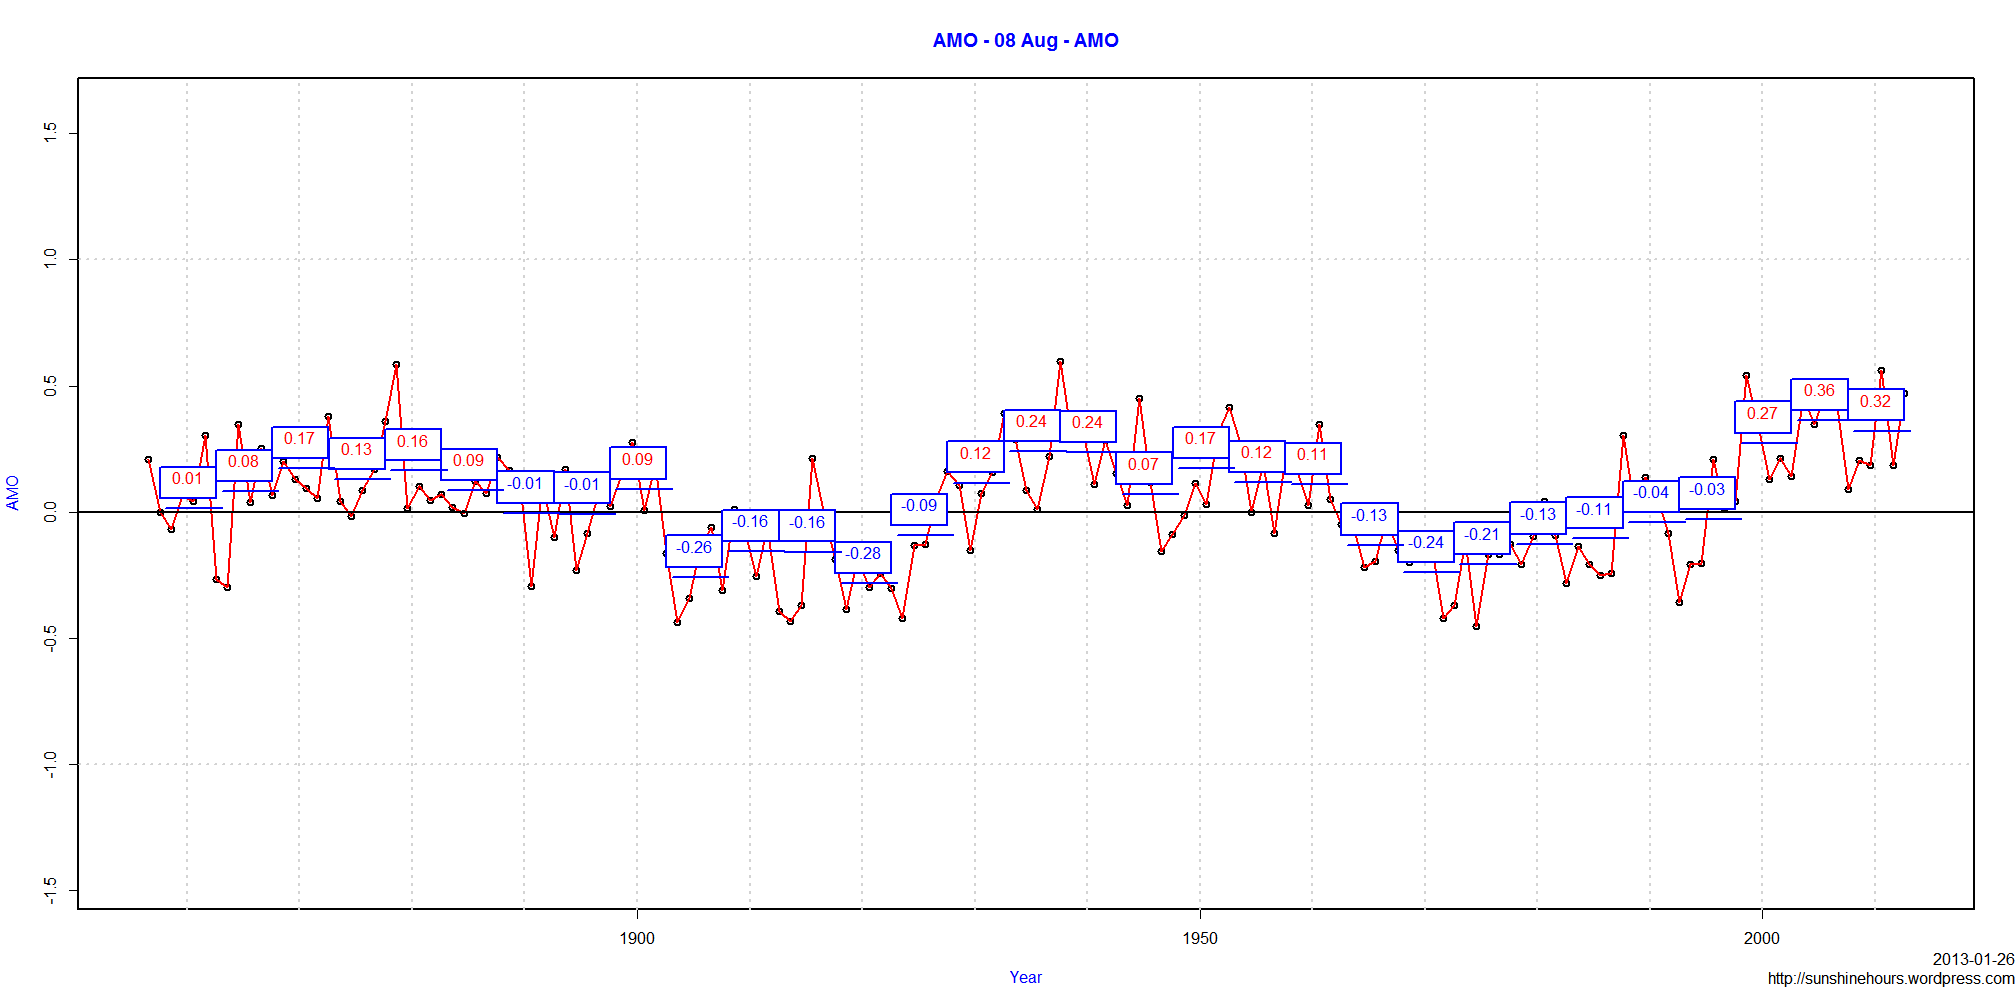
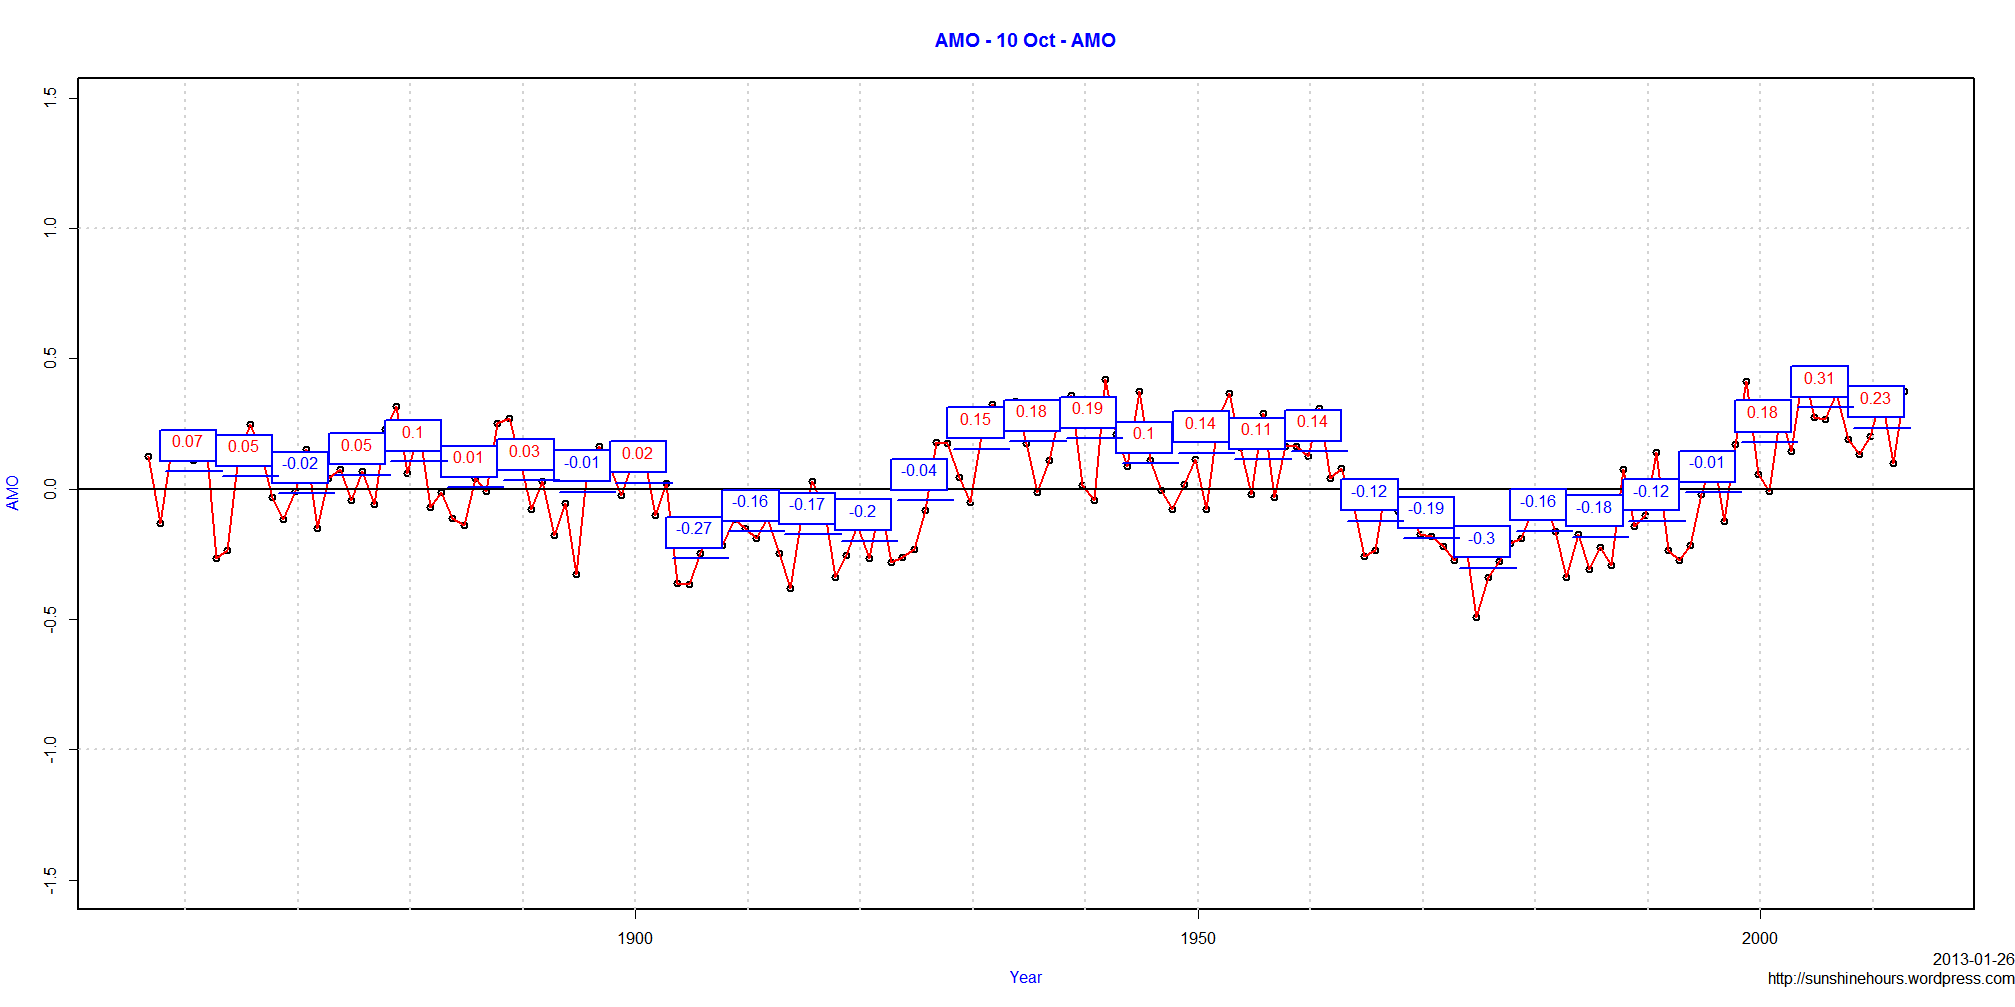
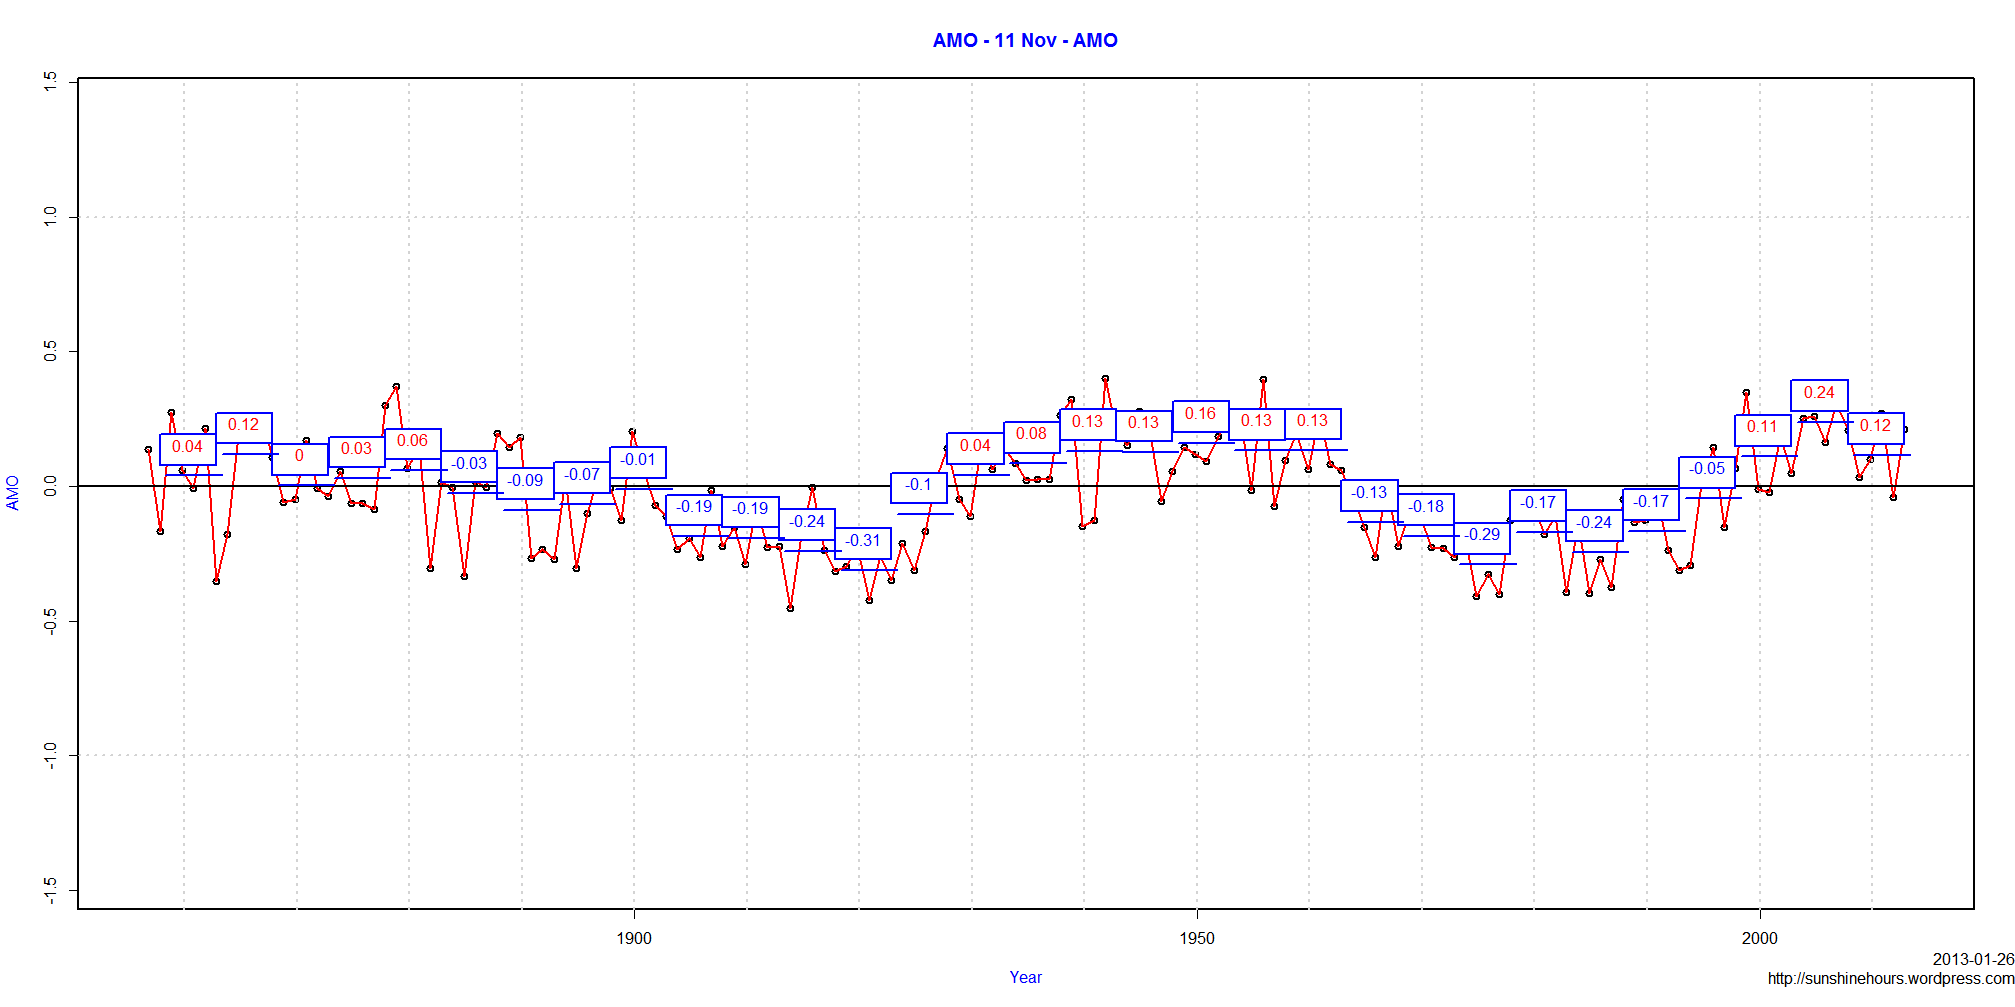
I have included a graph for the AMO for all years that we have data, and then the AMO broken down for each individual month.

The blue boxes in the graphs contain 5 years averages, the blue line underneath is the 5 year period. Red values = above 0 and blue values = below 0.

The All Years AMO has dropped a little over the last 5 years compared to the previous 5 years, but the value is still higher than the 1950 peak of the AMO (but not as high as the short peak around 1878).

It is also interesting that the 1950 peak was in the middle of a 35-40 year period above zero and the current peak is only 15 years long. The AMO may still have decades left above zero, but the winter months look like it was a shorter peak.

May to October 5 year values are still higher than the previous peak around 1950.

November to April have dropped and are now lower than the previous peak around 1950.

Click on any graph to make it bigger.

AMO - All Years - AMO
AMO - 01 Jan - AMO
AMO - 02 Feb - AMO AMO - 03 Mar - AMO AMO - 04 Apr - AMO AMO - 05 May - AMO AMO - 06 Jun - AMO AMO - 07 Jul - AMO AMO - 08 Aug - AMO AMO - 09 Sep - AMO AMO - 10 Oct - AMO AMO - 11 Nov - AMO AMO - 12 Dec - AMO

Canada 2012 – Anomalies Mapped

I have mapped the anomalies in the Environment Canada monthly summaries that have “normals”. The anomalies are calculated from selected stations based on the 1971-2000 average.

The 5C black dot in the top left hand corner represents 5C difference from “normal”. Red dots are warmer than normal. Blue are cooler. And Green are 0.

March April and May are really close to normal (all the dots are small). Other months have extremes. October is colder than  normal. March is really interesting for having no red dots in the Arctic which means below normal temperatures which has not been true for years.

There is an animated gif at the bottom showing all months of 2012.

EC Normals 0x0 2012-01 EC Normals 0x0 2012-02 EC Normals 0x0 2012-03 EC Normals 0x0 2012-04 EC Normals 0x0 2012-05 EC Normals 0x0 2012-06 EC Normals 0x0 2012-07 EC Normals 0x0 2012-08 EC Normals 0x0 2012-09 EC Normals 0x0 2012-10 EC Normals 0x0 2012-11 EC Normals 0x0 2012-12 EC_0x0_Map

HADCRUT4 – Gridded 12 Year Trends – Freezing In Alaska and Mongolia and Australia

HADCRUT4 for the last 12 years shows a small amount of cooling. The following map shows which 5×5 grid squares are warming or cooling. I am using grid squares with 130 out of 144 possible datapoints for the period. The circles are proportional to the trends.  Keep in mind that this is 5×5 grids squares. As I’ve shown for Canada different size of grid squares change warming to cooling.

HADCRUT4_DEC_2012_12_Years

HADCRUT4 Dec 2012 – Colder than 3 months in 1878 (and others)

HADCRUT4 for Dec 2012 is out. The anomaly was .269C.

I looked at HADCRUT3 in a previous post.

Here is a list of months with a warmer anomaly than Dec 2012 that came before 1990.

year month Anomaly
1878 2 0.395
1878 3 0.348
1878 4 0.334
1944 1 0.29
1944 9 0.295
1945 8 0.355
1958 1 0.277
1973 2 0.269
1979 12 0.357
1981 1 0.333
1981 12 0.269
1983 1 0.431
1983 2 0.313
1987 2 0.284
1987 12 0.316
1988 1 0.385
1988 3 0.275

HADCRUT3 Dec 2012 – Colder Than 1939,1981,1979,1987 etc – 18th Coldest

HADCRUT3 for Dec 2012 is out.

Dec 1939 was .112C warmer. And 1979 was warmer. And 1981. And 1987.

Notice how 2010, 2011 and 2012 are at the bottom of this list. Three cold Decembers in a row.

Here is the list of Decembers warmer or equal to Dec 2012.

year Dec
1997 0.533
2003 0.523
2006 0.523
1998 0.444
2009 0.427
2004 0.376
2005 0.37
1939 0.345
1979 0.33
2002 0.328
1999 0.327
2008 0.327
1987 0.326
2001 0.321
2010 0.267
2011 0.249
1981 0.238
2012 0.233

Extreme Weather In Canada – 1936 is tops using +10C or -10C

As a follow up to yesterdays post about monthly anomalies in Canada of +15C  or higher and -15C and colder, I thought I would take a look what happens if I set the bar at +10C  or -10C.

I am using Environment Canada Normals from their monthly summaries. The values are the anomaly from the 1971-2000 average (the Normals).

In 1936, 3.6% of the monthly anomalies were -10C or colder than normal. 

A -10C or lower deviation from normal for a whole month is definitely extreme! 

And notice 1982 is the most recent year to make the top 25.

Top 25 Cold Anomaly Months in a Year (by %)

Year Anomaly_Count Cold_Anomalies Hot_Anomalies Pct_Cold_Anomalies Pct_Hot_Anomalies
1936 2281 82 0 3.595 0
1907 555 17 0 3.063 0
1899 433 13 0 3.002 0
1950 3868 116 0 2.999 0
1896 374 11 0 2.941 0
1916 1332 36 0 2.703 0
1890 277 7 0 2.527 0
1904 525 10 0 1.905 0
1937 2361 40 0 1.694 0
1969 9771 159 5 1.627 0.051
1917 1349 21 1 1.557 0.074
1893 327 5 0 1.529 0
1979 13984 196 4 1.402 0.029
1891 272 3 0 1.103 0
1897 373 4 0 1.072 0
1982 14928 154 0 1.032 0
1933 2172 20 0 0.921 0
1939 2658 20 1 0.752 0.038
1922 1557 11 0 0.706 0
1966 8479 58 0 0.684 0
1911 674 4 1 0.593 0.148
1951 4120 24 0 0.583 0
1955 4756 27 0 0.568 0
1954 4592 26 1 0.566 0.022
1930 2025 11 2 0.543 0.099

Hot Anomalies are much rarer.

Only .688% of the anomalies were 10C or higher in 2006. Thats less than 1/5th of the largest percentage of cold anomalies. It was also 6 years ago.

Top 25 Hot Anomaly Months in a Year (by %)

Year Anomaly_Count Cold_Anomalies Hot_Anomalies Pct_Cold_Anomalies Pct_Hot_Anomalies
2006 6979 12 48 0.172 0.688
1931 2054 0 12 0 0.584
2001 9869 1 37 0.01 0.375
2010 5367 0 18 0 0.335
1981 14717 0 46 0 0.313
1926 1832 0 4 0 0.218
1947 3376 0 7 0 0.207
1977 13502 8 27 0.059 0.2
1943 3175 1 5 0.031 0.157
1911 674 4 1 0.593 0.148
1919 1403 2 2 0.143 0.143
1998 10503 0 15 0 0.143
1942 2977 1 4 0.034 0.134
1985 15582 84 20 0.539 0.128
2004 8159 0 9 0 0.11
2002 9206 42 10 0.456 0.109
1930 2025 11 2 0.543 0.099
1944 3280 1 3 0.03 0.091
1960 5870 0 5 0 0.085
2012 3750 2 3 0.053 0.08
2005 7581 0 6 0 0.079
1917 1349 21 1 1.557 0.074
1958 5466 0 4 0 0.073
1997 10891 2 8 0.018 0.073
1949 3693 11 2 0.298 0.054