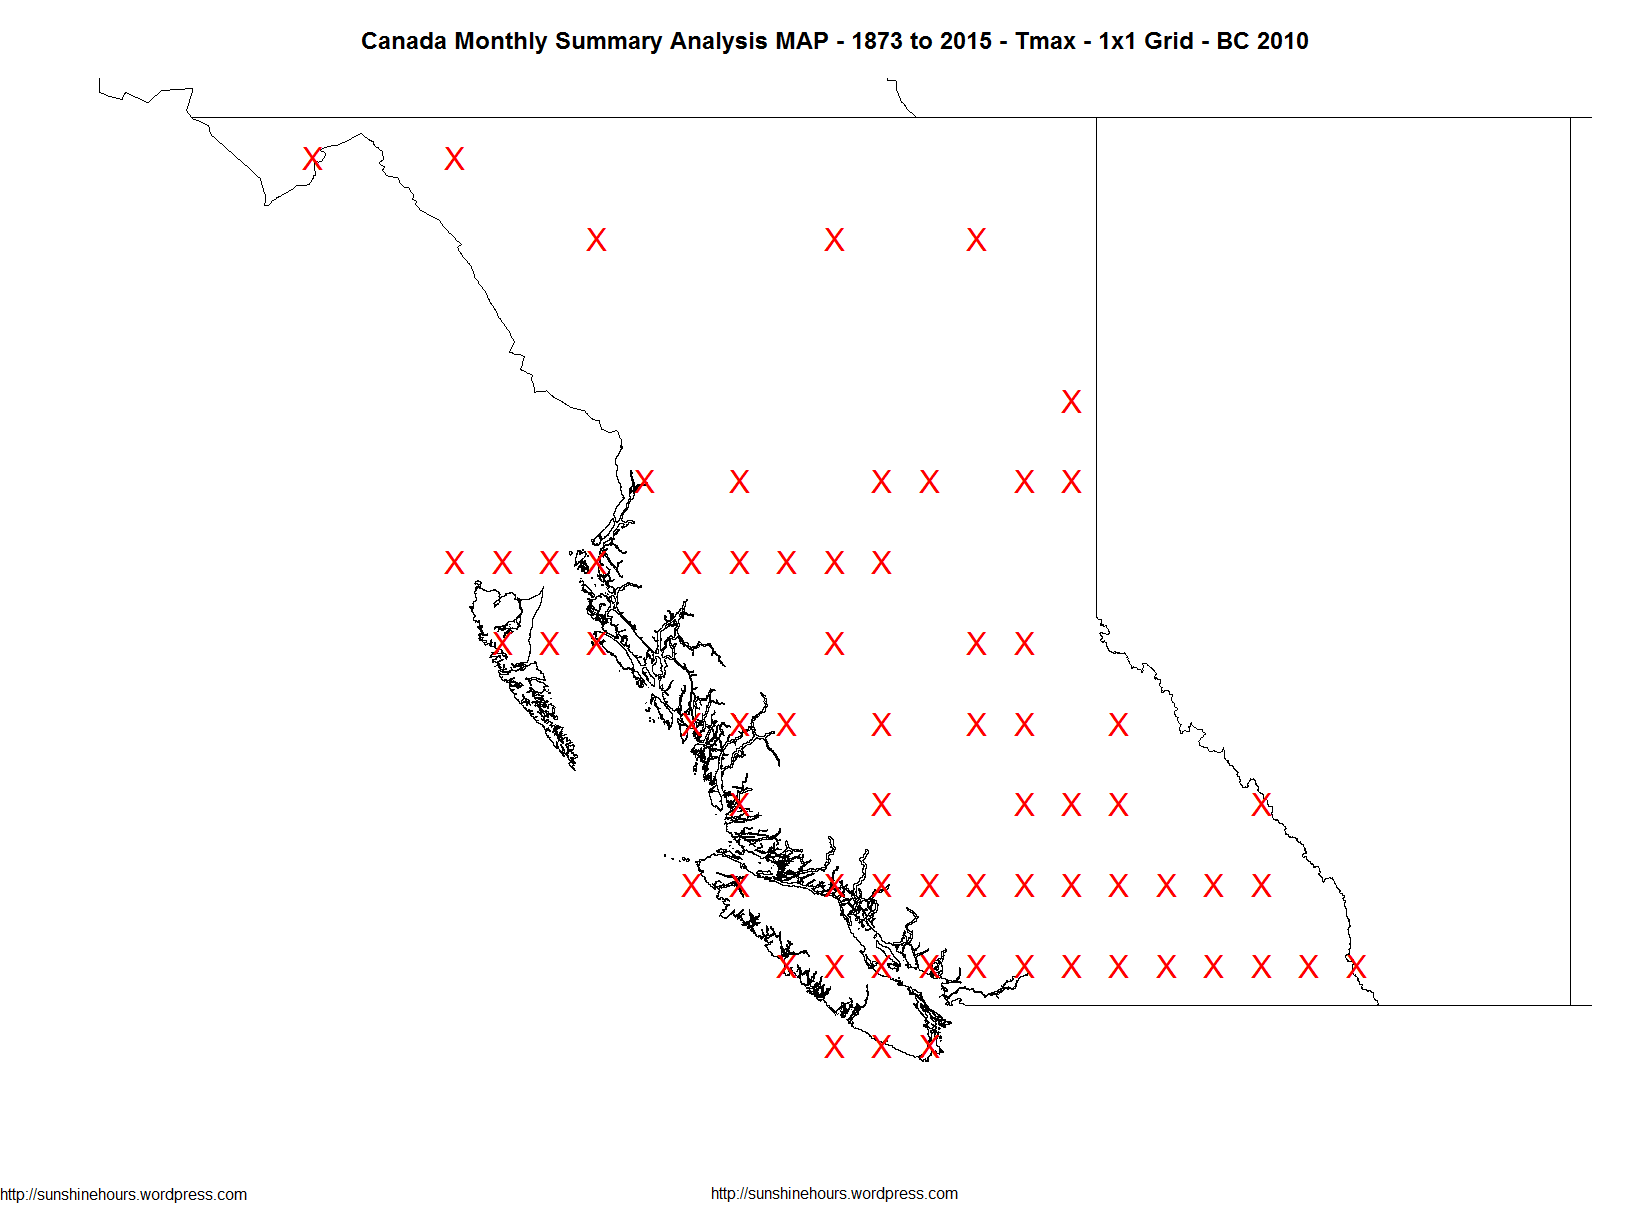
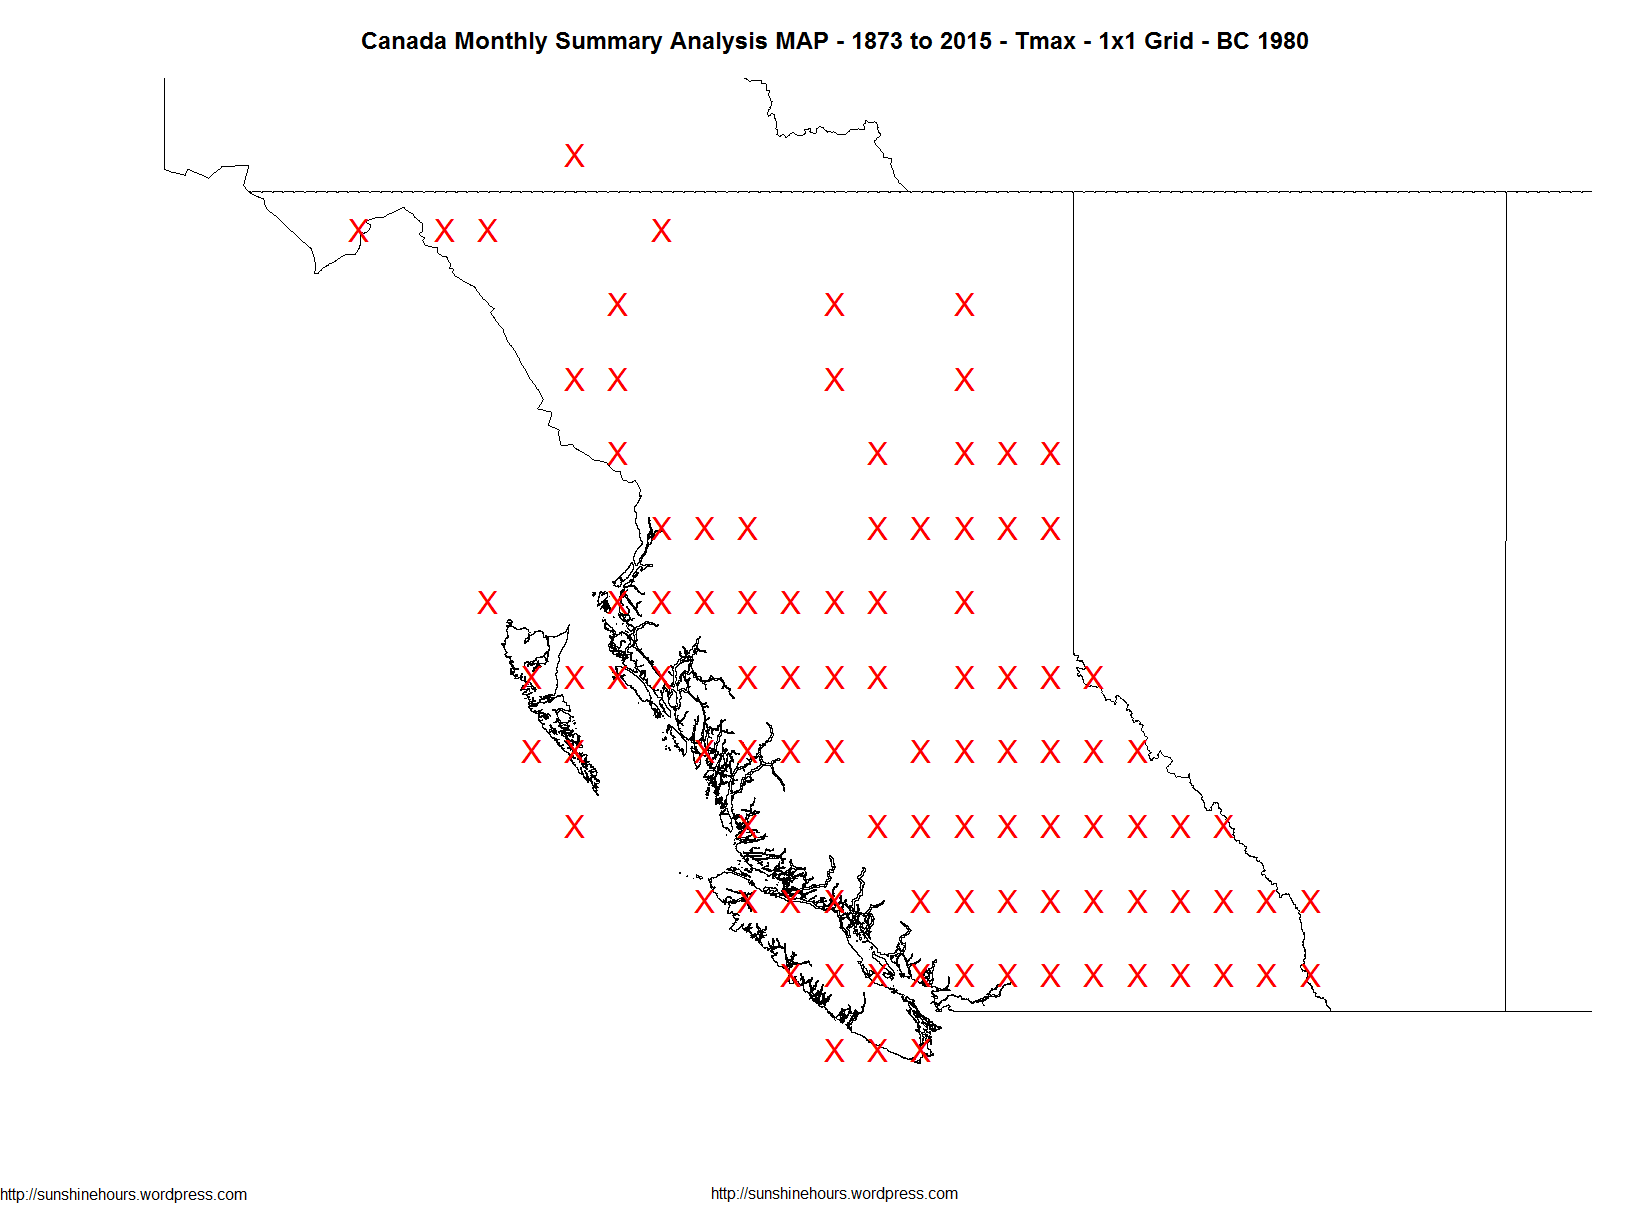
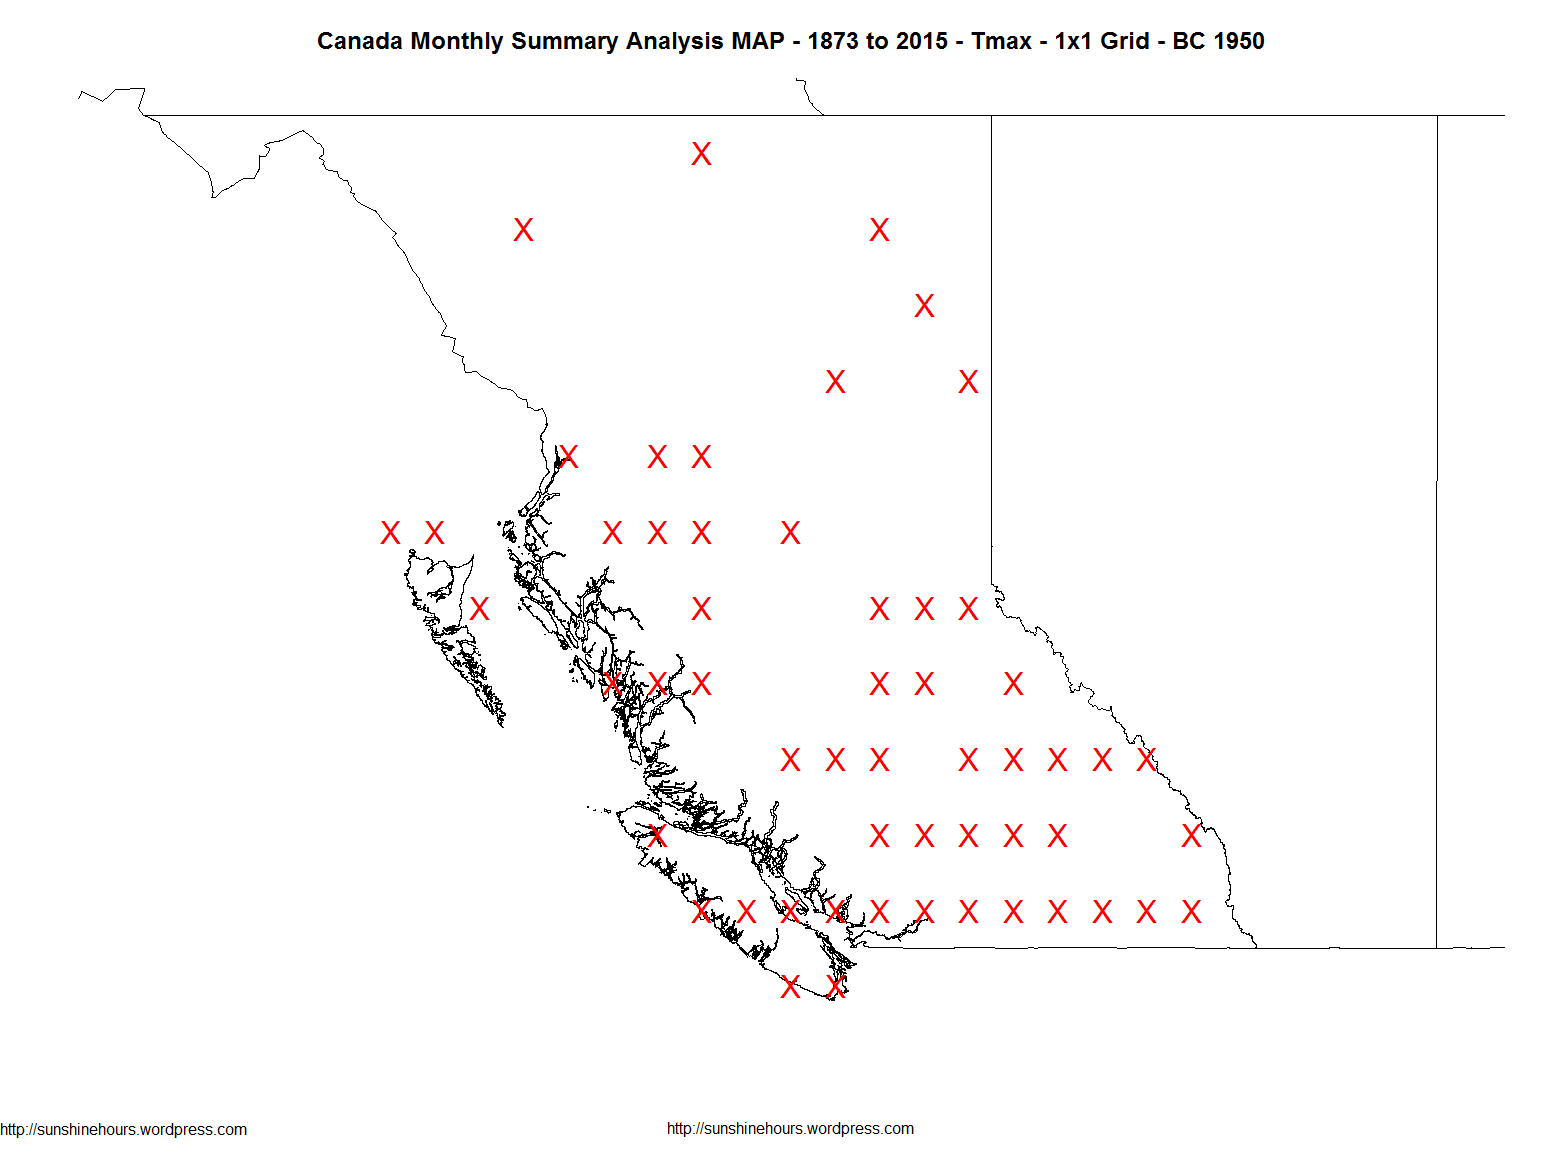
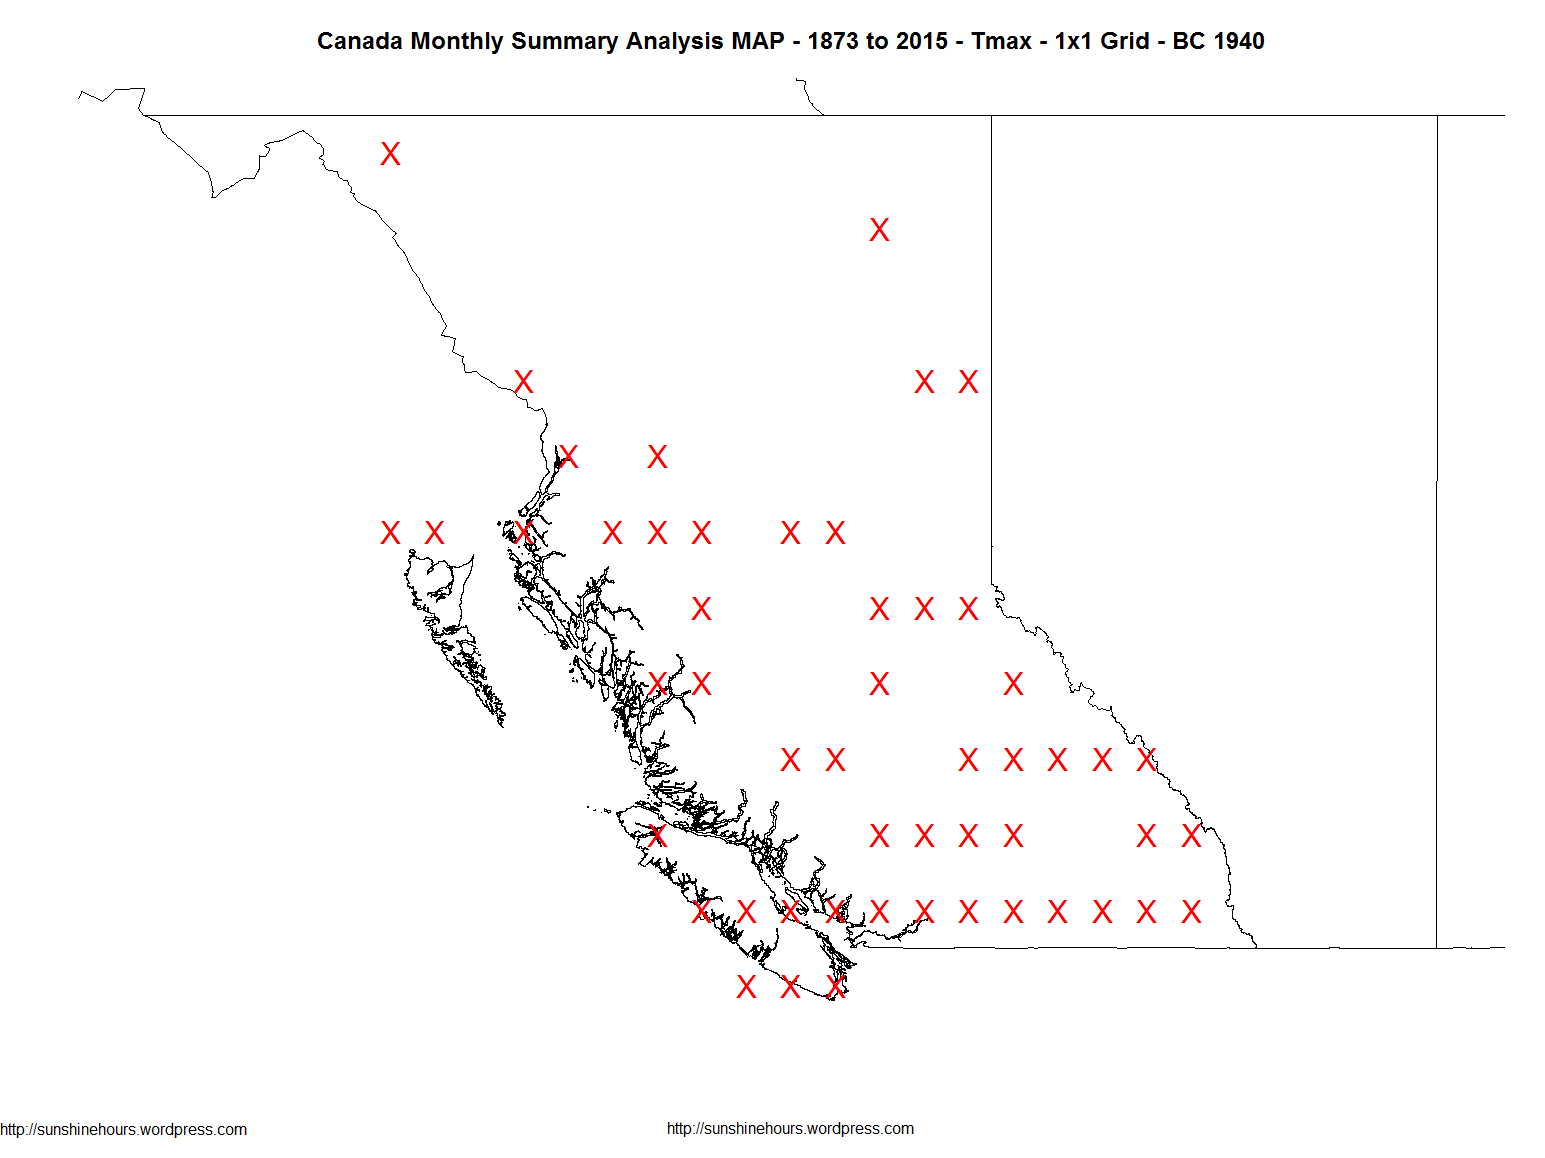
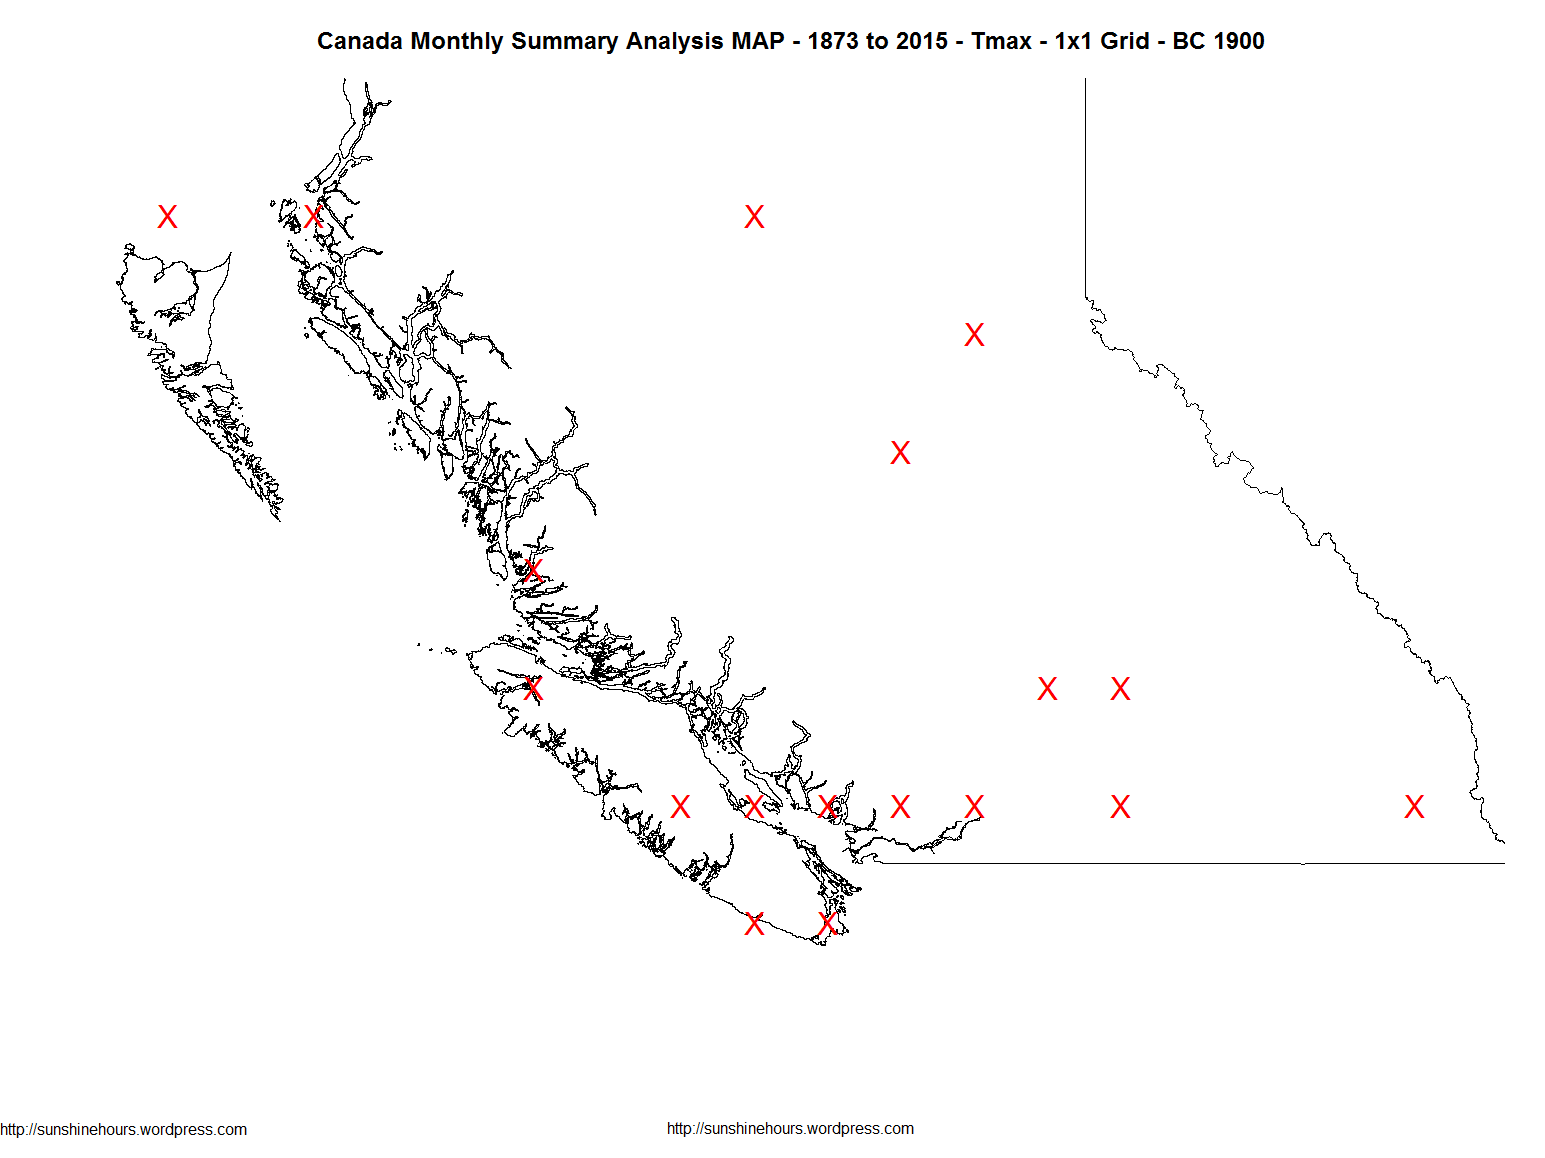
This a followup to this post: British Columbia Canada Tmax , Tmin and Tmean from 1873 (On 1×1 Grid)
The following maps show which grid cells (apprximately) had data in a few key years.
This a followup to this post: British Columbia Canada Tmax , Tmin and Tmean from 1873 (On 1×1 Grid)
The following maps show which grid cells (apprximately) had data in a few key years.
This is the Alberta followup the BC post. You can read the explnations.
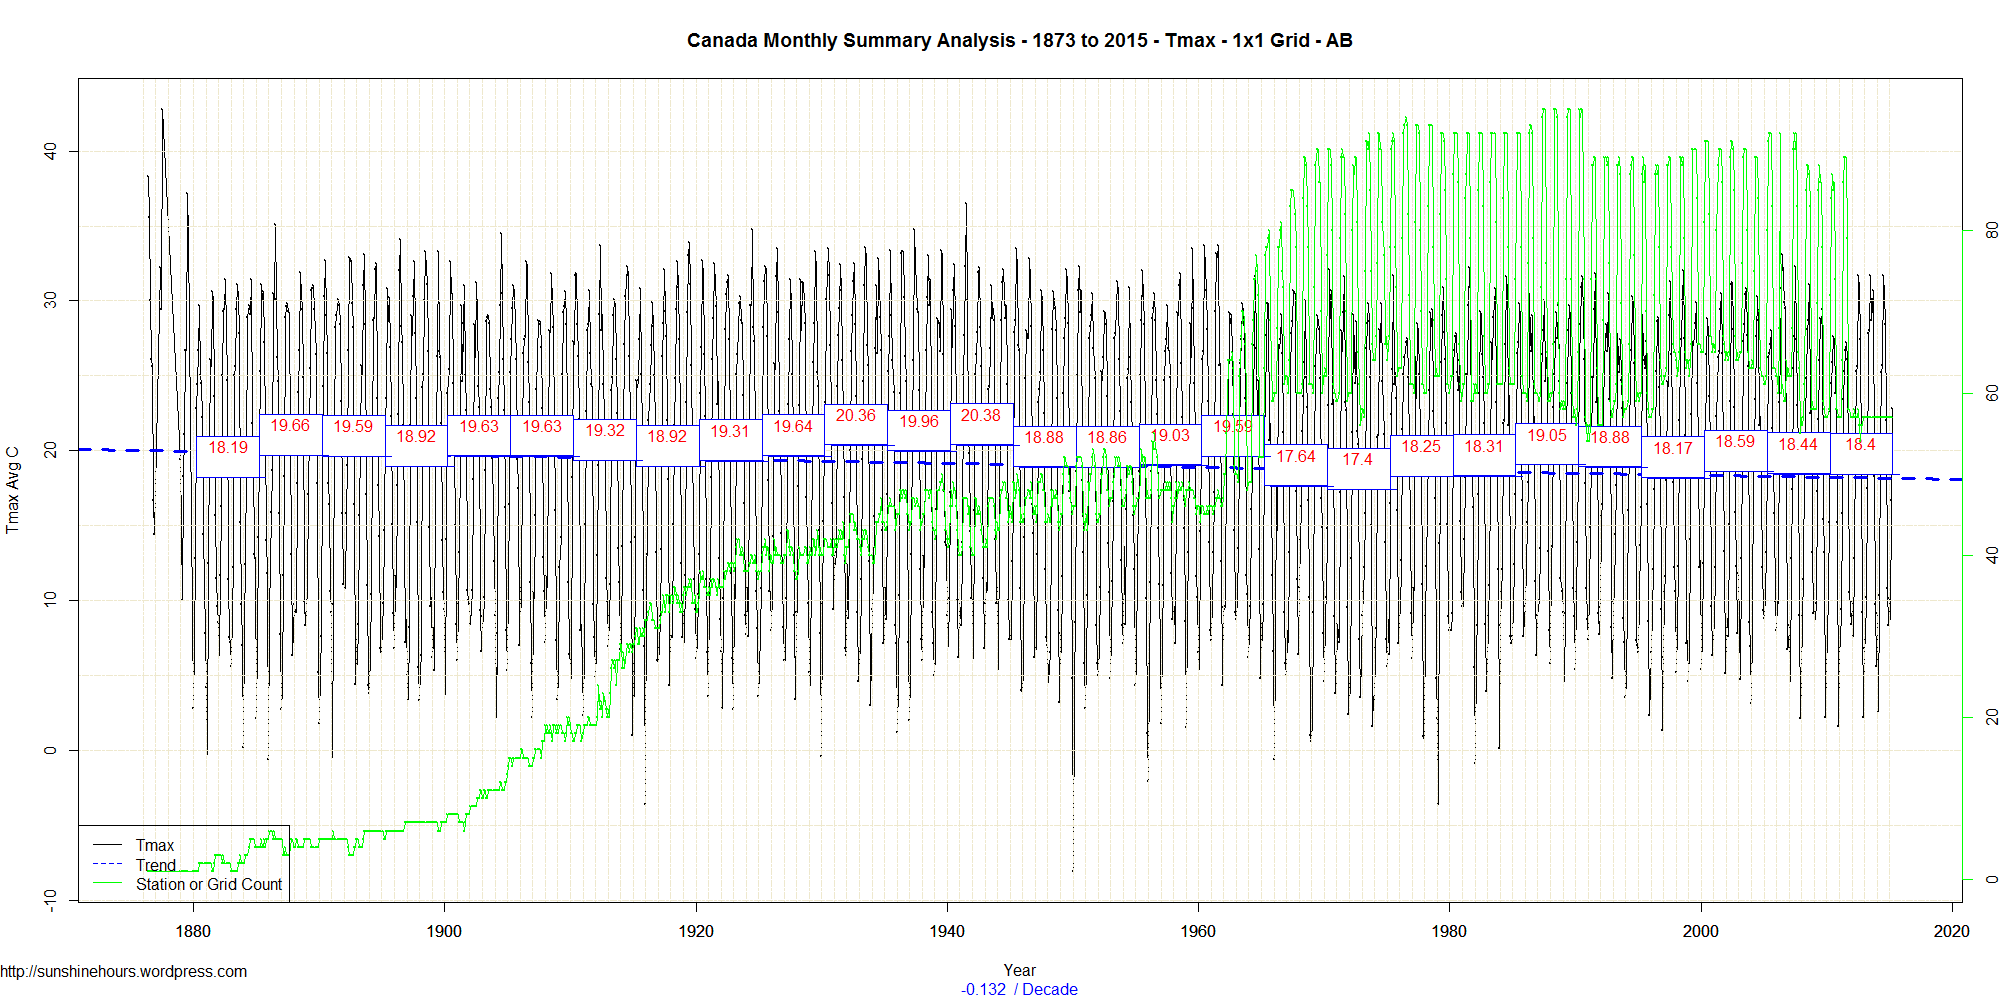
In the terms of Tmax the coldest period in Alberta (using 5 year means) was 1972-1976.
The warmest period was 1940 – 1944. In fact it was 2C warmer in 1940-1944 than 2011 – 2015. (The 1930s were just slightly cooler than the early 40s)
You may ask why the green line of grid counts goes up and down so much. It appears there are many more stations reporting in May/Jun/Jul/Aug/Sep than in the winter.
Tmax
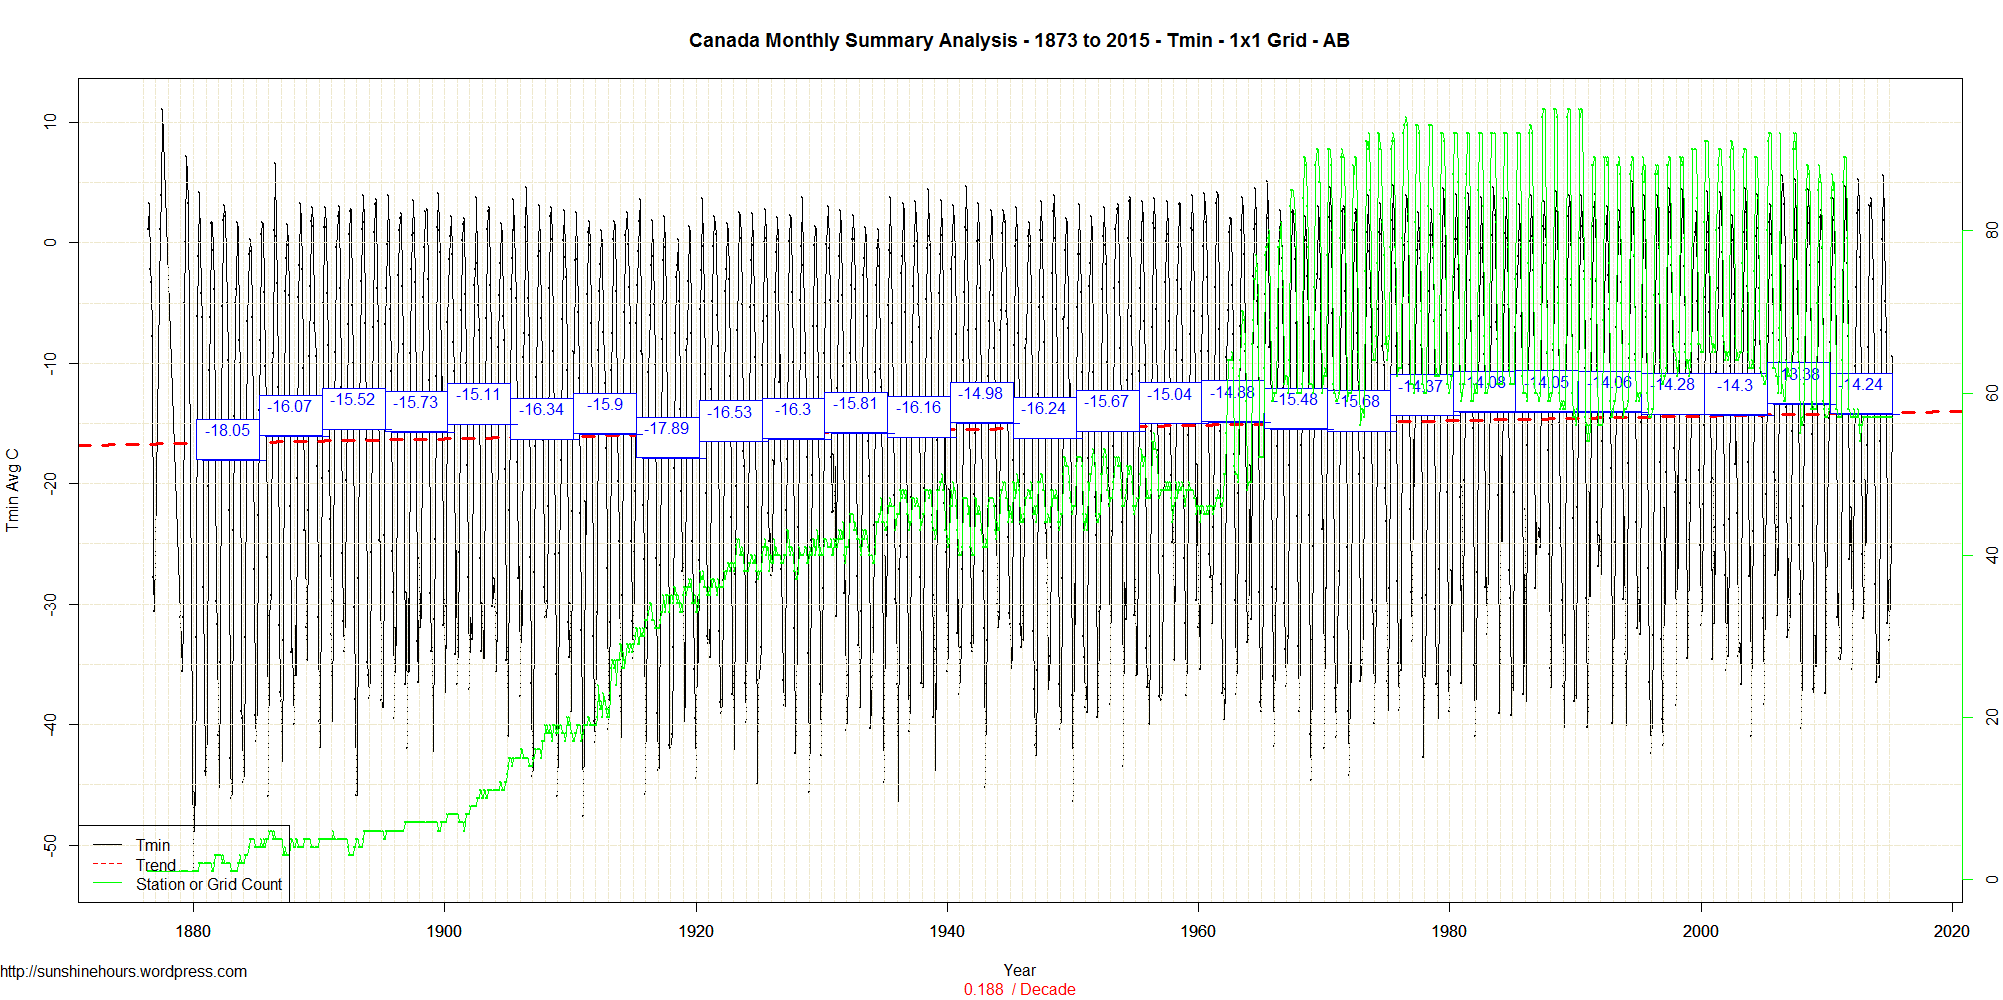
Tmin
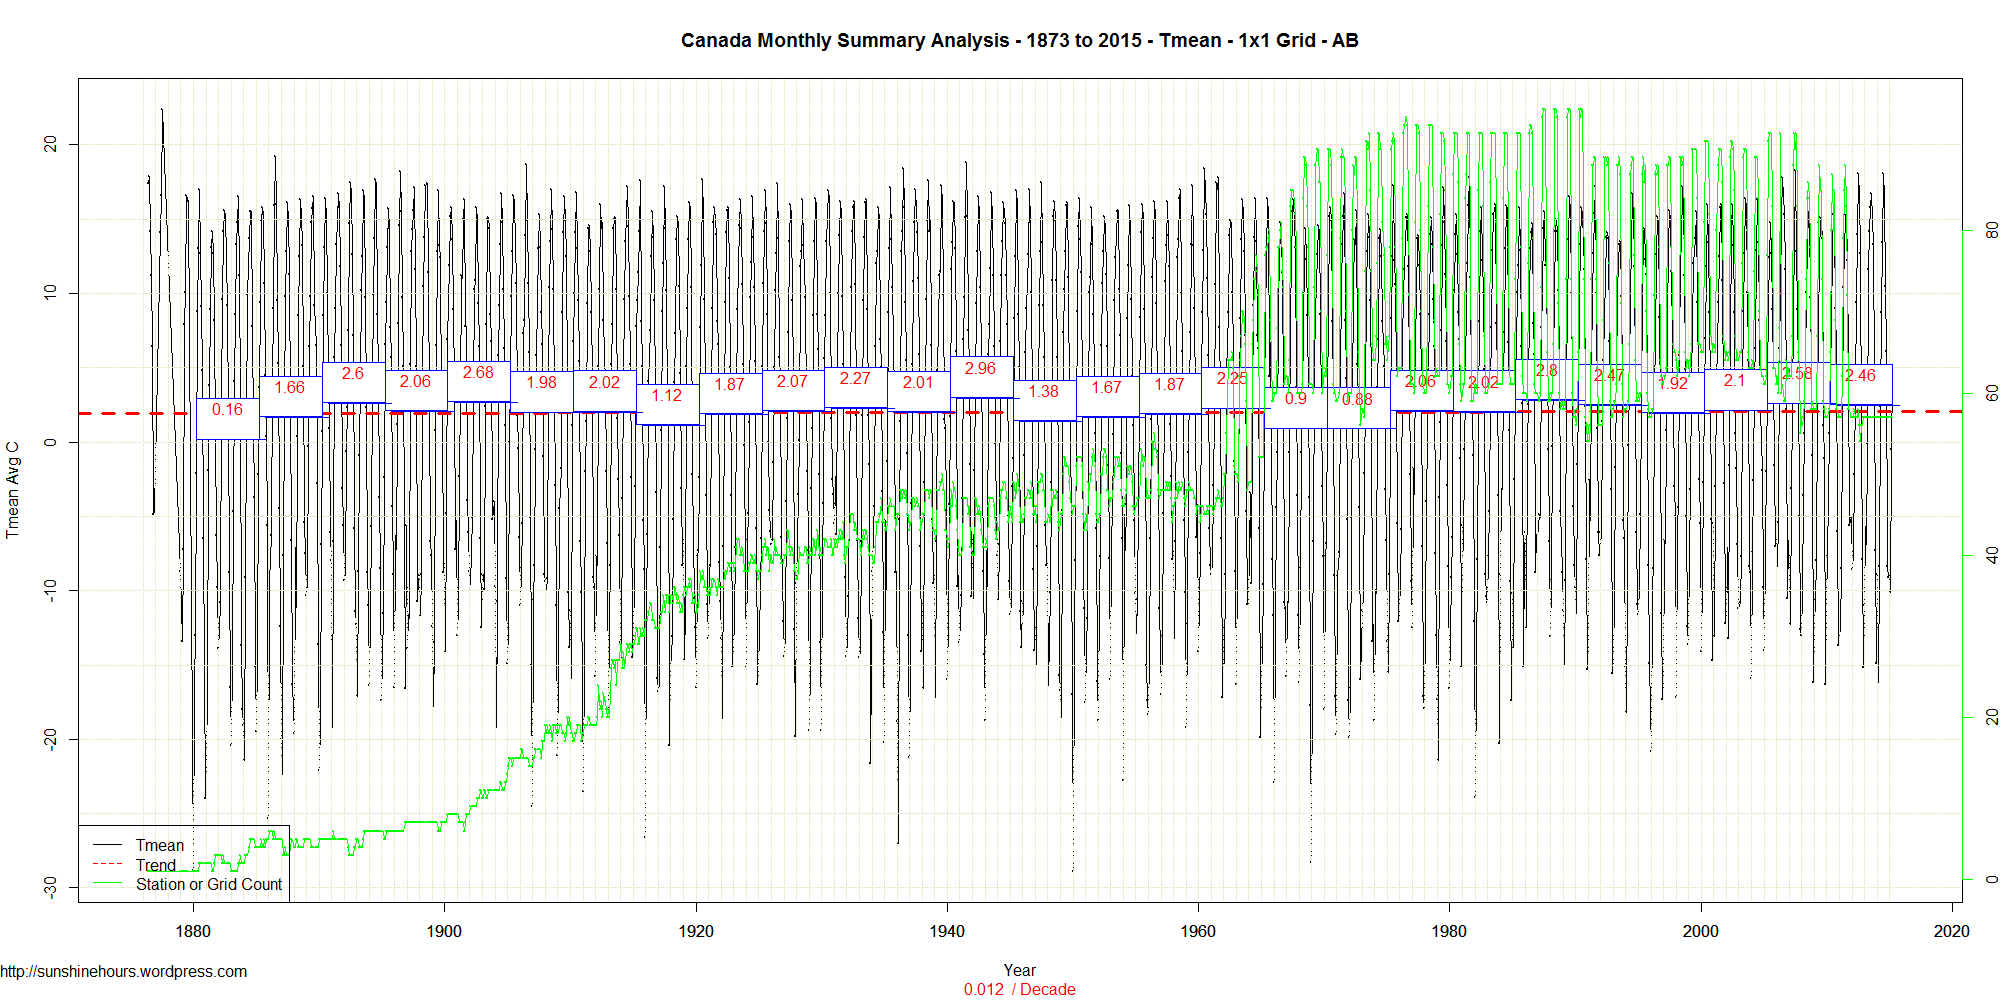
Tmean
Click for larger:
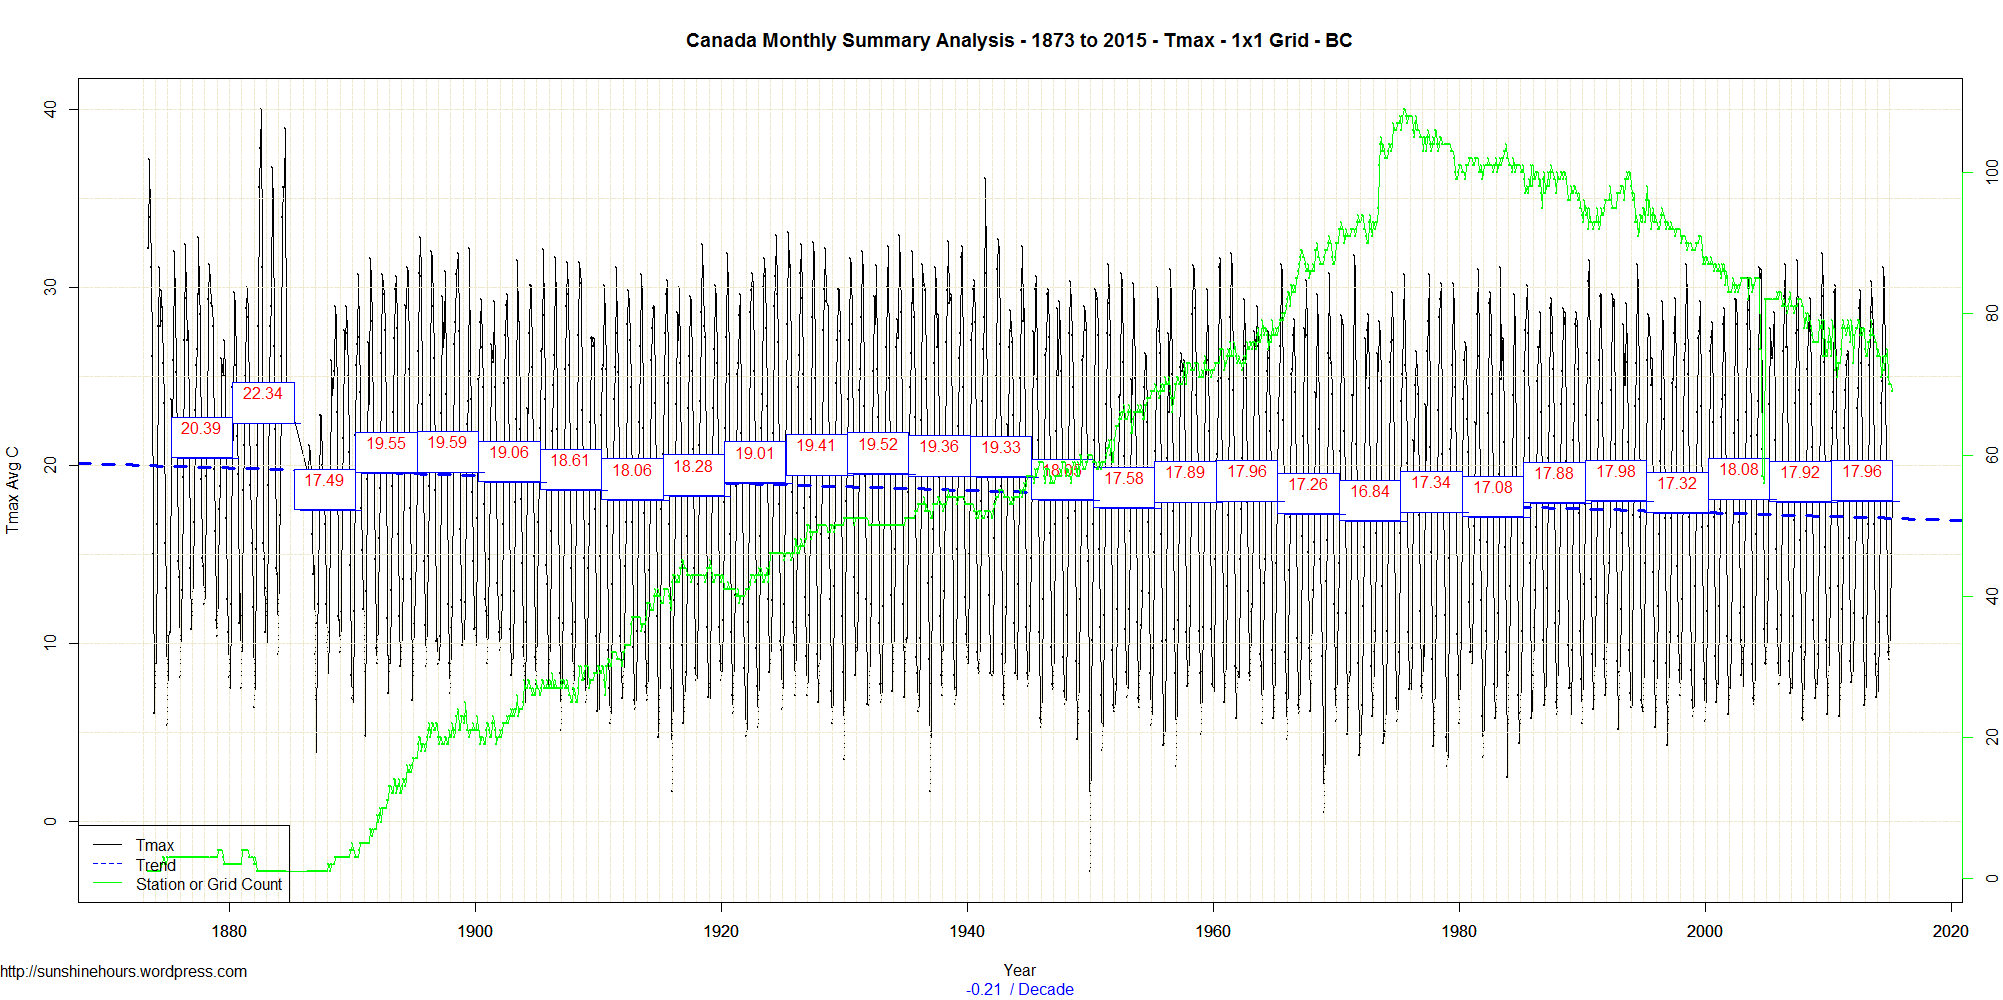
Step 1: Use Data from Environment Canada’s monthly summaries.
Step 2: Summarize the data by 1×1 grid square so no region dominates.
Step 3: Graph Tmax, Tmin and Tmean.
The black line is the monthly data. The blue boxes contain the 5 year mean (and I set the 5 year period by just going back from the most recent data in 5 year increments)
The green line is the number of 1×1 grid squares. The blue dashed line is the trend from 1873 (which is the earliest data).
(I won’t count the pre-1900 data as too important since there were so few stations)
Tmax was 1.5C warmer in the the 1920s/30s/40s than now.
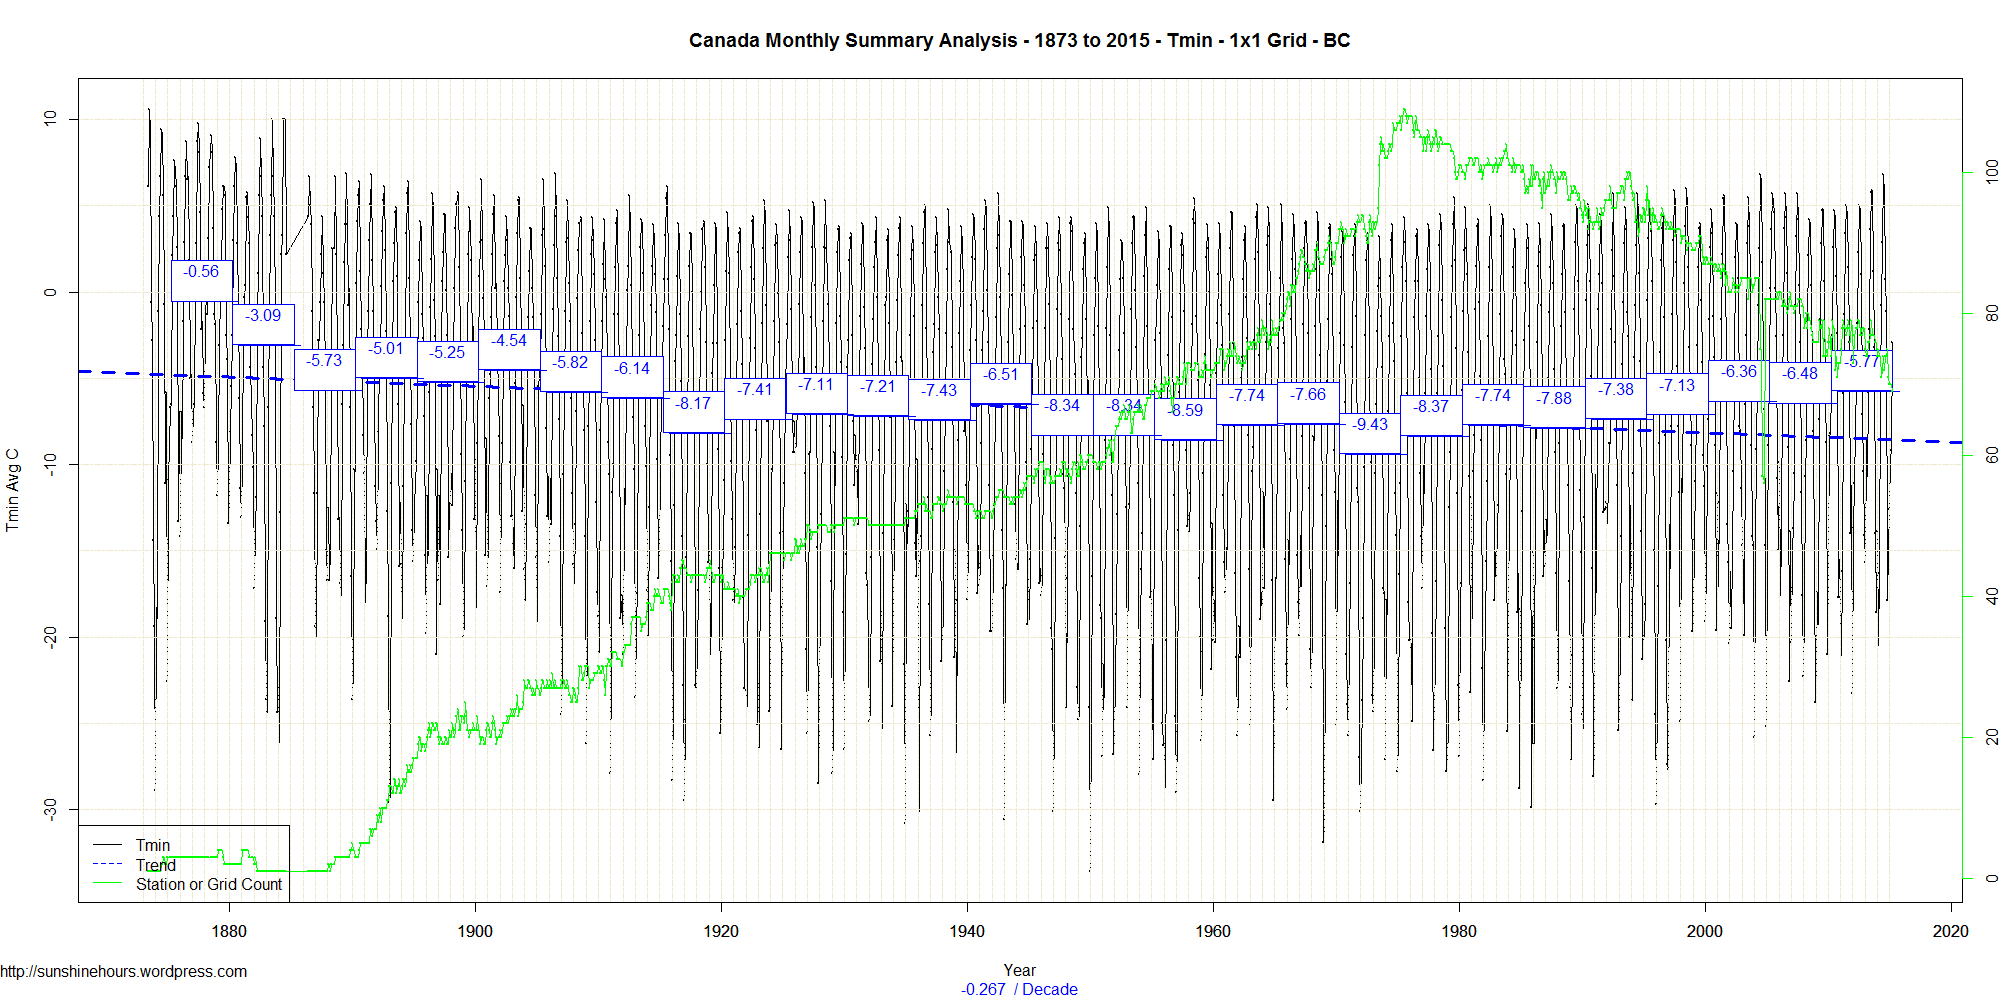
Tmin now is the hottest its been since 1900.
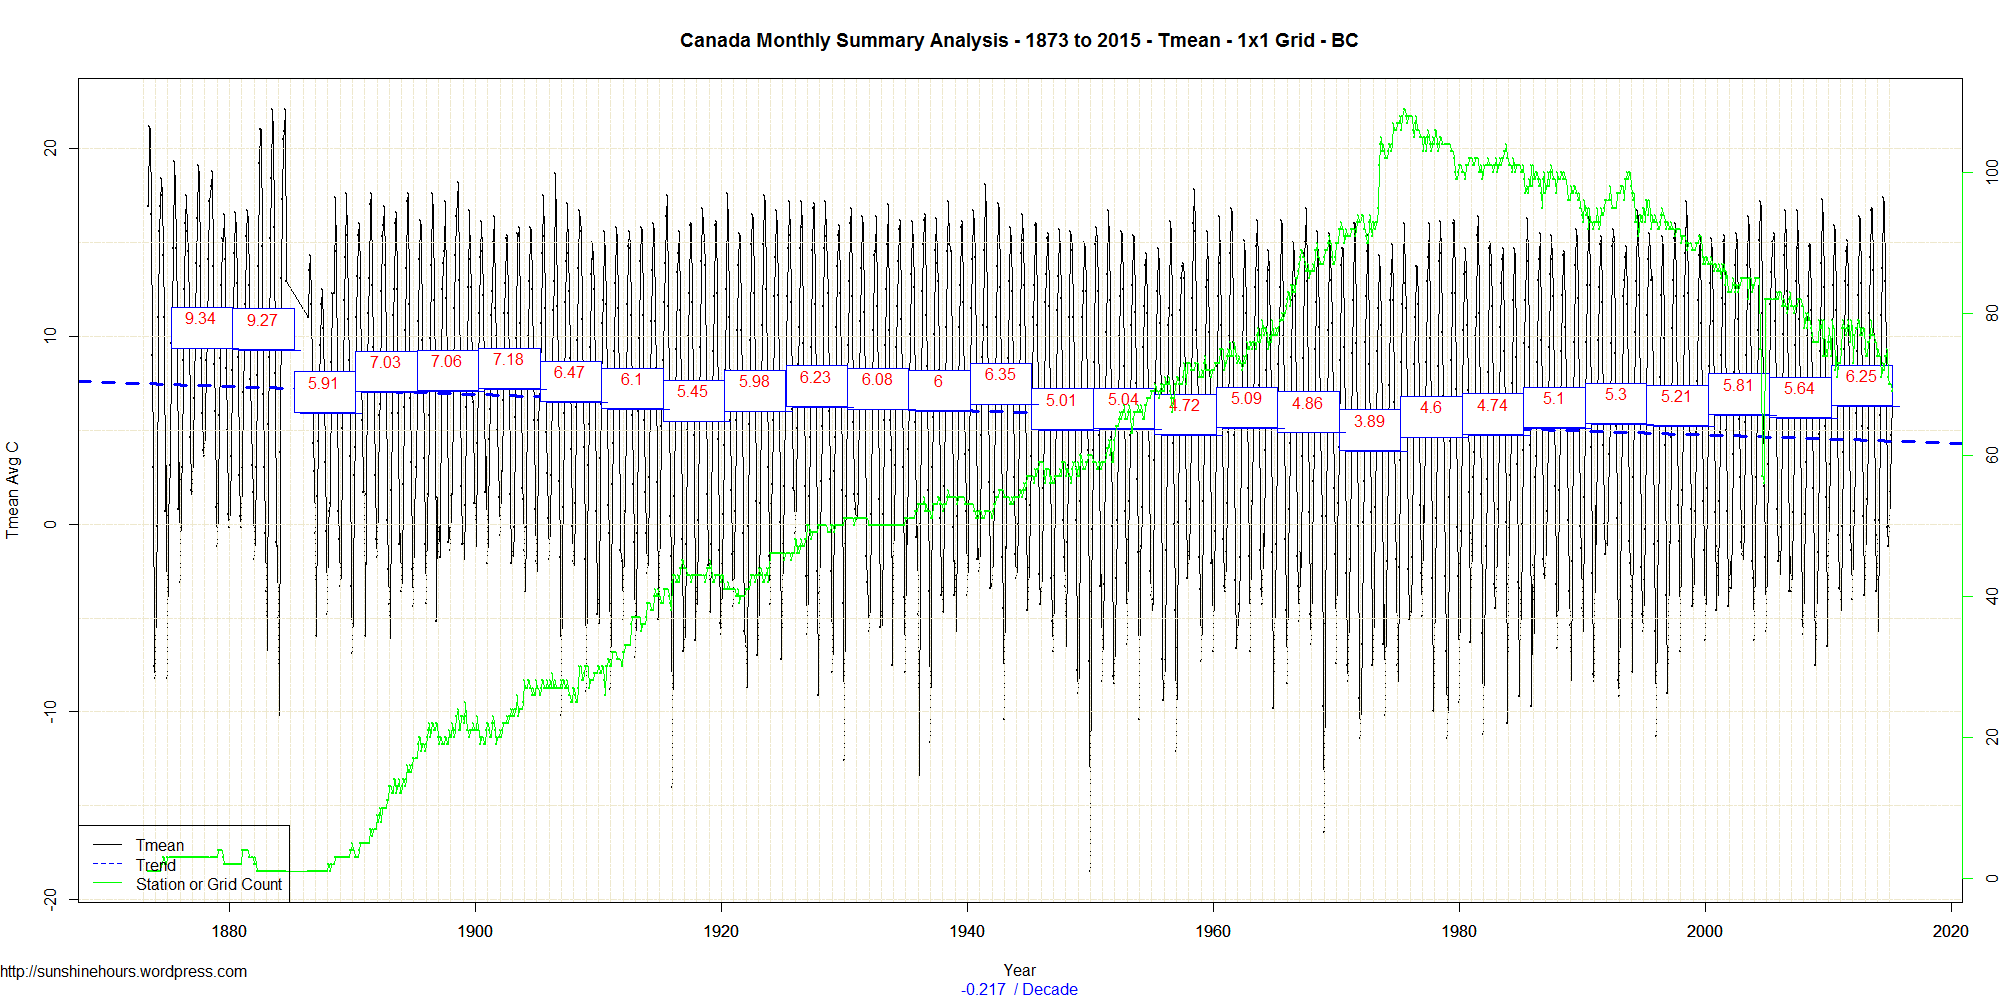
Tmean in the early 40s was slightly warmer than now.
Tmean/Tmin has been warming since 1970 thanks to Tmin … not Tmax.
Click for larger:
Tmax
Tmin
Tmean
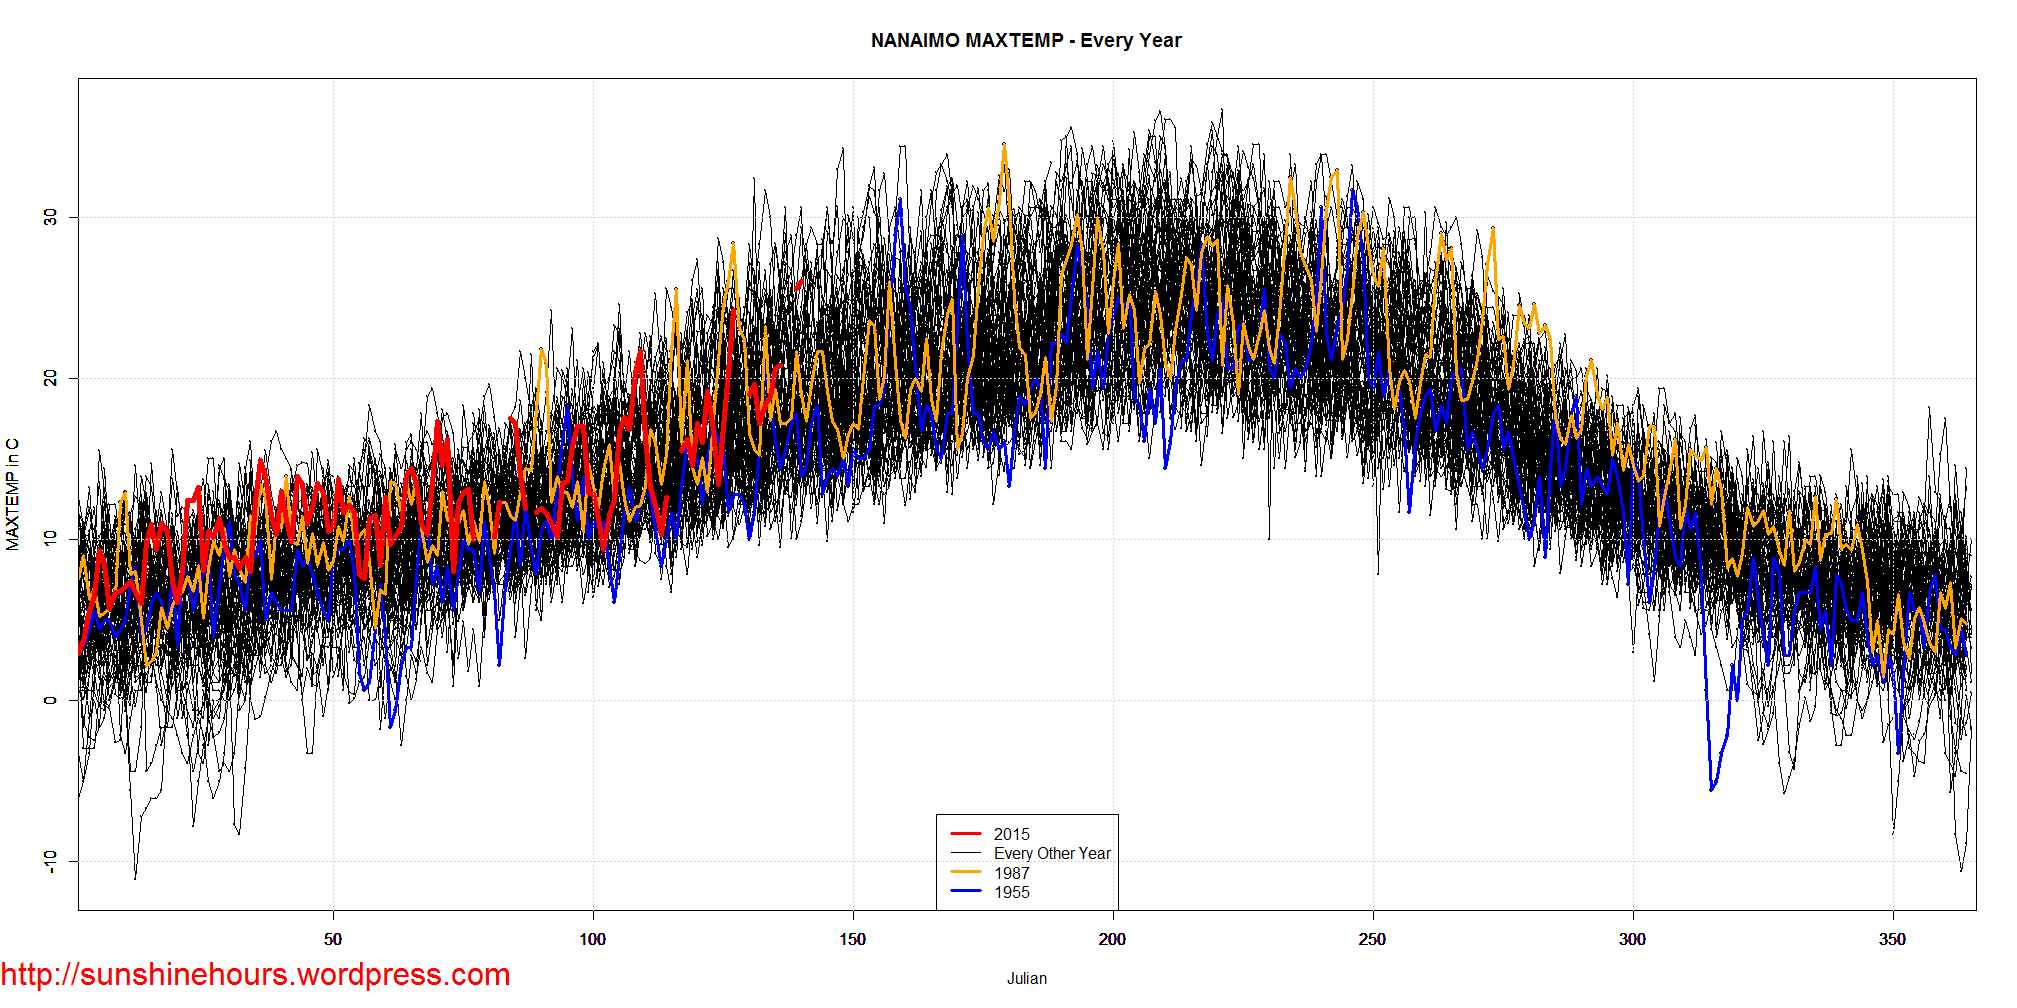
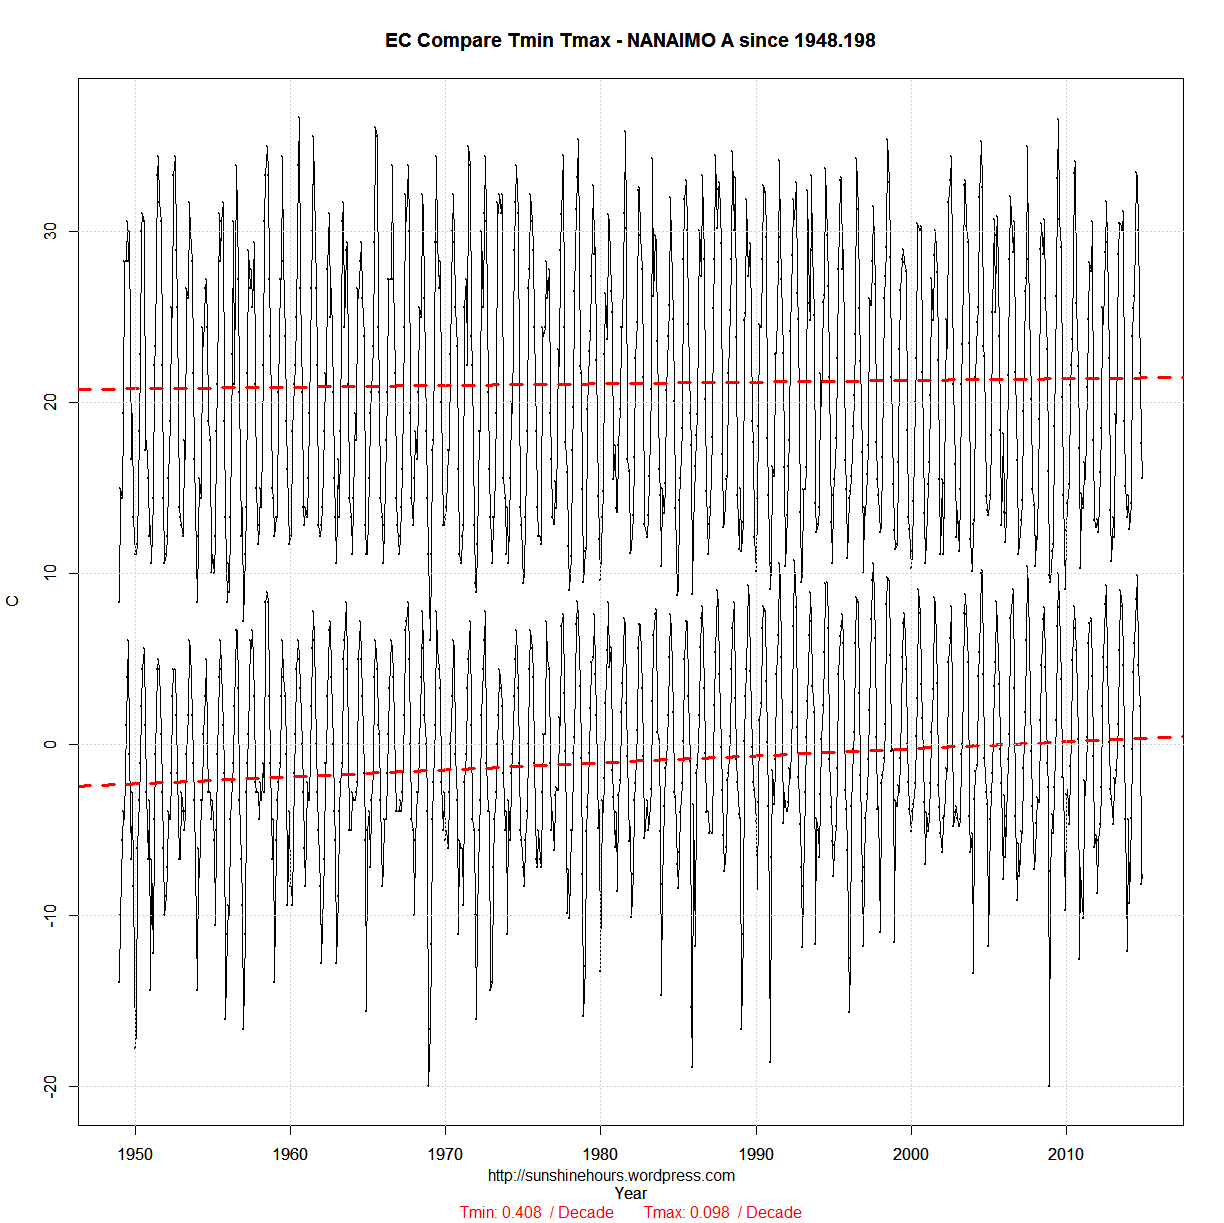
Every once in a while I visit the data for the weather station closest to my hometown on the west coast of Canada.
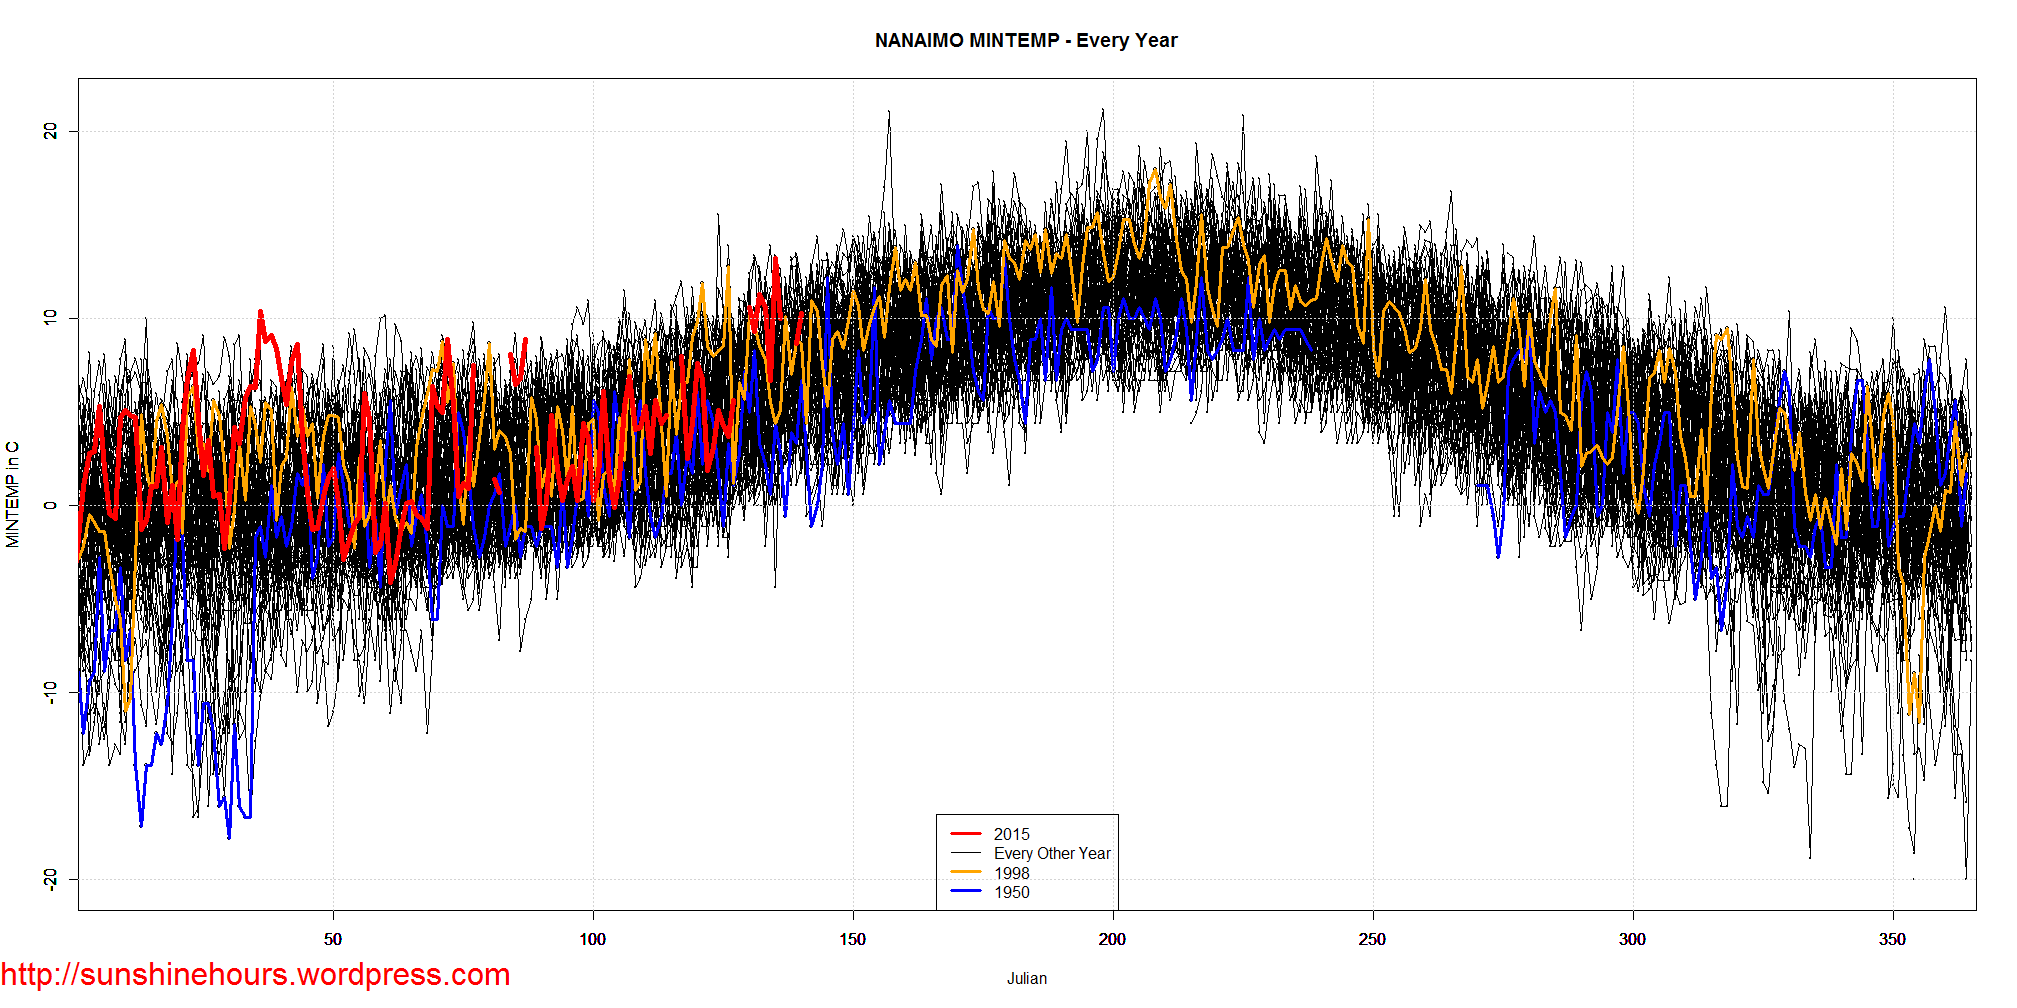
Today I am looking at daily TMAX data from Nanaimo Airport (1947 – 2015).
1987 was the warmest year (1958 was 2nd warmest FYI) . 1955 was the coldest They are shown as the orange and blue lines.
Here I have graphed all the available data in the style I usually use for Sea Ice data.
2015 is in red. There are gaps because Environment Canada doesn’t seem to care.
Notice that temps can fluctuate by 20C for the same day in different years.
Ponder this … why can we humans (and crops and animals) adapt to 20C swings but we can’t adapt to a 1C change over 100 years?
Click graph for larger.
Update: I added Tmin
Using Environment Canada’s monthly summaries.
And selecting stations with ‘Normals’ (anomalies from 1981 – 2010) and 90% of the datapoints.
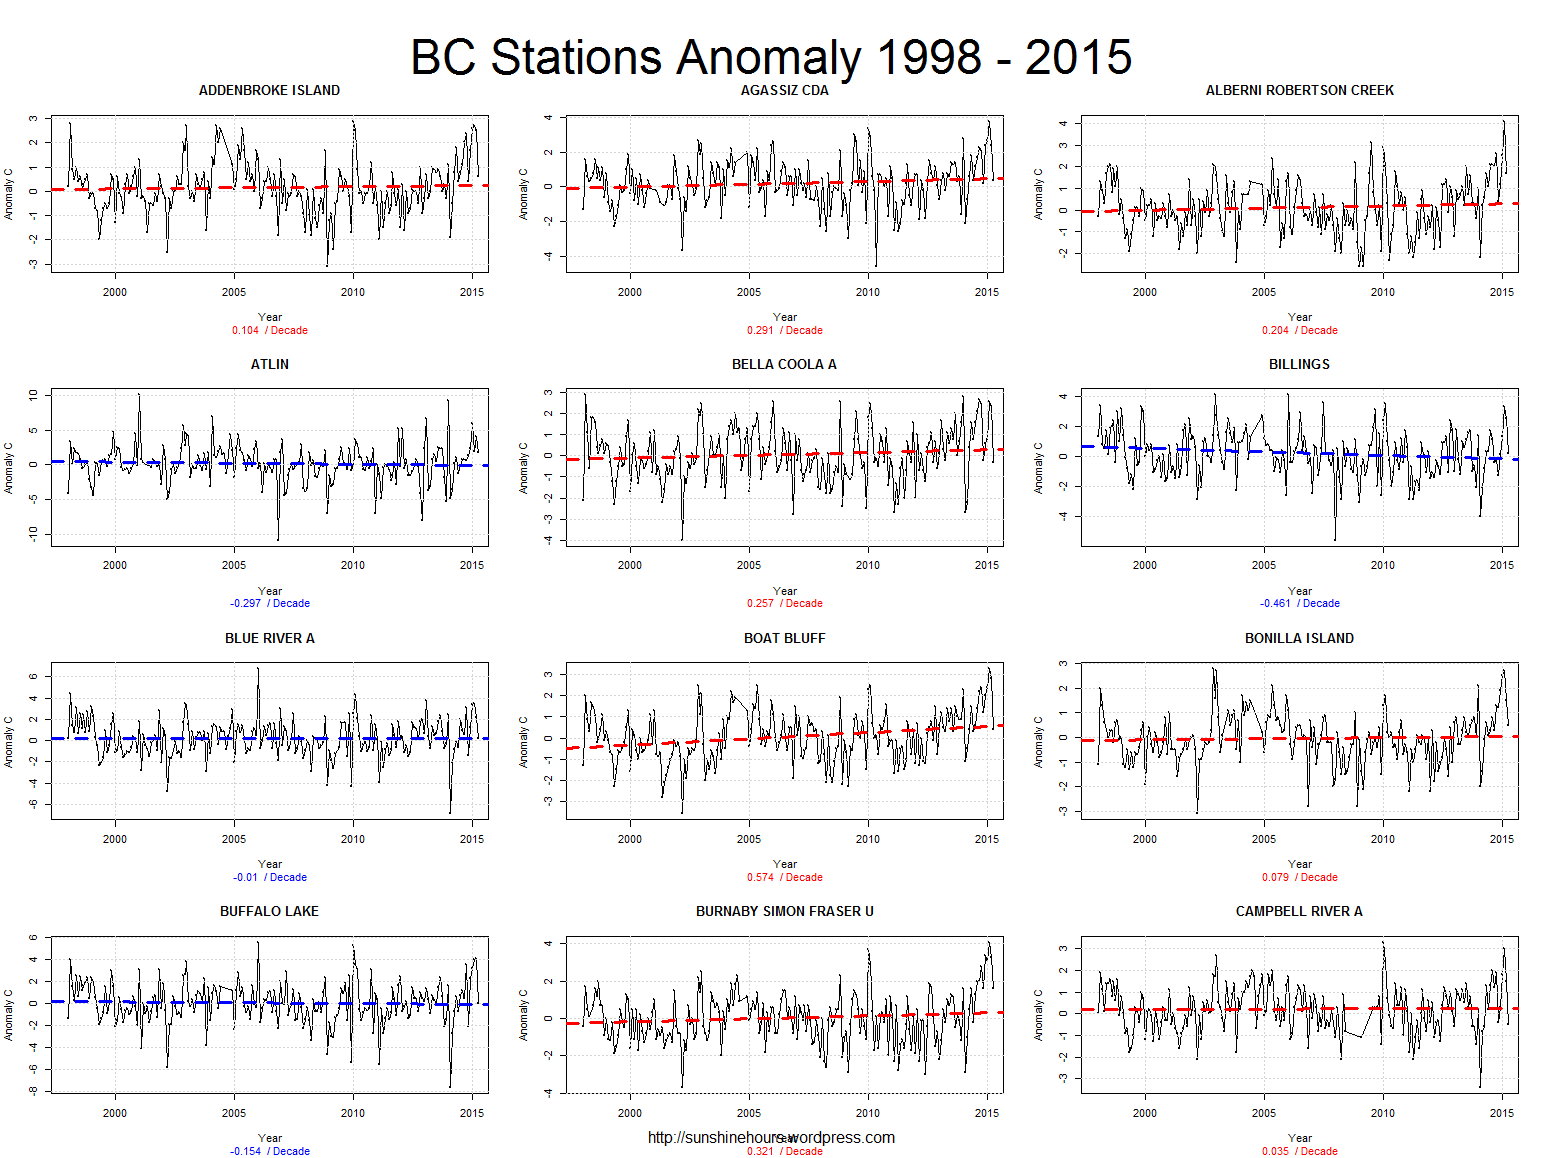

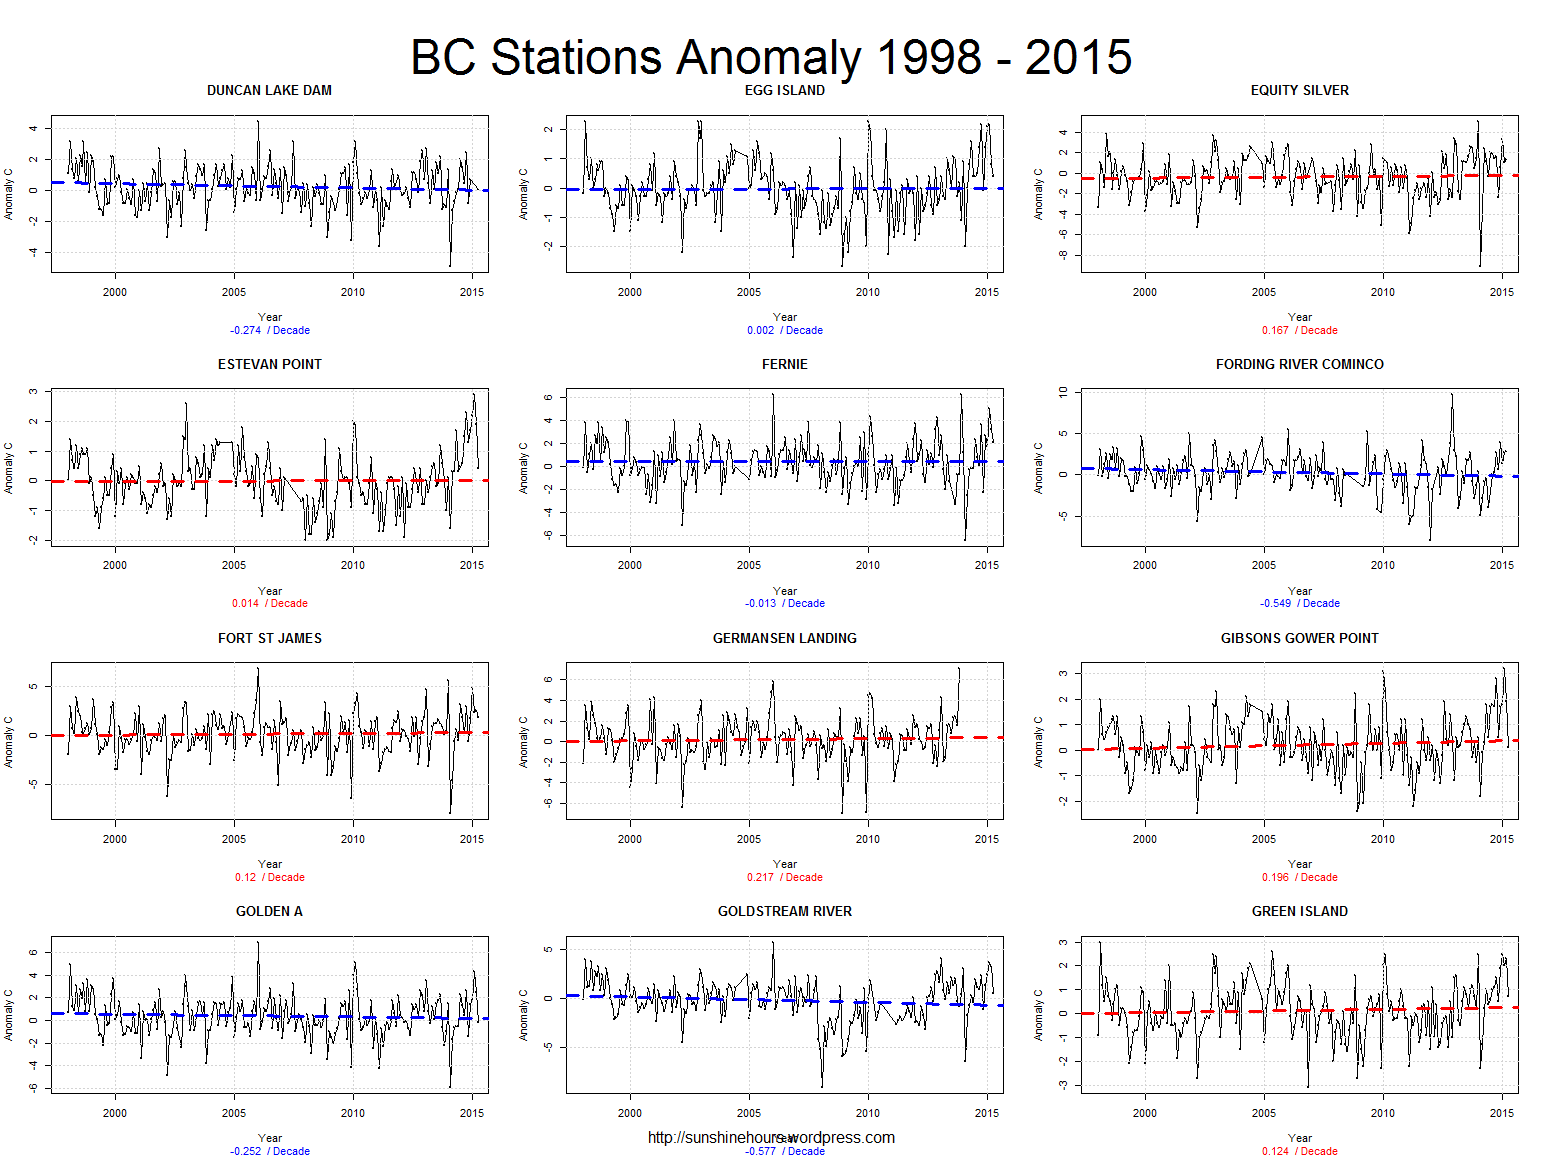

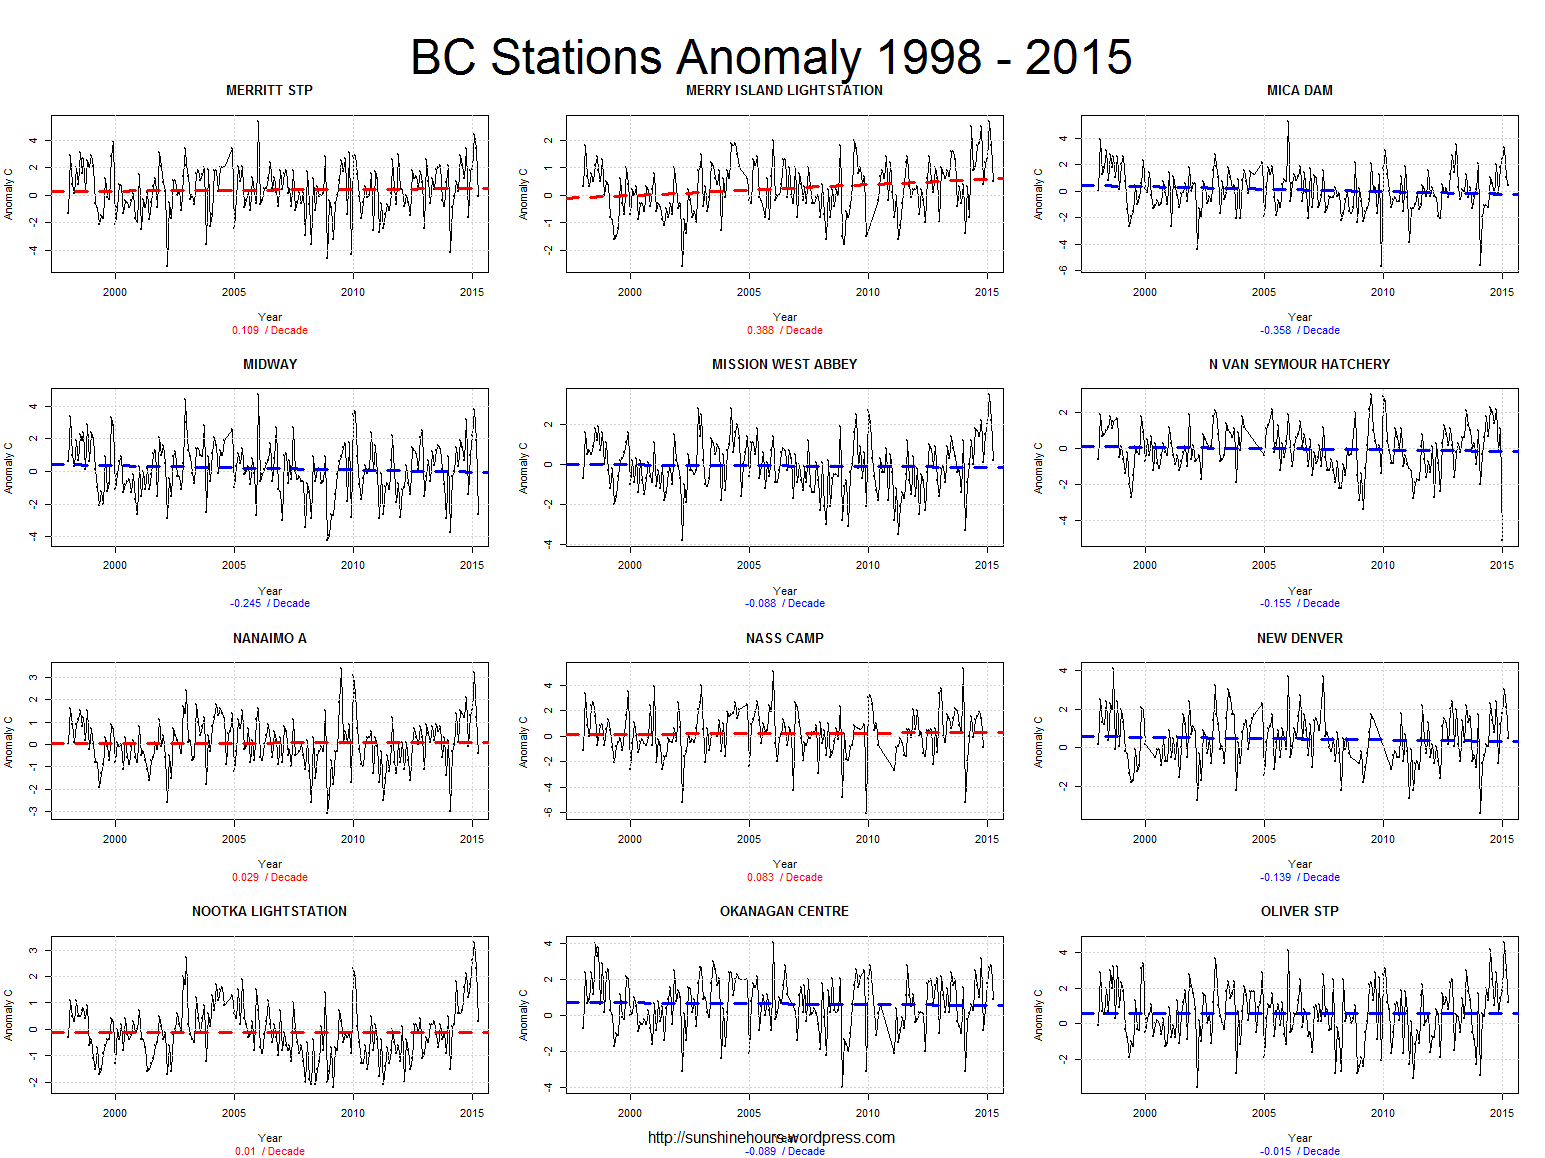
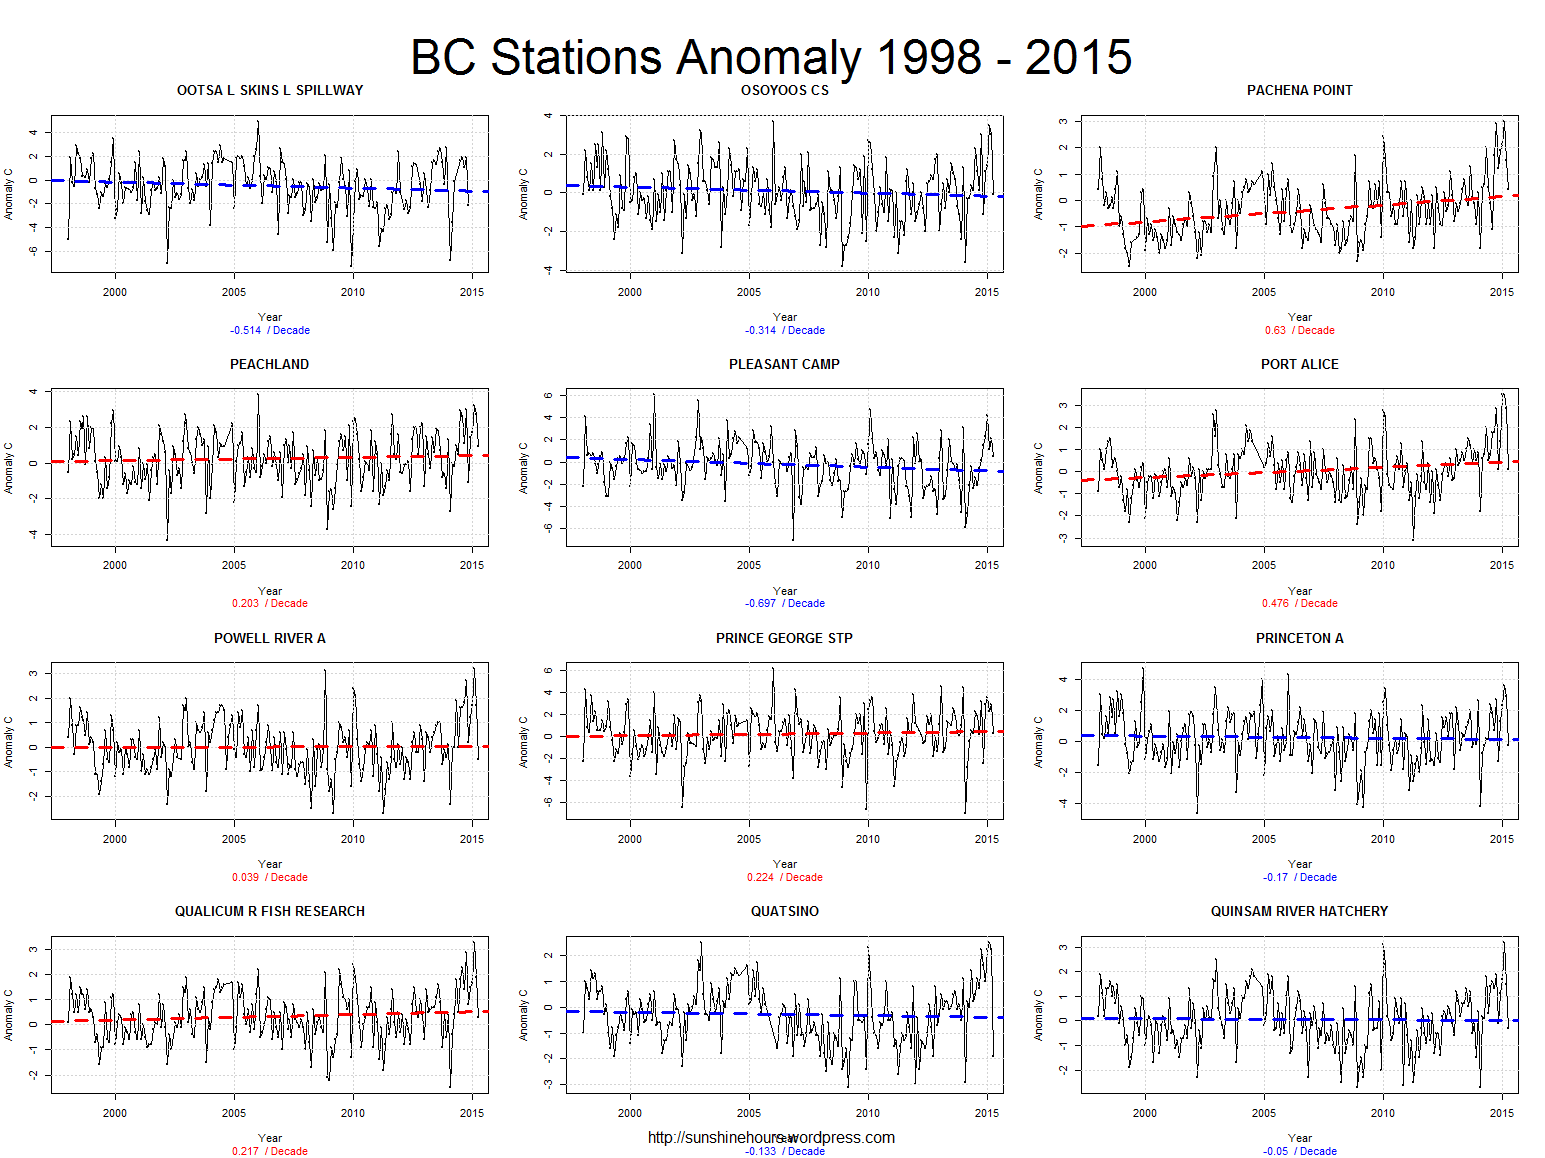
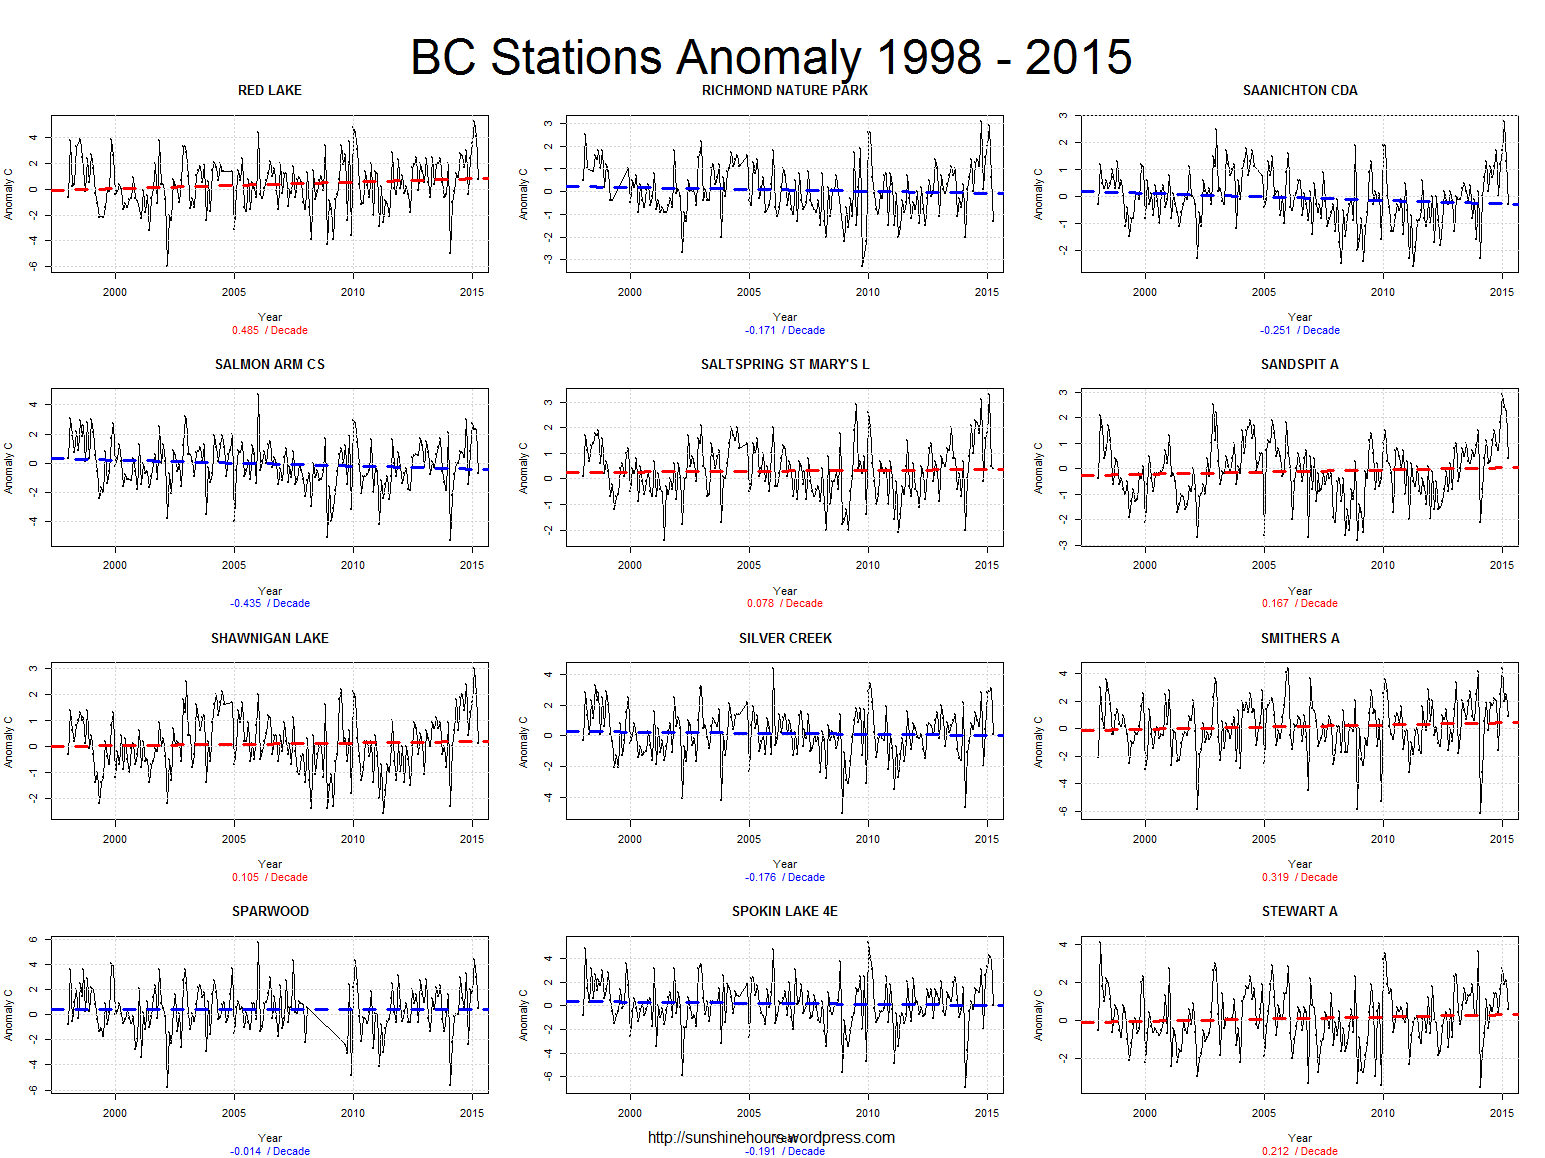
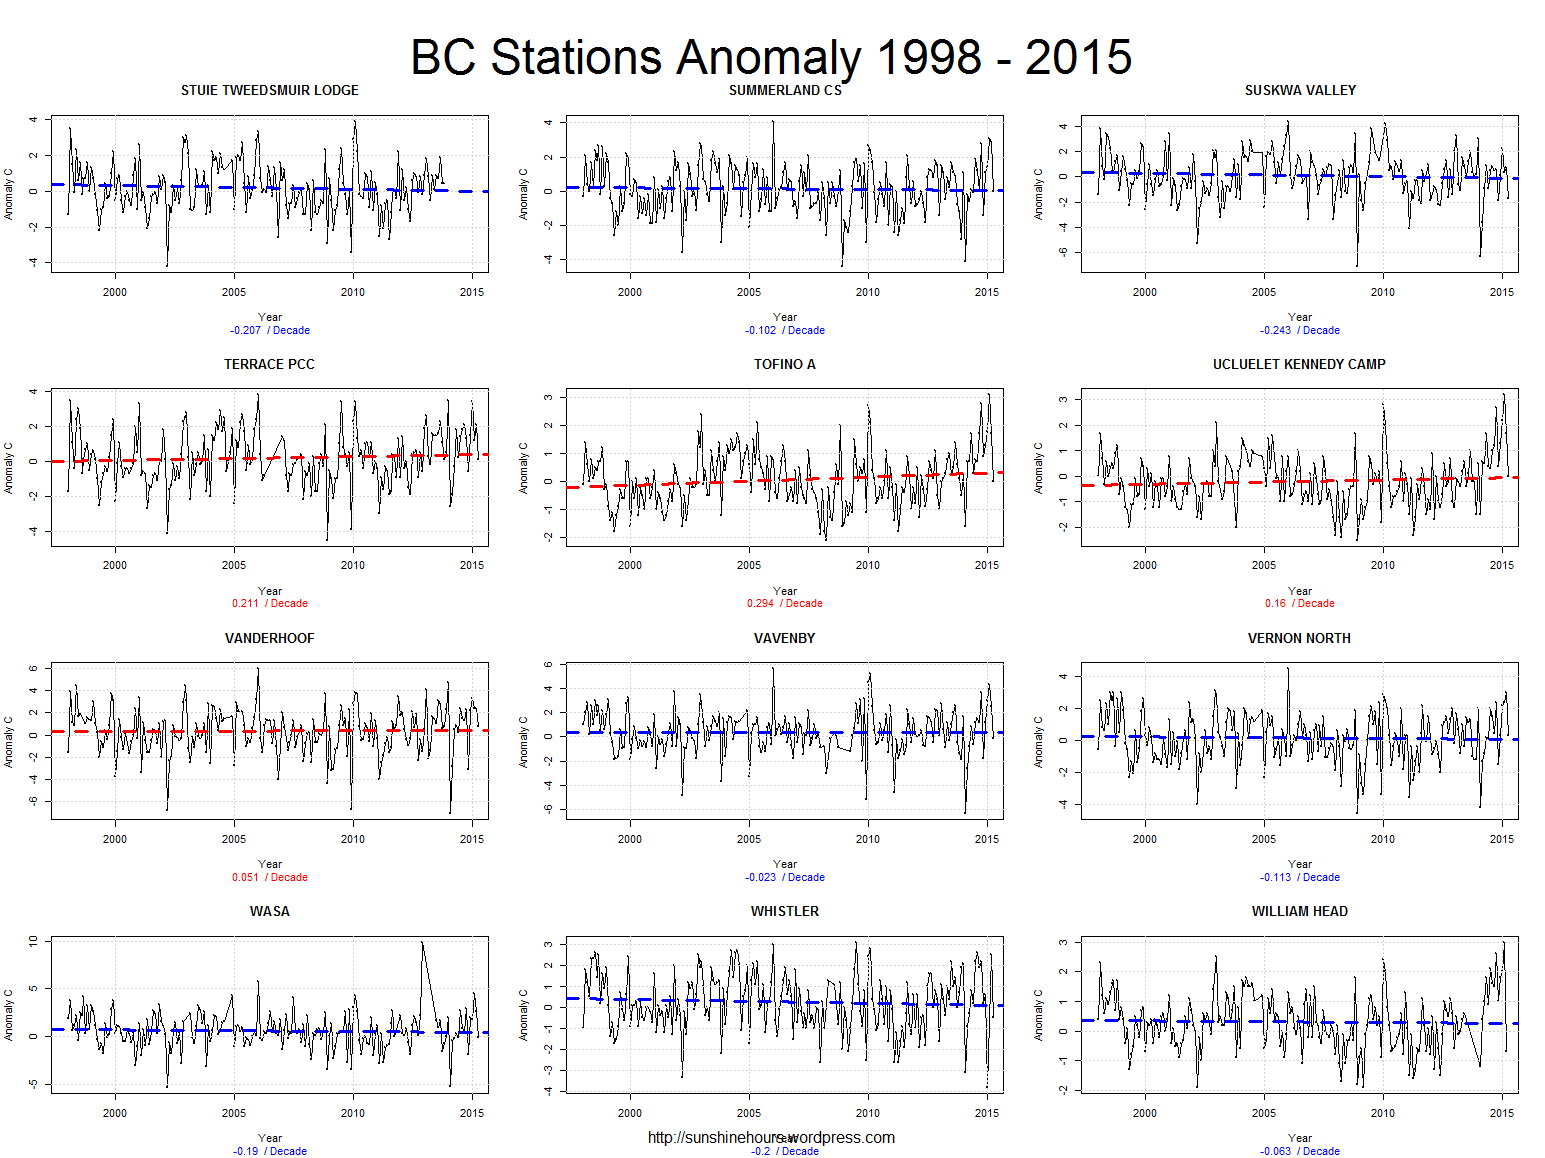
If you take Environment Canada’s monthly summaries from 1998 to April 2015.
Use only the station with pre-calculated Normals (anomalies from 1981-2010 avg).
Average them on a 1×1 grid and then graph the data:

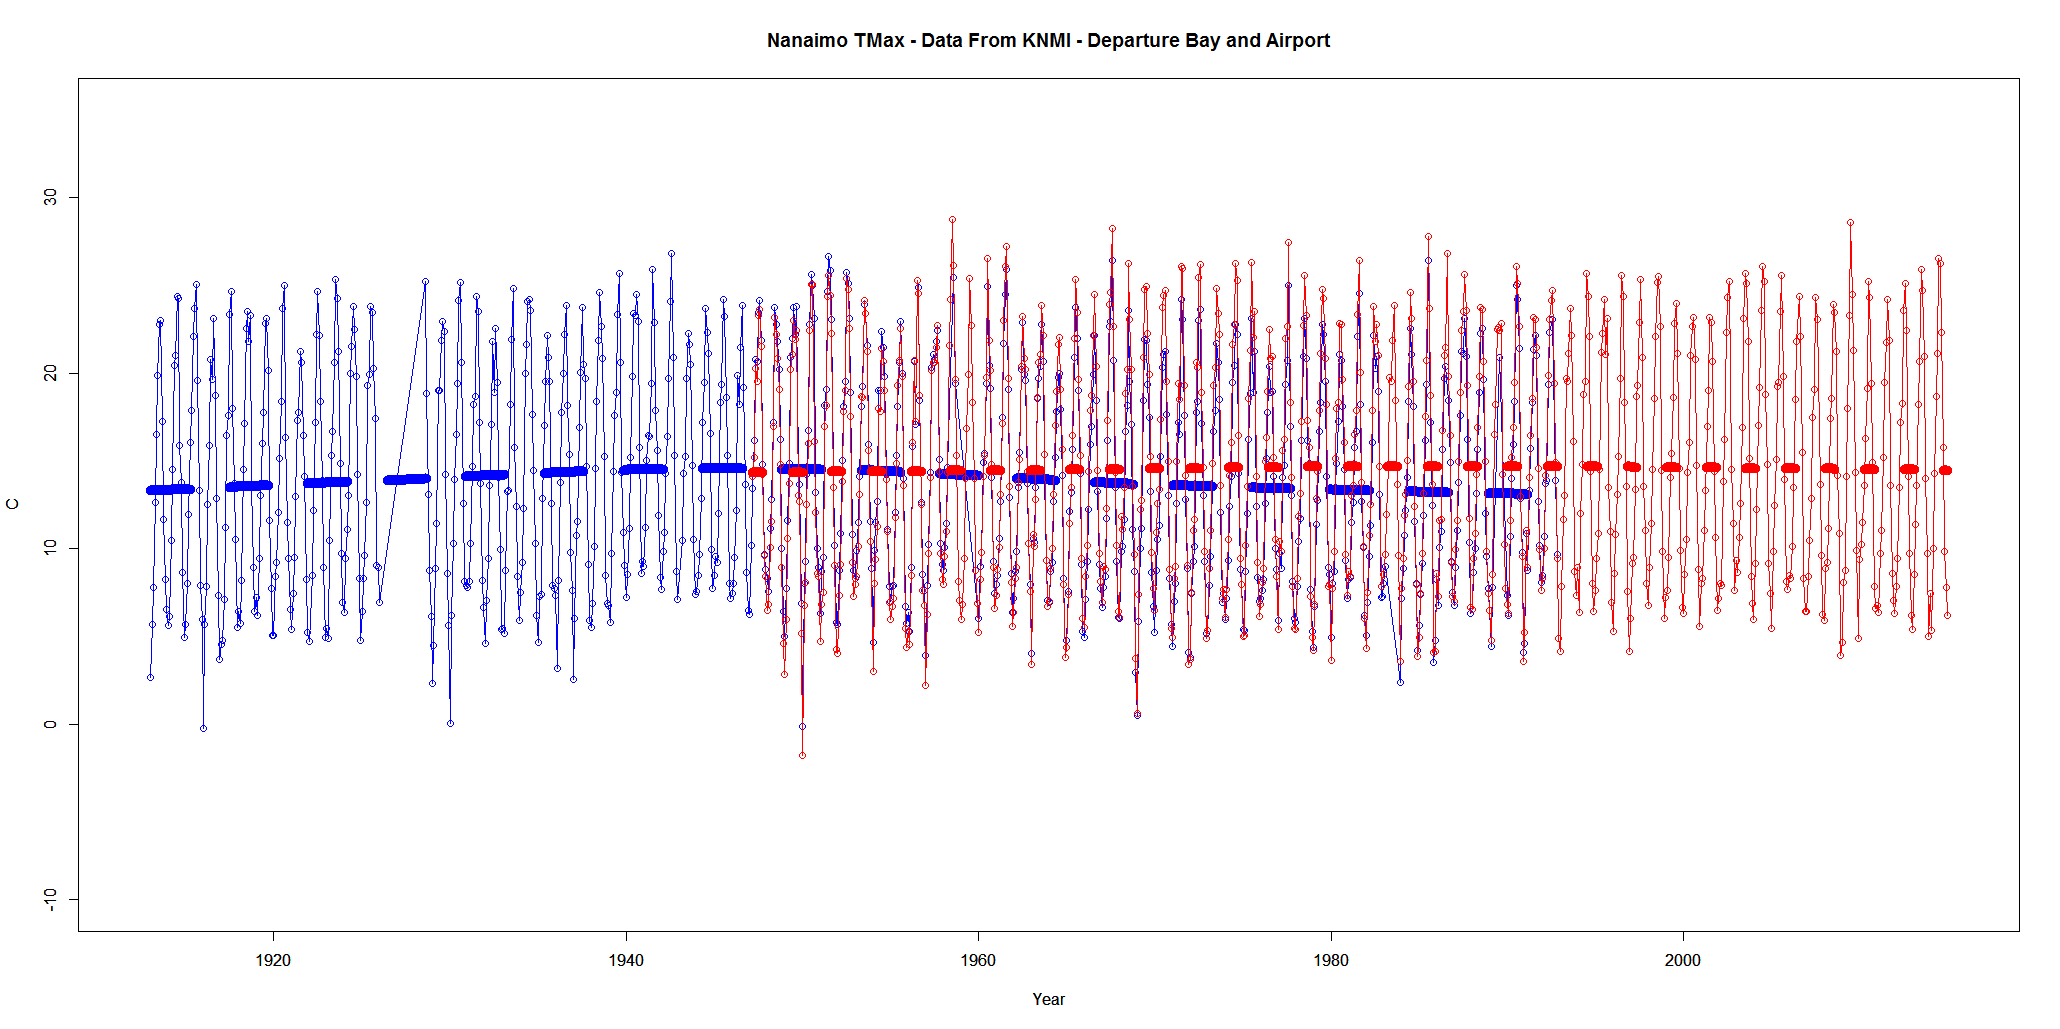
Every once in a while I visit the data for the weather station closest to my hometown on the west coast of Canada.
Today I am looking at daily data (using KNMI) from Departure Bay (1913 – 1992) and Nanaimo Airport (1947 – 2014).
I’ve summarized the data by monthly mean.
The data does overlap. The first graph is just Tmax. The second graph is Tmax anomaly from the overlap period of 1948 to 1992
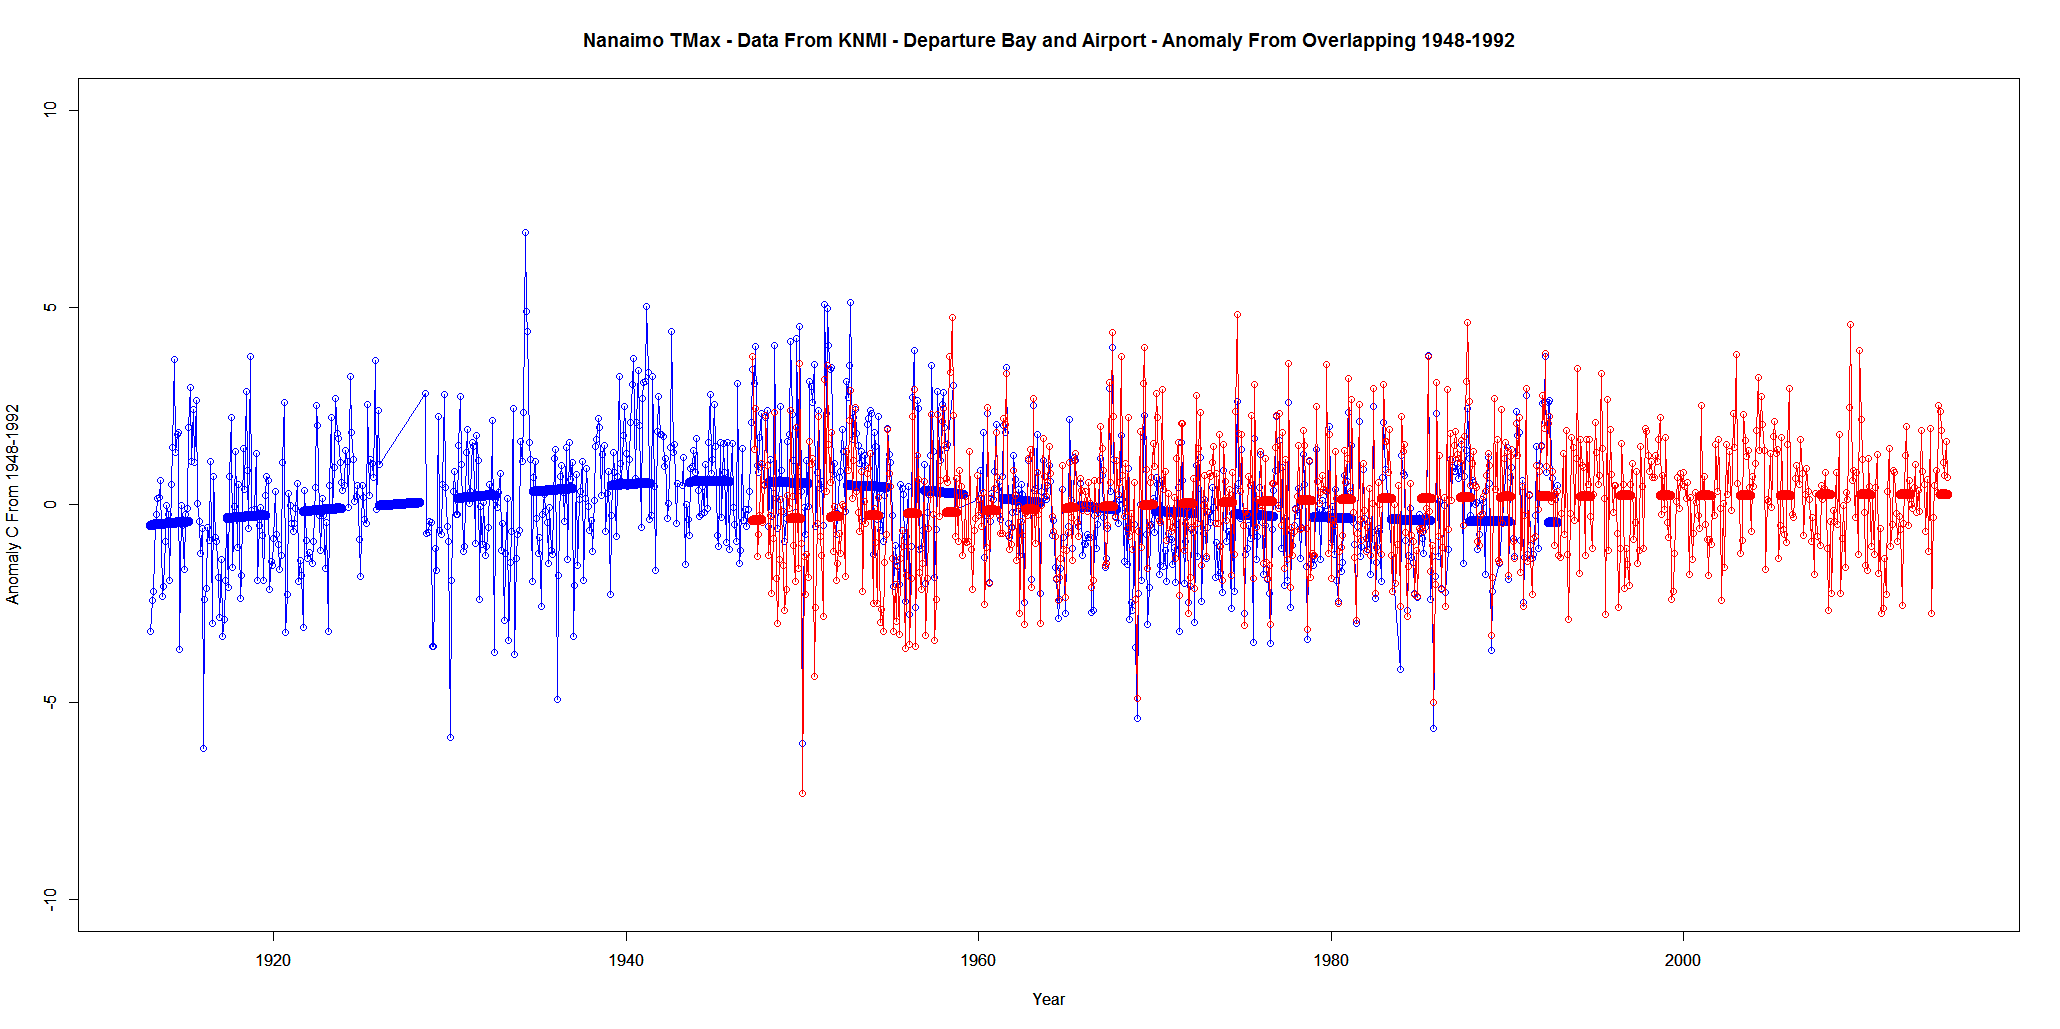
Update: From 1948 added at bottom
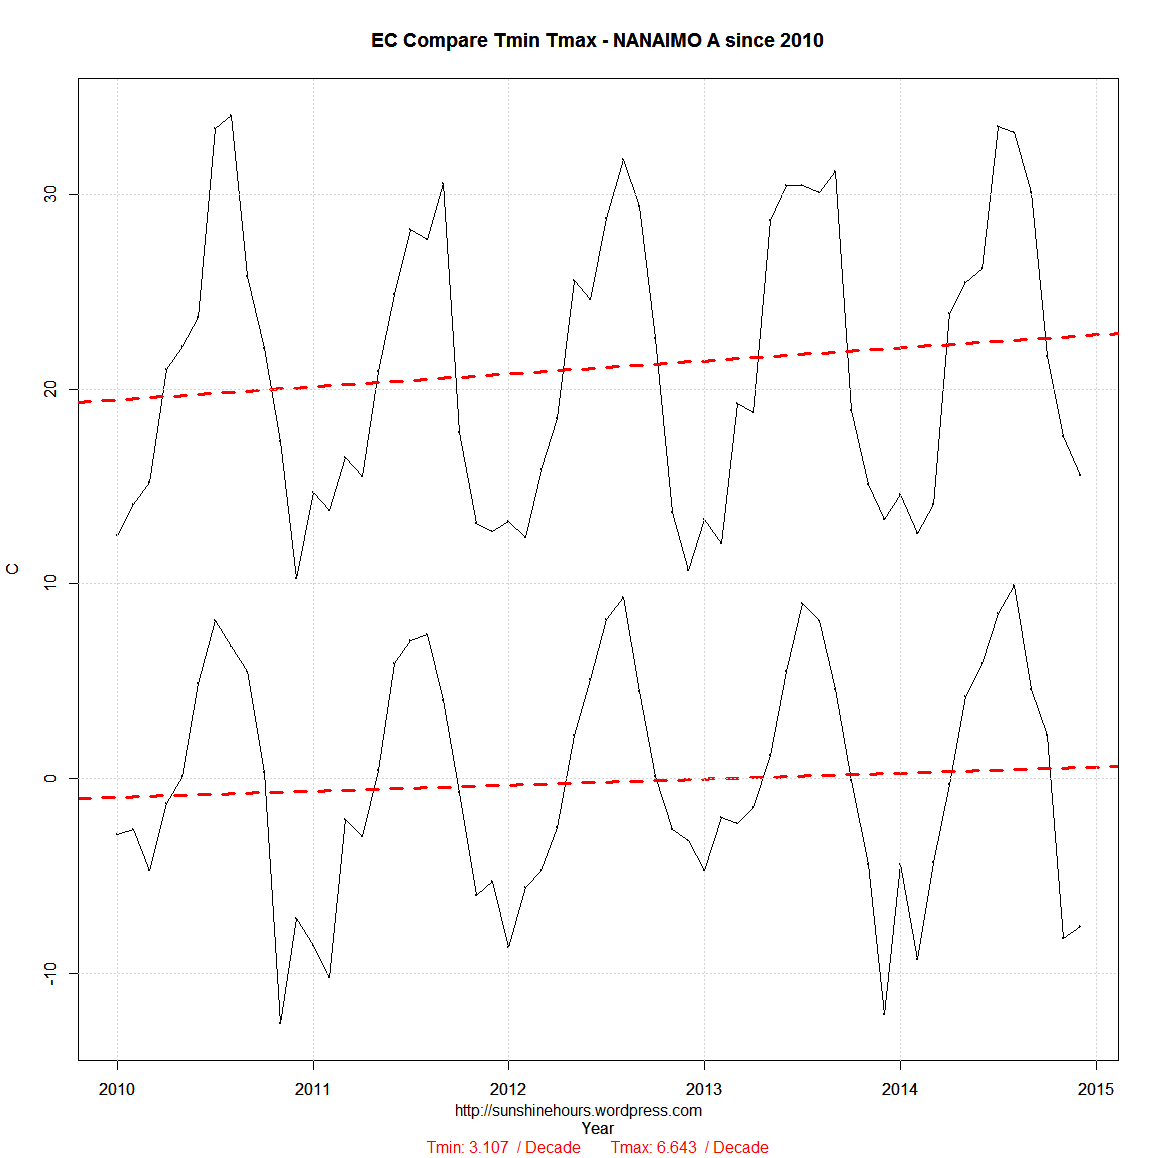
Every once in a while I visit the data for the weather station closest to my hometown on the west coast of Canada. The data only starts in the late 1940s so there is no extreme’s from the 1930s and 1940s.
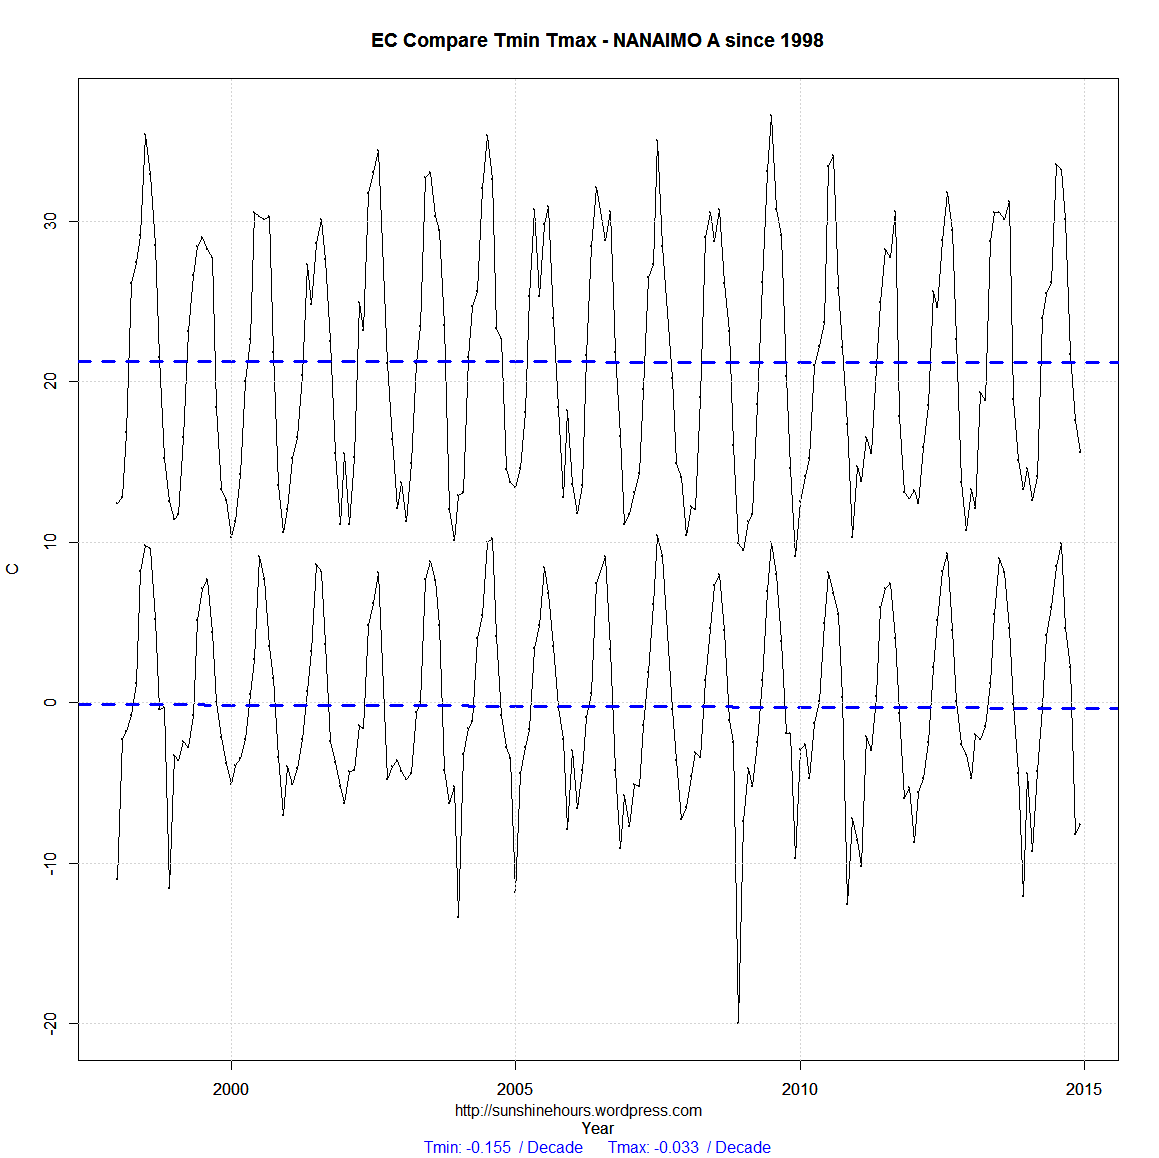
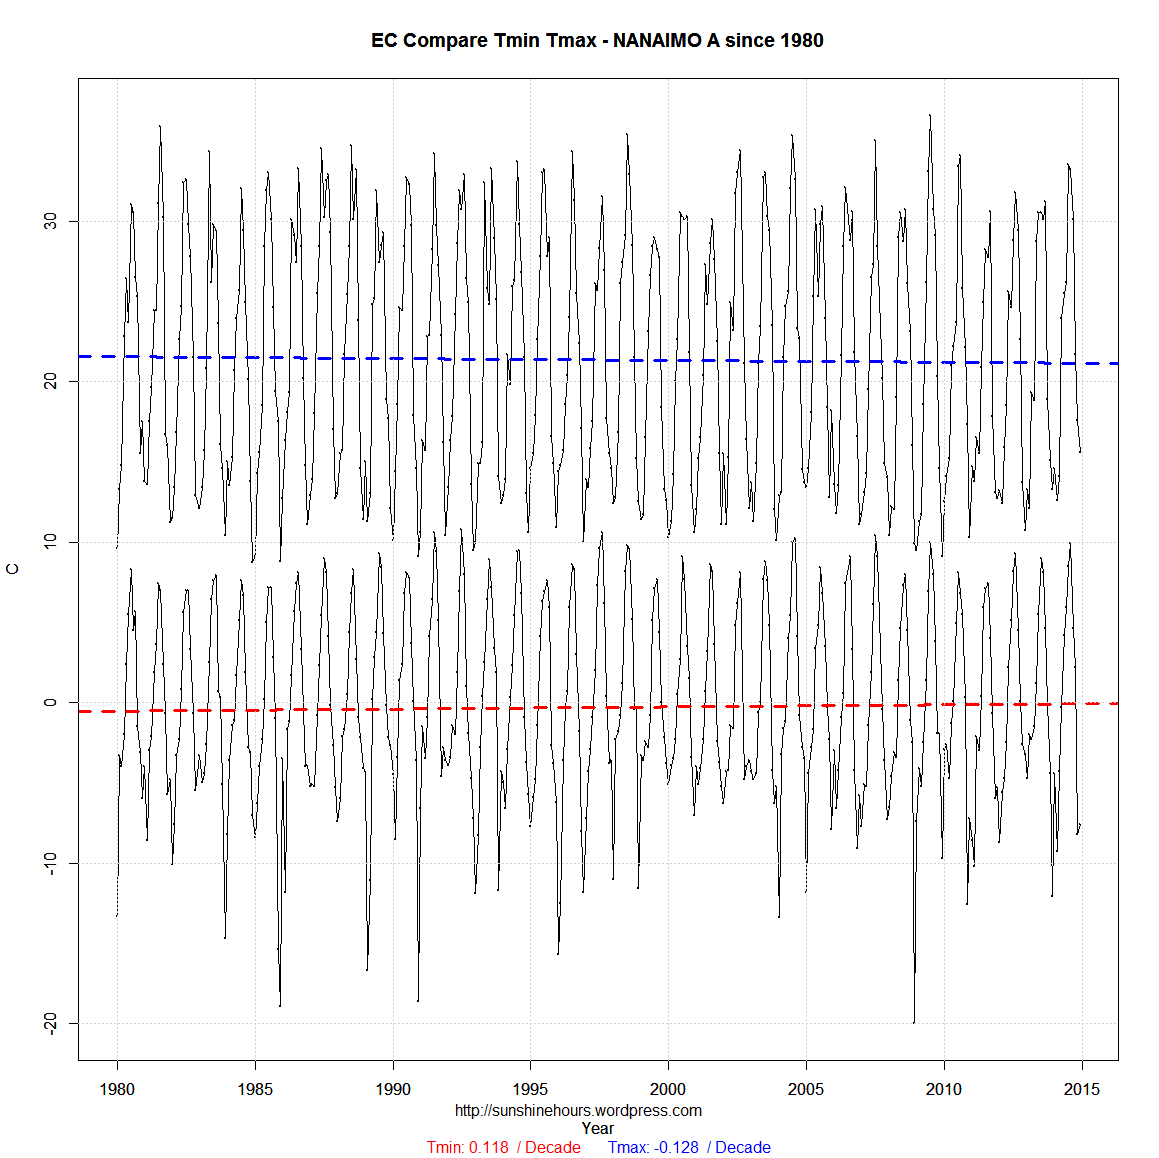
The three graphs below have the Tmin and Tmax data from the Environment Canada monthly reports up to the end of 2014.
The three start in 2010, 1998 and 1980. What does the data tell you?
If you start in 2010 … we are going to bake to death.
If you start in 1998 … we are slowly cooling.
If you start in 1980 the Tmin is climbing and the Tmax is dropping. UHI probably.
Using November Tmin data from Environment Canada’s monthly summaries.
I used the following filter. There had to be 25 years of data. And there had to be data in 2014.
420 stations fit that criteria.
For 122 of those stations, November 2014 was in the top 5 coldest.
So, for example. 108 MILE HOUSE ABEL LAKE has 27 rows of data, and 2014 is ranked as the 4th coldest.
| Prov | Stn | Rows | Last Year | Nov 2014 Monthly Tmin | Nov 2014 Monthly Rank | Coldest 10 Novembers (In order) |
| BC | 108 MILE HOUSE ABEL LAKE | 27 | 2014 | -28.5 | 4 | 1996,2006,1993,2014,2001,1995,1994,2005,2010,2003 |
| BC | ADDENBROKE ISLAND | 35 | 2014 | -7 | 3 | 1985,2006,2014,1993,2010,2003,2011,1982,1990,2001 |
| MB | ARBORG | 55 | 2014 | -31.5 | 5 | 1978,1985,1989,1995,2014,1964,1971,1976,1991,1997 |
| BC | ASHCROFT | 25 | 2014 | -21.1 | 1 | 1959,2014,1978,1977,2010,2011,1963,1958,2013,1979 |
| MB | BALDUR | 52 | 2014 | -27.5 | 4 | 1985,1964,1978,2007,2013,2014,1977,1976,1986,2012 |
| MB | BERENS RIVER CS | 30 | 2014 | -36 | 2 | 1985,2014,1986,1993,1995,1997,1989,1991,1996,2012 |
| ON | BIG TROUT LAKE | 57 | 2014 | -32 | 5 | 1989,1949,1968,1976,2012,2014,1958,1978,2012,1957 |
| BC | BILLINGS | 30 | 2014 | -17 | 5 | 1985,2006,2010,1993,2014,1996,2007,1991,1986,2003 |
| BC | BLUE RIVER A | 45 | 2014 | -30.6 | 3 | 1985,2006,2014,1975,1993,2010,1984,1978,1996,1970 |
| BC | BOAT BLUFF | 37 | 2014 | -5.5 | 5 | 1985,2006,1996,2010,2014,1993,2001,1978,1982,1990 |
| AB | BRETON | 29 | 2014 | -34 | 1 | 2014,1996,2006,2010,2013,2003,1993,1990,2011,1975 |
| AB | BROOKS | 37 | 2014 | -30.3 | 3 | 1975,1978,2014,1996,2003,2010,1973,1990,2006,1977 |
| AB | BRULE BLACK CAT | 28 | 2014 | -39.5 | 1 | 2014,1996,2010,2006,1990,1993,1995,2001,2003,1991 |
| BC | BURNS LAKE DECKER LAKE | 35 | 2014 | -31.4 | 3 | 1955,2006,2014,1970,1963,2010,1964,2011,1965,1966 |
| BC | CAPE ST JAMES | 48 | 2014 | -3.4 | 4 | 1985,1946,1955,2014,1963,1959,1970,1973,1950,1945 |
| AB | CARDSTON | 99 | 2014 | -32 | 5 | 1955,1996,1946,1985,1996,2014,1950,1959,1963,1993 |
| MB | CARMAN | 25 | 2014 | -28 | 1 | 2014,1996,2005,1995,2007,2013,2010,1991,1990,2003 |
| ON | CHAPLEAU A | 37 | 2014 | -31.5 | 1 | 2014,1989,1983,2007,1995,1978,1992,1993,1986,2000 |
| NL | CHURCHILL FALLS A | 27 | 2014 | -29.9 | 3 | 1986,1972,2014,1978,1989,1992,1977,1980,1991,2013 |
| QC | CHUTE-DES-PASSES | 37 | 2014 | -23.8 | 5 | 1964,1968,1997,2002,2014,1971,2005,1962,1975,2013 |
| SK | CIGAR LAKE | 28 | 2014 | -36 | 3 | 1988,1990,2014,2004,1995,2007,2012,1994,2001,2006 |
| AB | CLARESHOLM | 29 | 2014 | -35.3 | 2 | 2010,2014,1996,2006,2003,1955,2012,2007,1993,1995 |
| SK | CLAYDON | 44 | 2014 | -28 | 2 | 1985,1996,2014,2010,1982,1973,1975,1976,1986,2006 |
| SK | COLLINS BAY | 39 | 2014 | -35.8 | 2 | 1988,2014,1975,1978,1976,2004,1985,1982,1972,1977 |
| SK | CORONACH | 48 | 2014 | -30.5 | 4 | 1996,1985,1946,2006,2014,1993,2010,1977,1978,1945 |
| SK | CORONACH SPC | 33 | 2014 | -28.6 | 3 | 1996,1985,2010,2014,1991,1993,2003,2006,2000,1990 |
| MB | COWAN | 29 | 2014 | -33 | 2 | 1985,2010,2014,1991,1989,1984,2006,1996,1995,2000 |
| BC | CRISS CREEK | 25 | 2014 | -31.5 | 2 | 2006,2014,1993,2010,1996,2013,2011,1990,1994,2003 |
| MB | DAUPHIN | 41 | 2014 | -31.5 | 2 | 1919,2014,1905,1921,1907,2013,1935,1940,1914,1926 |
| BC | DAWSON CREEK A | 47 | 2014 | -37.1 | 5 | 1985,2006,1990,1970,2014,1993,1982,2013,1973,2001 |
| BC | DELTA TSAWWASSEN BEACH | 27 | 2014 | -7.5 | 2 | 2006,2014,1993,2010,1996,2011,1994,2003,2013,1992 |
| BC | DRYAD POINT | 37 | 2014 | -6 | 5 | 1985,2006,1996,2010,2011,2014,1993,1982,1990,1978 |
| BC | DUNCAN KELVIN CREEK | 27 | 2014 | -6 | 5 | 2010,1993,2006,1996,2003,2014,1994,1995,2002,2000 |
| SK | DUVAL | 52 | 2014 | -28 | 5 | 1985,1978,1996,2013,2014,1966,1970,1977,1965,1991 |
| AB | EDMONTON STONY PLAIN | 49 | 2014 | -31 | 3 | 1985,1970,2014,2010,1996,2006,2003,1990,1973,1984 |
| AB | EDSON | 58 | 2014 | -36 | 4 | 1963,1919,1950,2014,1955,1940,1946,2013,2010,1921 |
| AB | EGG ISLAND | 61 | 2014 | -25.6 | 2 | 2012,2014,2013,2001,2002,2003,2004,1985,2006,2007 |
| MB | ELKHORN 2 EAST | 26 | 2014 | -27 | 5 | 2013,1996,2006,2007,2014,1995,1990,1991,2010,1989 |
| BC | ENTRANCE ISLAND | 28 | 2014 | -2 | 3 | 2006,2010,2014,1996,2014,1916,2003,2005,2007,2011 |
| AB | ENTWISTLE | 28 | 2014 | -33 | 2 | 2010,2006,2014,1996,2003,1990,2013,1993,1991,2012 |
| BC | EQUITY SILVER | 32 | 2014 | -29.5 | 3 | 1985,1982,1996,2014,2010,2001,2013,1984,2003,1986 |
| SK | ESTEVAN | 26 | 2014 | -27.7 | 5 | 1919,1905,1900,1914,2014,1903,2013,1910,1911,1924 |
| SK | ESTEVAN A | 71 | 2014 | -28.5 | 4 | 1996,1985,1964,1990,2014,1978,1946,1955,2006,2010 |
| AB | FABYAN | 34 | 2014 | -31.5 | 4 | 1985,1996,2010,2014,1990,1986,2006,1982,1993,2013 |
| BC | FERNIE | 96 | 2014 | -29 | 5 | 1959,1985,1982,1993,2014,1946,1970,2006,1940,2003 |
| ON | FOLDENS | 52 | 2014 | -13 | 5 | 1987,2013,1986,2000,2014,1976,1996,2005,1964,1967 |
| AB | FORT VERMILION | 26 | 2014 | -34.9 | 3 | 2006,2012,2014,2013,1915,1963,2011,1908,2007,1914 |
| ON | GERALDTON A | 34 | 2014 | -32.1 | 4 | 1985,1989,1995,2014,2007,1986,1997,1992,2013,2005 |
| MB | GILBERT PLAINS | 55 | 2014 | -34 | 3 | 1958,1985,2014,1964,1991,1996,1978,2010,1995,1971 |
| BC | GOLDSTREAM RIVER | 31 | 2014 | -22 | 3 | 1985,2006,1993,2014,1982,1984,2007,1995,1996,2013 |
| MB | GRAND RAPIDS HYDRO | 46 | 2014 | -30 | 3 | 2004,1985,2014,1978,1989,1966,1970,2010,1993,1971 |
| AB | GRANDE PRAIRIE A | 73 | 2014 | -38 | 4 | 1963,1985,1955,2014,1970,2006,1950,1990,1961,1965 |
| MB | GRETNA (AUT) | 34 | 2014 | -27.2 | 4 | 1958,1996,1964,2014,1955,2013,2007,1995,1993,2006 |
| ON | HAMILTON A | 55 | 2014 | -13.2 | 2 | 2000,2014,1987,1959,2013,1986,1976,1996,1967,2005 |
| BC | HOPE A | 60 | 2014 | -10.1 | 4 | 1985,1955,1959,2014,1993,1945,1946,1970,1940,1977 |
| BC | HORSEFLY LAKE GRUHS LAKE | 37 | 2014 | -30.5 | 3 | 1955,2006,2014,2010,1996,1959,2001,2013,1993,1994 |
| BC | IVORY ISLAND | 30 | 2014 | -6 | 3 | 2006,1996,2010,2014,1993,2011,1950,1990,2001,2005 |
| BC | KAMLOOPS PRATT ROAD | 26 | 2014 | -24 | 2 | 2006,2014,1996,2010,1993,1990,2013,2003,2011,1995 |
| ON | KAPUSKASING A | 78 | 2014 | -31.1 | 4 | 1938,1957,1975,2014,1940,1995,1976,2012,1964,1978 |
| BC | KELOWNA | 68 | 2014 | -19.4 | 4 | 1900,2010,1955,2014,1959,1911,2011,1921,1927,1903 |
| SK | KINDERSLEY A | 32 | 2014 | -28.5 | 5 | 1996,1985,2010,1991,2014,2011,1993,2006,2013,1984 |
| ON | KINGSVILLE MOE | 47 | 2014 | -11 | 3 | 1996,1976,1986,2014,1979,1991,2005,2013,1969,1977 |
| SK | LEROY | 35 | 2014 | -29 | 4 | 1985,1996,1990,1995,2007,2010,2014,1982,2003,2013 |
| BC | LILLOOET | 44 | 2014 | -19.2 | 2 | 1883,2014,1921,1940,2010,1927,1931,1881,1919,1924 |
| AB | LLOYDMINSTER A | 33 | 2014 | -28.3 | 5 | 1985,1996,2010,1990,2014,2003,2013,1995,2006,1986 |
| MB | MAFEKING | 25 | 2014 | -31 | 1 | 2014,1989,1991,1993,2007,1990,1996,2006,2010,2011 |
| SK | MANKOTA | 46 | 2014 | -32.5 | 3 | 1985,1996,2014,1978,2003,1975,1976,1984,1964,1977 |
| MB | MARQUETTE | 46 | 2014 | -27 | 5 | 1985,1978,1976,1977,1995,2014,1986,2007,1989,1996 |
| ON | MASSEY | 32 | 2014 | -24.5 | 2 | 1989,2014,1995,2000,1986,2005,2007,2013,1983,1991 |
| SK | MCKAGUE 2 | 30 | 2014 | -32.5 | 3 | 1985,1991,2014,1996,2007,1990,2010,1986,1993,1995 |
| BC | MCLEESE LAKE GRANITE MT | 39 | 2014 | -29 | 3 | 2006,1978,2014,1996,2010,2013,1993,1984,1995,1977 |
| SK | MEADOW LAKE | 28 | 2014 | -34.6 | 3 | 2013,1970,2014,2006,2003,1996,2007,2010,1975,1972 |
| SK | MEADOW LAKE A | 32 | 2014 | -34.4 | 5 | 1985,1982,1990,1978,2014,1986,2003,2006,1994,2007 |
| BC | MERRITT | 43 | 2014 | -24.7 | 1 | 2014,1924,1945,1921,1946,1931,1950,1919,1935,2011 |
| BC | MICA DAM | 52 | 2014 | -18.5 | 4 | 1985,2006,1970,2014,1963,1984,2010,1975,1993,1978 |
| AB | MILK RIVER | 40 | 2014 | -29.3 | 2 | 1996,2014,2006,2010,2003,1970,2007,2012,1964,1963 |
| BC | MISSION WEST ABBEY | 53 | 2014 | -9 | 4 | 1985,2006,2010,1993,2014,1978,1996,1970,1977,1963 |
| BC | MYRA CREEK | 32 | 2014 | -6 | 5 | 2010,2006,1982,1993,1996,2014,2003,1979,1981,1983 |
| BC | NEW DENVER | 45 | 2014 | -14 | 5 | 1985,2006,2010,1993,1977,2014,1970,1978,1975,1984 |
| BC | NORTH PENDER ISLAND | 32 | 2014 | -5 | 5 | 1985,2006,1993,2010,1982,2014,1996,1975,2011,1984 |
| BC | OKANAGAN CENTRE | 85 | 2014 | -14.5 | 5 | 1985,1955,1959,1996,2014,1946,1940,1970,1993,1977 |
| BC | OSOYOOS CS | 25 | 2014 | -13 | 4 | 2010,2006,1993,2014,1996,2003,2002,1995,1994,2013 |
| BC | PEACHLAND | 41 | 2014 | -16.5 | 3 | 1985,2006,2010,2014,1978,1993,1996,1977,2003,1975 |
| SK | PELLY | 60 | 2014 | -34 | 4 | 1958,1985,1970,1978,2014,1959,1991,1955,1951,1982 |
| AB | PICTURE BUTTE WEST | 26 | 2014 | -29.5 | 3 | 1996,2006,2014,2010,2012,2003,1991,1993,1990,2001 |
| MB | PINAWA | 58 | 2014 | -30 | 3 | 1929,1926,1919,2014,1940,1921,1930,1933,1996,1927 |
| ON | PORT COLBORNE | 50 | 2014 | -10 | 5 | 1987,1976,2000,2013,1986,2005,2008,2014,1989,1967 |
| BC | PRINCE GEORGE | 38 | 2014 | -32.3 | 3 | 1927,1940,2014,1919,2010,1935,1921,1931,2011,1924 |
| BC | PRINCE GEORGE STP | 39 | 2014 | -28 | 4 | 1985,2006,1996,2014,1978,2010,1982,1977,1986,1984 |
| BC | PRINCE RUPERT | 60 | 2014 | -8.7 | 4 | 1955,1911,1921,2014,1909,1910,1946,1950,2010,1959 |
| BC | PRINCETON A | 79 | 2014 | -27 | 5 | 1985,2006,1975,1955,2014,2010,1958,1959,1970,1982 |
| AB | QUEENSTOWN | 53 | 2014 | -29 | 4 | 1985,2010,2010,2006,2014,1993,1977,1996,1975,1978 |
| BC | QUESNEL | 83 | 2014 | -31.3 | 4 | 1896,1893,1955,2014,1897,1946,1959,1892,1911,1940 |
| BC | RED LAKE | 30 | 2014 | -25 | 4 | 1985,2006,2010,2014,1993,1996,1995,1986,2013,1974 |
| ON | RED LAKE A | 70 | 2014 | -31 | 5 | 1985,1978,1940,1995,2014,1964,1976,1986,1956,1955 |
| MB | RENNIE | 28 | 2014 | -32.5 | 2 | 1996,2014,1991,2007,1989,1995,1997,2013,1979,2003 |
| MB | ROBLIN | 42 | 2014 | -32.2 | 4 | 1985,1978,1996,2014,1991,2010,1996,1989,2013,1977 |
| SK | ROCK POINT | 40 | 2014 | -28.5 | 5 | 1985,1978,1996,1977,2014,1976,1982,1984,1975,2010 |
| SK | ROCKGLEN (AUT) | 30 | 2014 | -28.6 | 3 | 1978,1996,2014,1977,2010,1976,1975,2006,2003,1995 |
| ON | ROSEVILLE | 43 | 2014 | -17 | 1 | 2000,2014,2008,1987,1996,1982,1972,1999,2013,1976 |
| BC | SATURNA ISLAND CS | 28 | 2014 | -2.9 | 5 | 1985,2010,2006,1993,2014,1984,2011,1982,1983,2012 |
| ON | SAULT STE MARIE A | 57 | 2014 | -19.1 | 4 | 1975,1976,1995,2014,1989,1947,1964,2013,1997,1977 |
| BC | SILVER CREEK | 25 | 2014 | -21.5 | 3 | 2006,2010,1996,2014,1993,2003,1990,1994,2013,1991 |
| BC | SPARWOOD | 33 | 2014 | -33.5 | 2 | 1985,2014,2010,1993,2006,1996,1984,1991,1986,2003 |
| BC | SPOKIN LAKE 4E | 31 | 2014 | -36 | 2 | 1985,2014,2006,1996,2013,2010,1993,1986,1995,2001 |
| MB | ST ALPHONSE | 29 | 2014 | -27 | 4 | 2007,1996,2013,2014,1986,1989,2006,2000,2010,1991 |
| NL | ST ANTHONY | 60 | 2014 | -22.6 | 1 | 2014,1946,1993,1978,1989,2000,1994,1992,1986,1982 |
| SK | STEWART VALLEY | 30 | 2014 | -28 | 4 | 1985,1996,2013,2014,1991,2010,2006,1984,1993,1995 |
| ON | SUDBURY A | 61 | 2014 | -22.6 | 3 | 1958,1989,2014,1977,1956,1978,1982,1986,2013,1964 |
| BC | SUMMERLAND CS | 25 | 2014 | -16.8 | 3 | 2006,2010,2014,1993,1996,2003,1990,1994,2013,1992 |
| BC | SUSKWA VALLEY | 31 | 2014 | -24 | 4 | 1985,2006,1996,2014,2010,1982,1993,1990,2007,1986 |
| NU | TALOYOAK A | 31 | 2014 | -38.9 | 2 | 2004,2014,2002,1989,1993,1985,1987,1992,1994,2000 |
| ON | TIMMINS A | 41 | 2014 | -30.2 | 4 | 1975,1957,1964,2014,1989,1986,1959,1978,1976,1968 |
| AB | VEGREVILLE | 36 | 2014 | -34.6 | 4 | 1996,1985,2010,2014,1990,2006,2013,2003,1984,2011 |
| BC | VERNON SILVER STAR LODGE | 32 | 2014 | -26.5 | 5 | 2006,1985,2003,1993,2014,2009,2010,1970,1984,1994 |
| MB | WASAGAMING | 45 | 2014 | -32.3 | 5 | 1985,1978,1996,2013,2014,1986,2010,1967,1995,1971 |
| ON | WAWA A | 36 | 2014 | -25.9 | 2 | 1989,2014,2007,2013,1995,1997,1977,1986,1982,1993 |
| ON | WELCOME ISLAND (AUT) | 36 | 2014 | -20.2 | 3 | 1976,1978,2014,2007,1977,1979,1997,2013,2000,1967 |
| BC | WHISTLER ROUNDHOUSE | 35 | 2014 | -23 | 5 | 1985,1993,2006,2010,2014,1977,1975,1973,1986,1982 |
| AB | WHITECOURT | 52 | 2014 | -33.4 | 5 | 1955,1963,1950,1970,2014,1946,1964,2006,1961,1959 |
| AB | WHITECOURT A | 37 | 2014 | -32.9 | 3 | 1985,2006,2014,1996,2010,1984,1990,2003,1986,2013 |
| BC | WILLIAMS LAKE A | 54 | 2014 | -31 | 2 | 1985,2014,1996,2006,1970,1978,1993,1977,1963,2010 |
Map of snowfall in Canada for September 2014 from Environment Canada’s monthly summaries.
The size of the black dot in the top left corner represents 100cm of snow. MOUNTAIN VIEW VILLAGE got 80cm in September. Top 10 list is below.
Click for bigger.

| Prov | Stn_Name | Snow(cm) | Lat | Long |
| AB | MOUNTAIN VIEW VILLAGE | 80 | 49.132 | -113.594 |
| NU | ALERT UA | 77.8 | 82.5 | -62.333 |
| AB | KANANASKIS | 60.6 | 51.028 | -115.035 |
| AB | WILDCAT HILLS | 34 | 51.269 | -114.721 |
| AB | CALGARY INTL A | 28.2 | 51.123 | -114.013 |
| AB | OKOTOKS | 19.6 | 50.729 | -113.961 |
| NU | BAKER LAKE A | 17.8 | 64.299 | -96.078 |
| BC | FORT ST. JOHN A | 15.6 | 56.238 | -120.74 |
| NU | RANKIN INLET A | 15.4 | 62.811 | -92.115 |
| AB | BRULE BLACK CAT | 15.2 | 53.35 | -117.867 |
