According to the NOAA Year To Date (January to October 2014) was 80th Hottest Max Temperature out of 120.
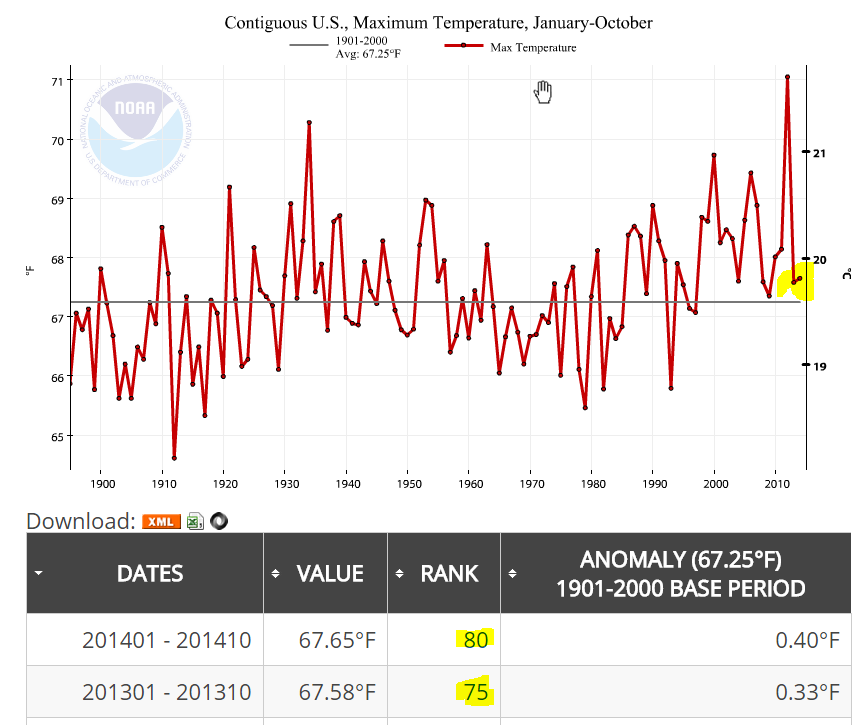
According to the NOAA Year To Date (January to October 2014) was 80th Hottest Max Temperature out of 120.
How hot was October 1963 in the USA?
In 1963 October was 3.9F hotter than October 2014.
20 states had the hottest max temperature ever for October. (Those marked 120)
10 states had the 2nd hottest max temperature ever for October. (Those marked 119)
3 states had the 3rd hottest max temperature ever for October. (Those marked 118)
etc
So much for CO2 …

Wow. According to the NOAA October 2014 was 8th Hottest Max Temperature.
Tied with 1927.
Only 1963, 1947, 1950, 1953, 1938, 1934 and 2003 Were Hotter.
October 1963 was 3.9F hotter. Sneaky global warming.
| 1963 | 73.47°F | 120 | 6.67°F |
| 1947 | 71.42°F | 119 | 4.62°F |
| 1950 | 70.72°F | 118 | 3.92°F |
| 1953 | 70.34°F | 117 | 3.54°F |
| 1938 | 70.00°F | 116 | 3.20°F |
| 1934 | 69.75°F | 115 | 2.95°F |
| 2003 | 69.71°F | 114 | 2.91°F |
| 1927 | 69.57°F | 113 | 2.77°F |
| 2014 | 69.57°F | 113 | 2.77°F |

Finally!!! Everytime I argue with members of the AGW Cult they claim we are in the midst of a “great extinction”. I ask them to name 10 species. When they can’t name any, I ask for 5. They usually come up with one animal that has been hunted to extinction (which is horrible, but not AGW)
Old Prediction:
“Global warming is said to be threatening thousands of animal and plant species with extinction. That, at least, is what the Intergovernmental Panel on Climate Change (IPCC) has been predicting for years.”
New Confession:
“ IPCC admits that there is no evidence climate change has led to even a single species becoming extinct thus far.”
Polar Bears Are Doing Fine:
“At most, the draft report says, climate change may have played a role in the disappearance of a few amphibians, fresh water fish and mollusks. Yet even the icons of catastrophic global warming, the polar bears, are doing surprisingly well. Their population has remained stable despite the shrinking of the Arctic ice cap.”
Models Suck:
“”There is very little confidence that models currently predict extinction risk accurately,” the report notes. Very low extinction rates despite considerable climate variability during past hundreds of thousands of years have led to concern that “forecasts for very high extinction rates due entirely to climate change may be overestimated.””
(h/t Small Dead Animals)
Haven’t the “deniers” been saying this for a long time? Biofuels are a cruel joke on the poor. Driving up food prices and creating more CO2.
“The United Nations will officially warn that growing crops to make “green” biofuel harms the environment and drives up food prices, The Telegraph can disclose.
A leaked draft of a UN report condemns the widespread use of biofuels made from crops as a replacement for petrol and diesel. It says that biofuels, rather than combating the effects of global warming, could make them worse.
The draft report represents a dramatic about-turn for the UN’s Intergovernmental Panel on Climate Change (IPCC).”
Billions squandered by idiots.
http://www.telegraph.co.uk/earth/energy/10716756/Biofuels-do-more-harm-than-good-UN-warns.html
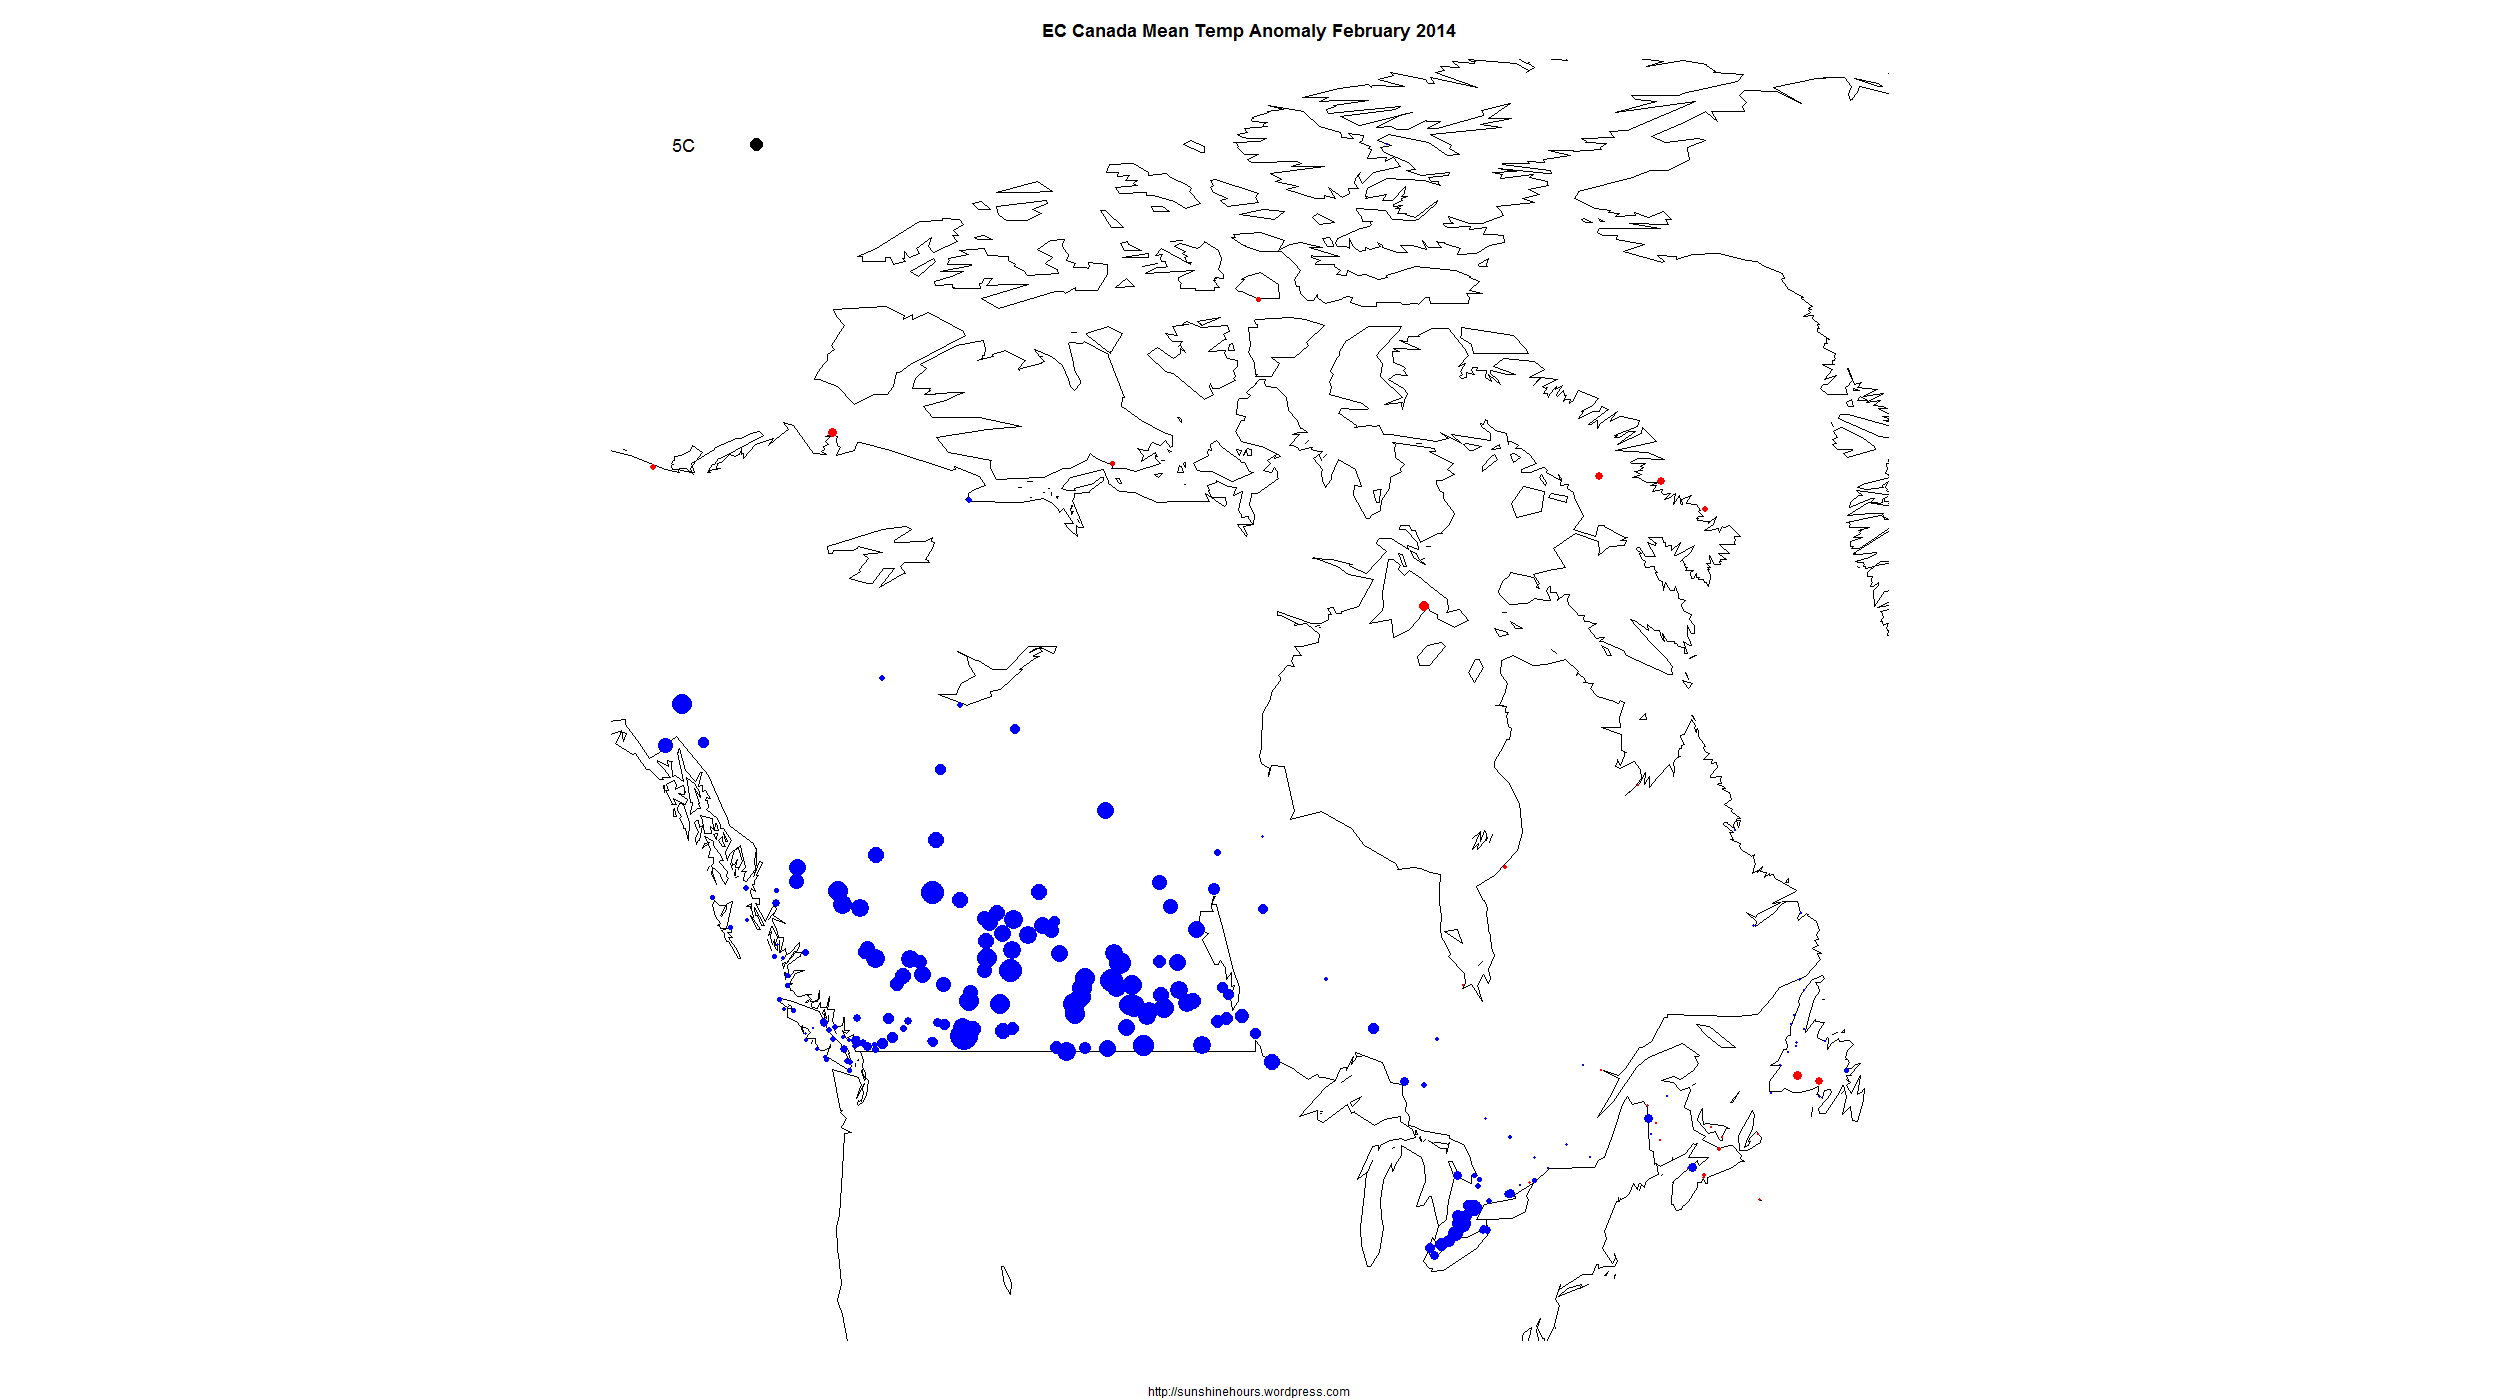
I have mapped the February 2014 mean temperature anomalies in the Environment Canada monthly summaries that have “normals”. The anomalies are calculated from selected stations based on the 1971-2000 average.
The size if the dot represents the size of the anomaly. The 5C black dot in the top left hand corner represents 5C difference from “normal”. Red dots are warmer than normal. Blue are cooler. And Green are 0.
Most of the prairies averaged 5C or more below “normal”. Click for bigger.
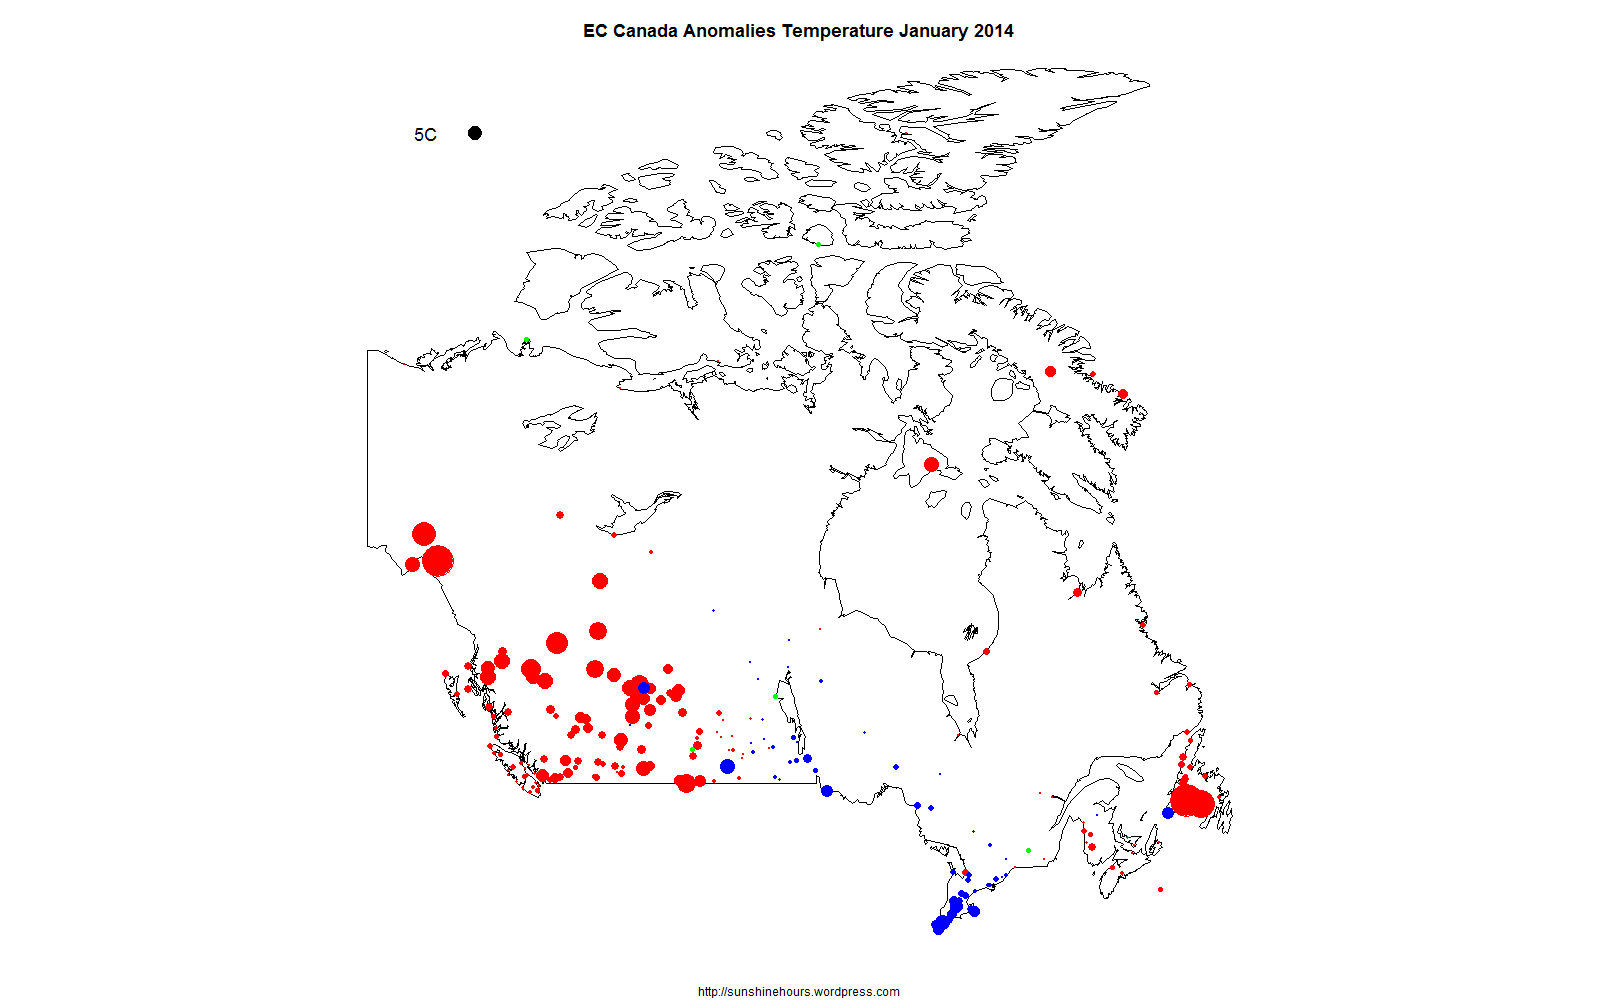
I have mapped the January 2014 anomalies in the Environment Canada monthly summaries that have “normals”. The anomalies are calculated from selected stations based on the 1971-2000 average.
The size if the dot represents the size of the anomaly. The 5C black dot in the top left hand corner represents 5C difference from “normal”. Red dots are warmer than normal. Blue are cooler. And Green are 0.
Not much sign of the Polar Vortex in BC and Alberta for January. A big change from December.
Yesterday I mapped the anomalies for 2013 using the Environment Canada monthly summaries that have “normals”. The anomalies are calculated from selected stations based on the 1971-2000 average.
Today I thought … why not 1930. I picked 1930 because I know the dustbowl occurred in the 1930s. So I assumed it would be warm at times. Remember, this is the anomaly from the 1971-2000 averages. It started out cold, but December was 3.21C warmer!
An example of the effect of the dustbowl. “In 1928, the net Farming income was $363 million; by 1933, it dropped to $11 million; and by 1937, two-thirds of the farm population of Saskatchewan was destitute.”
Click for a bigger version. (The black dot in the top left corner represents a 5C difference. Red = hotter than 1971-2000. Blue = colder.
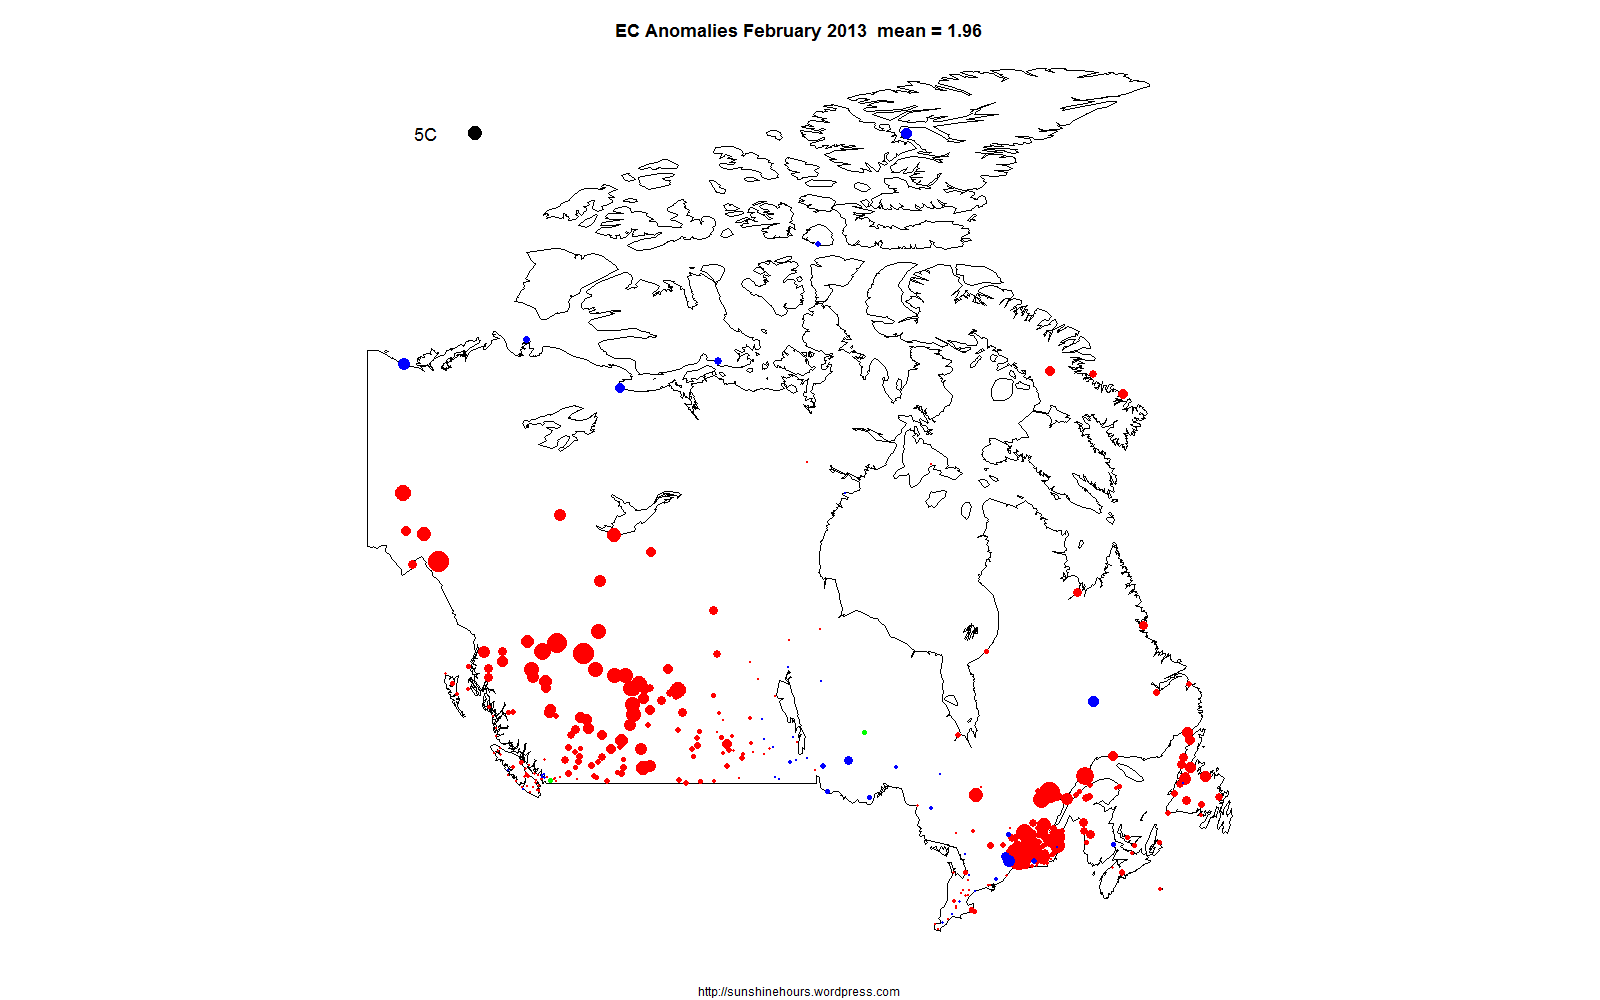
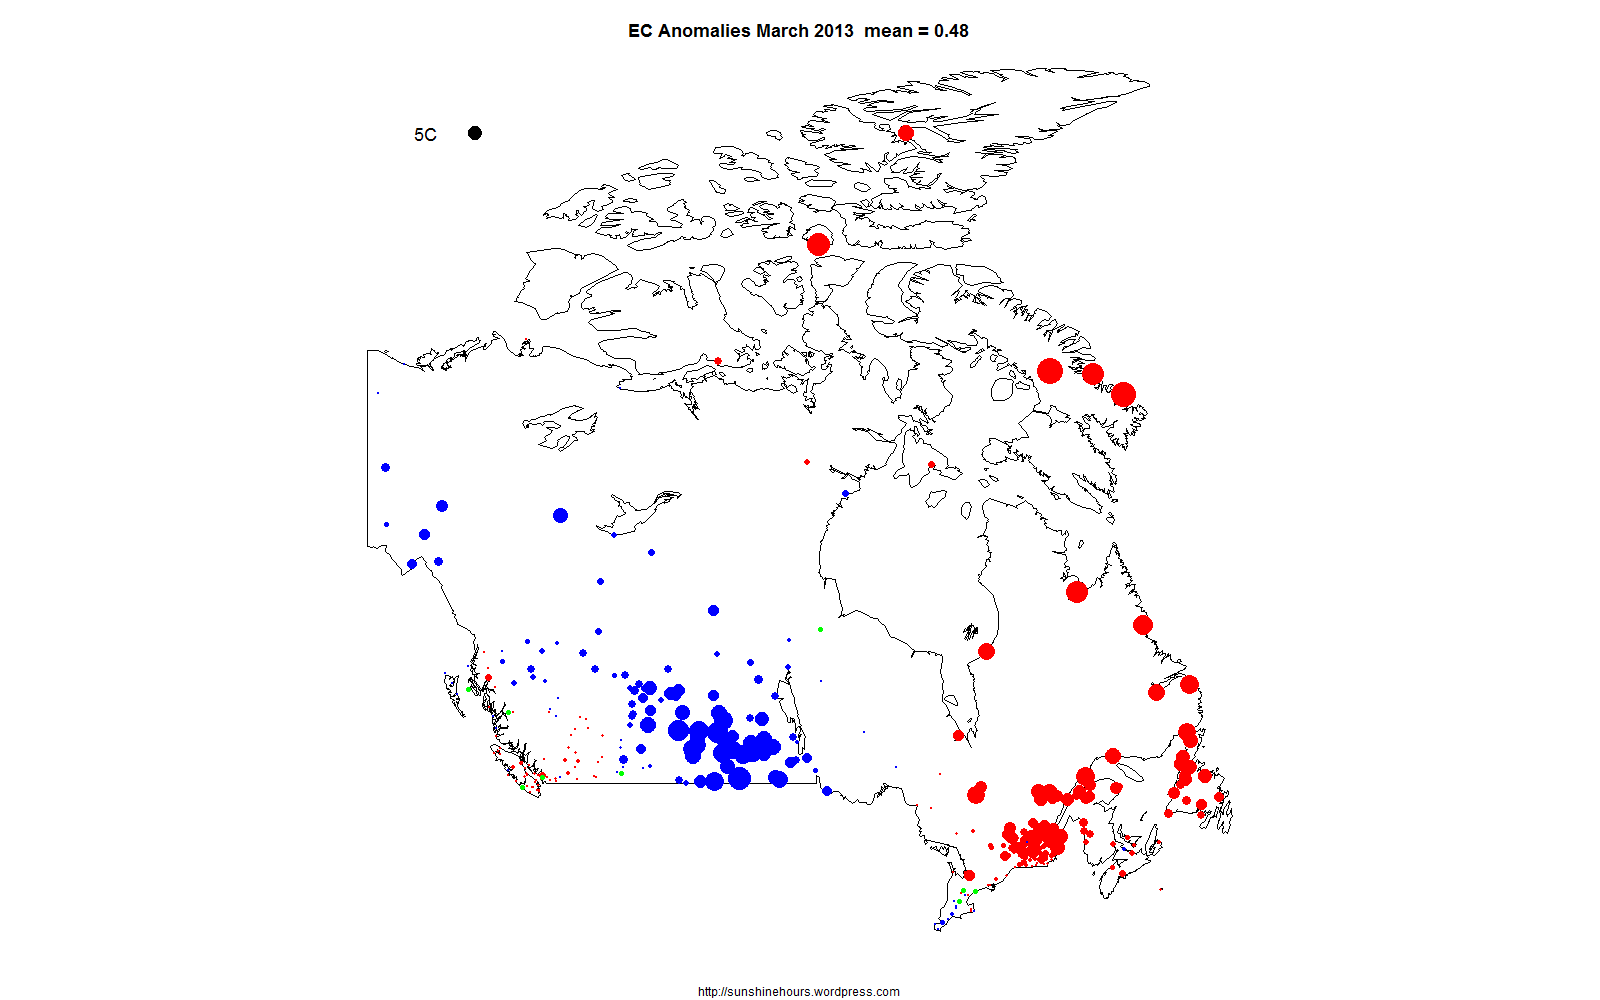
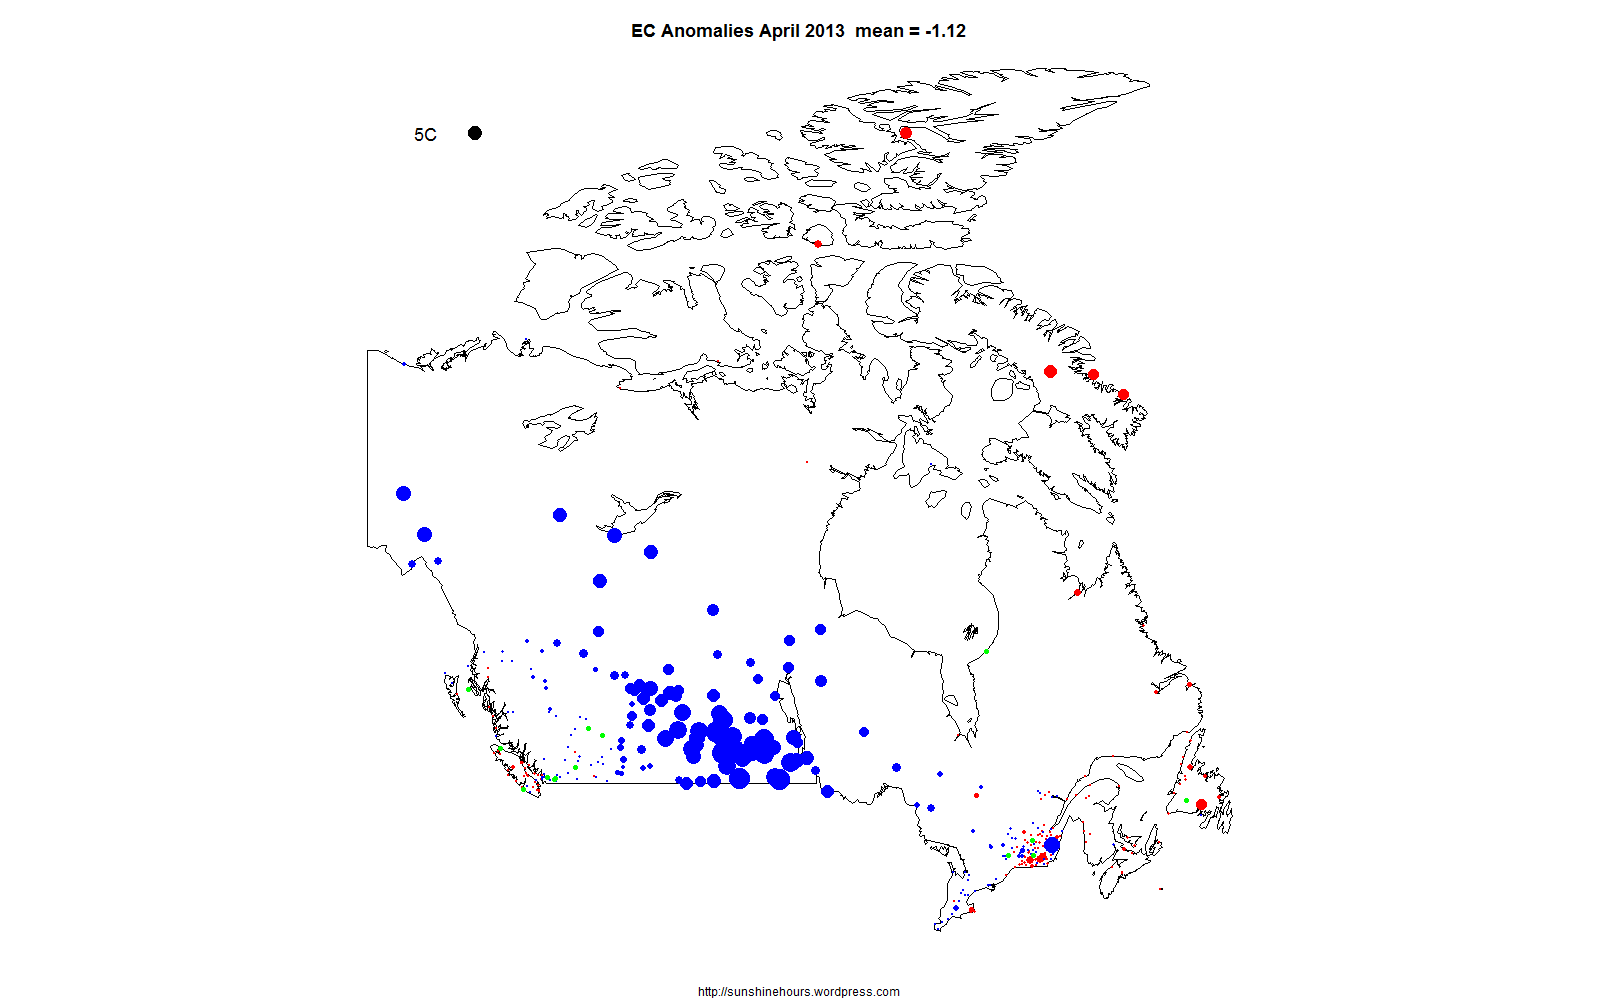
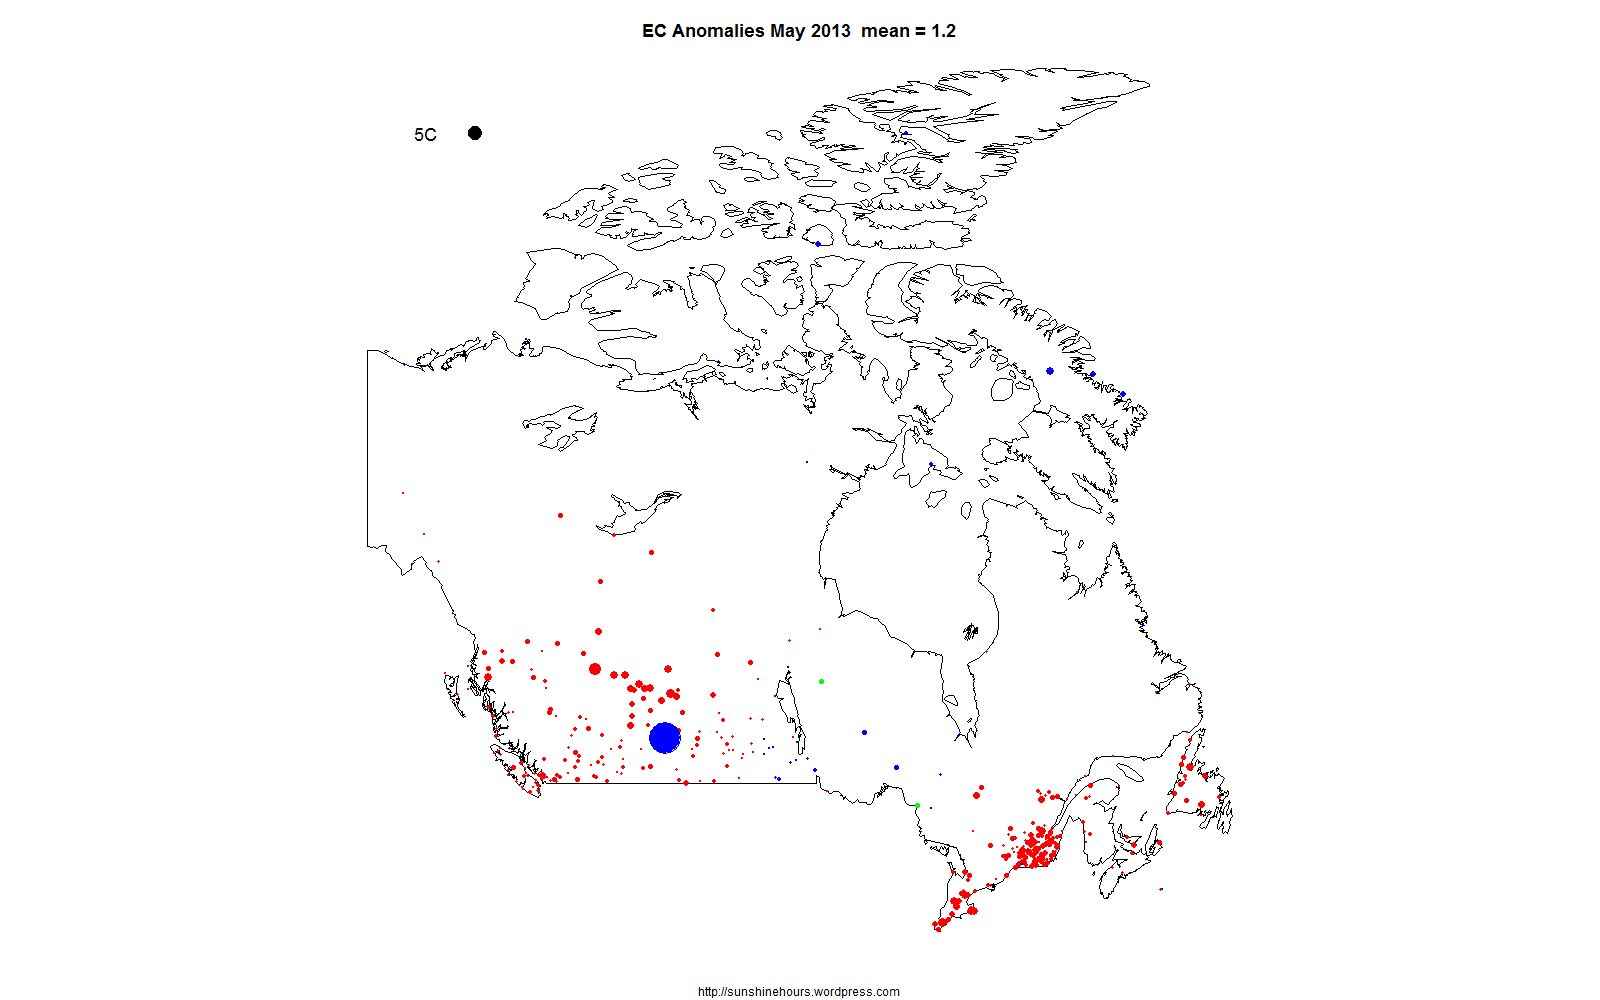
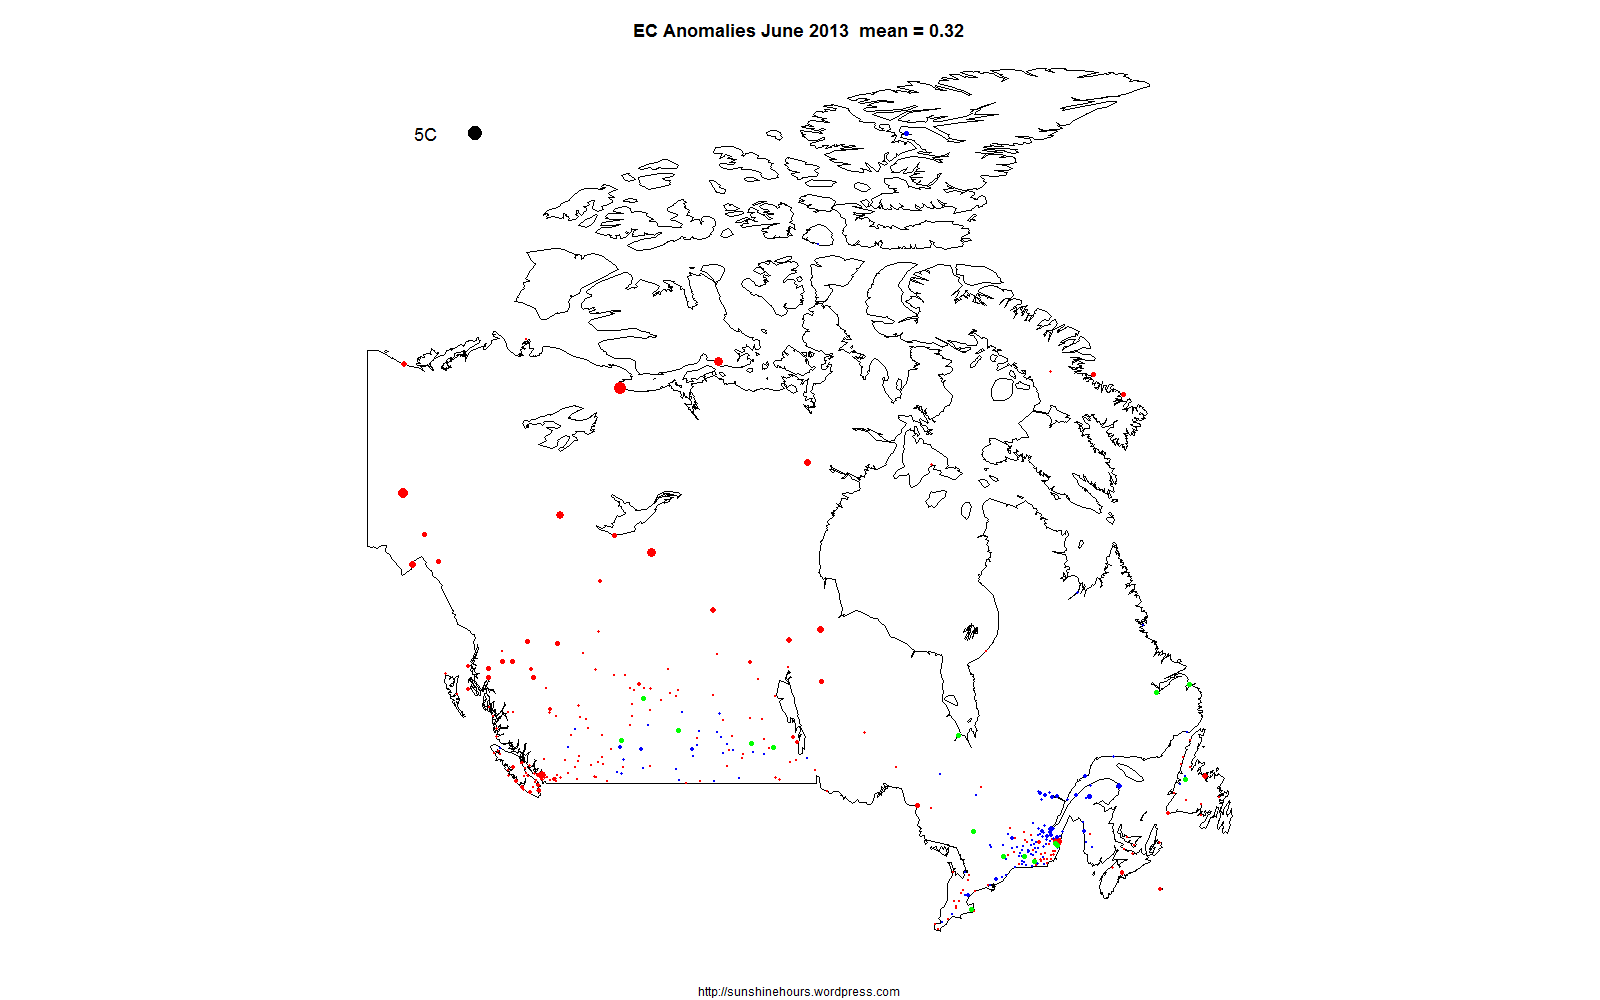
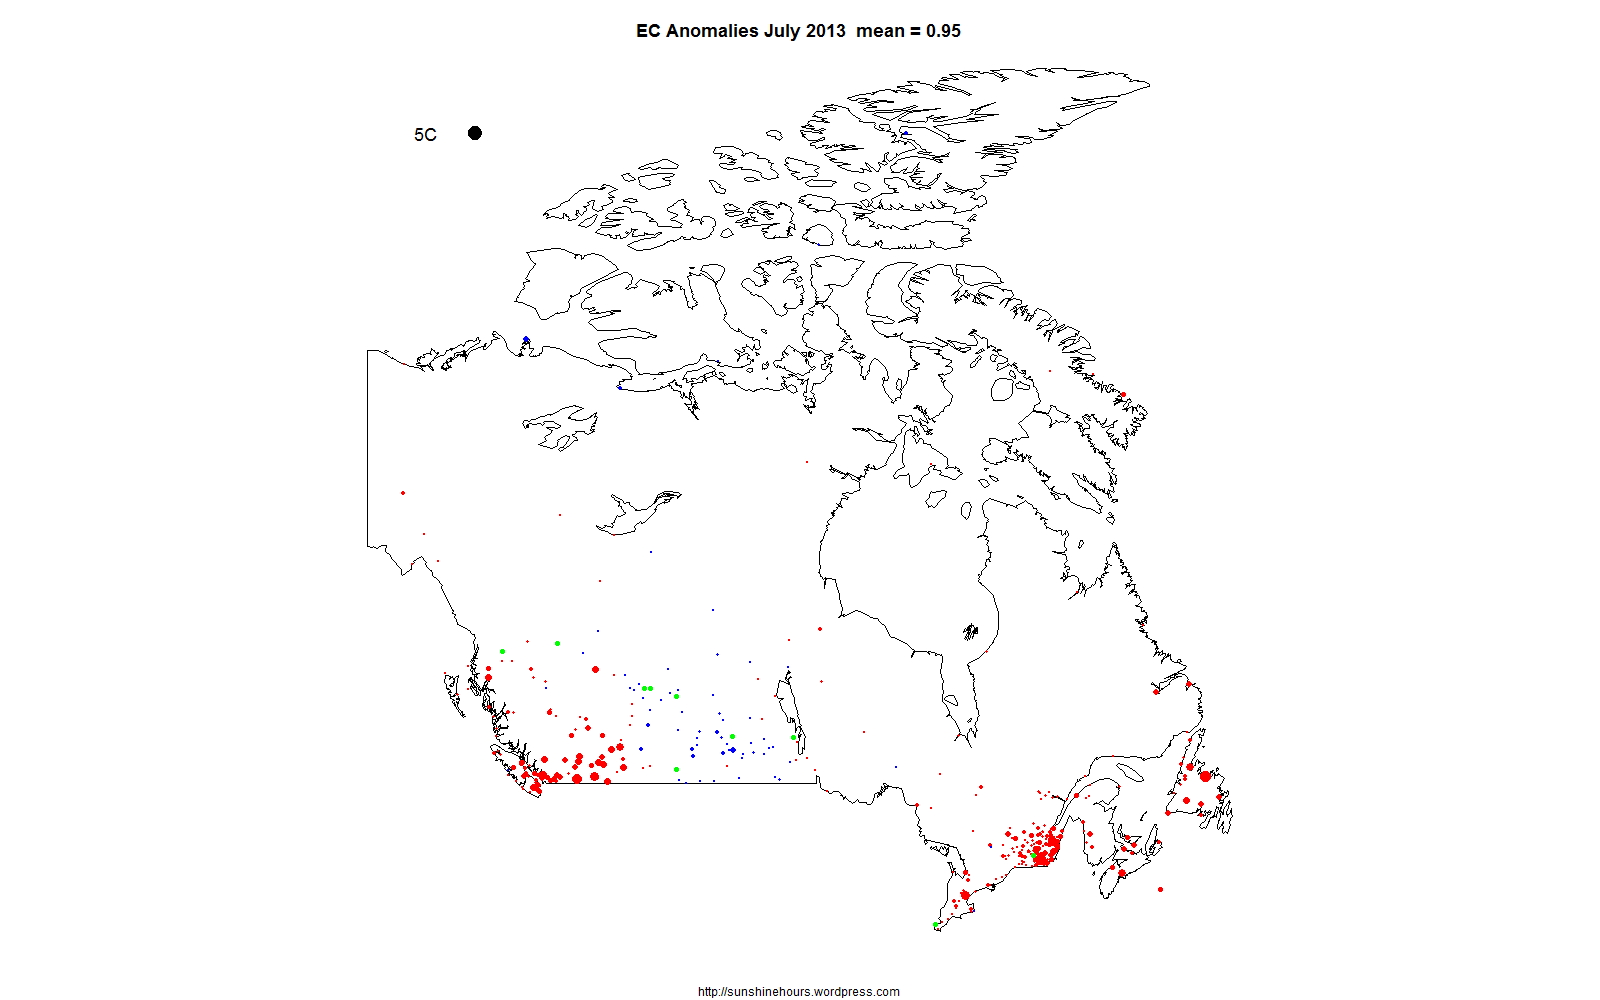
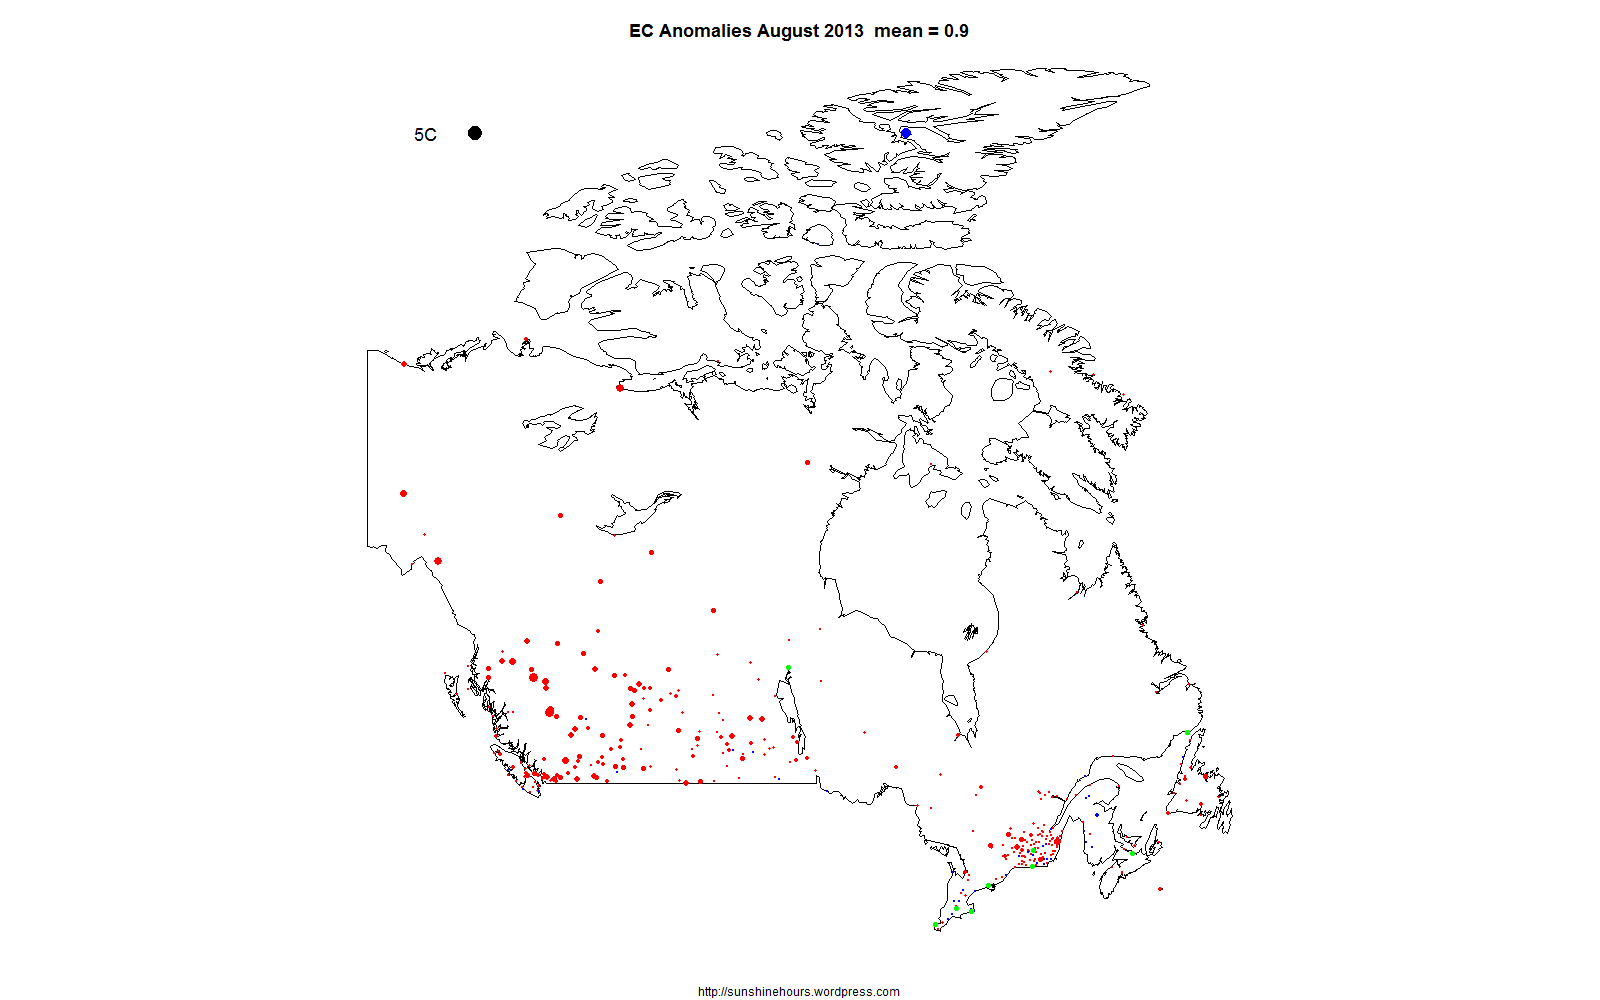
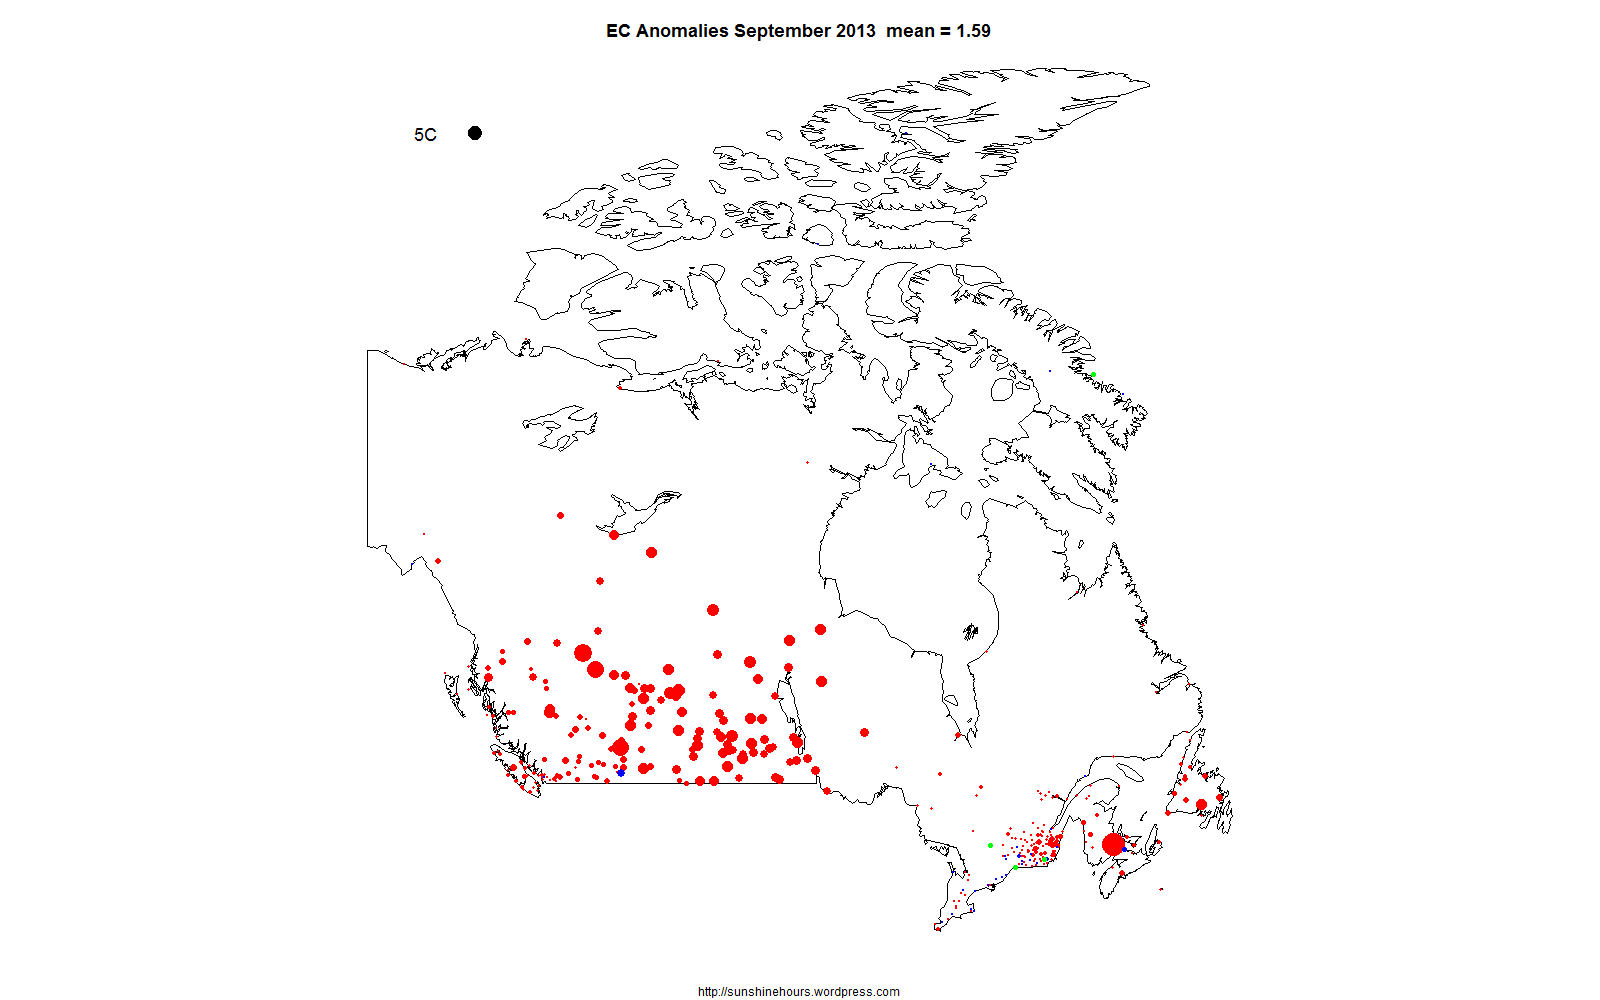
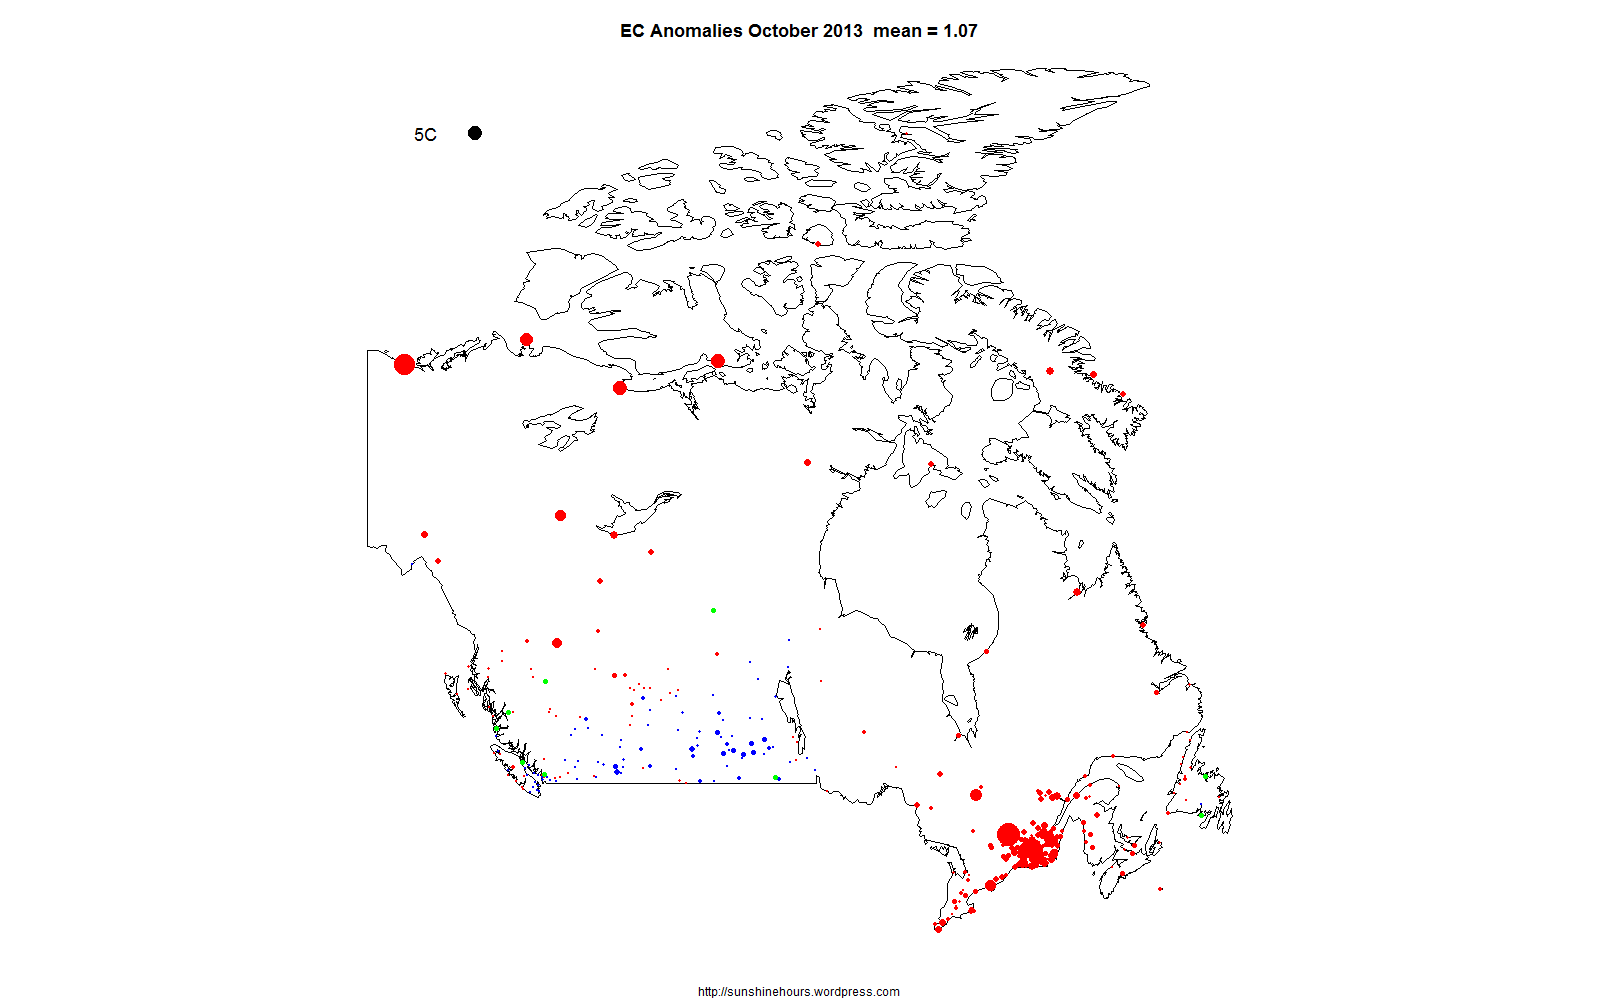
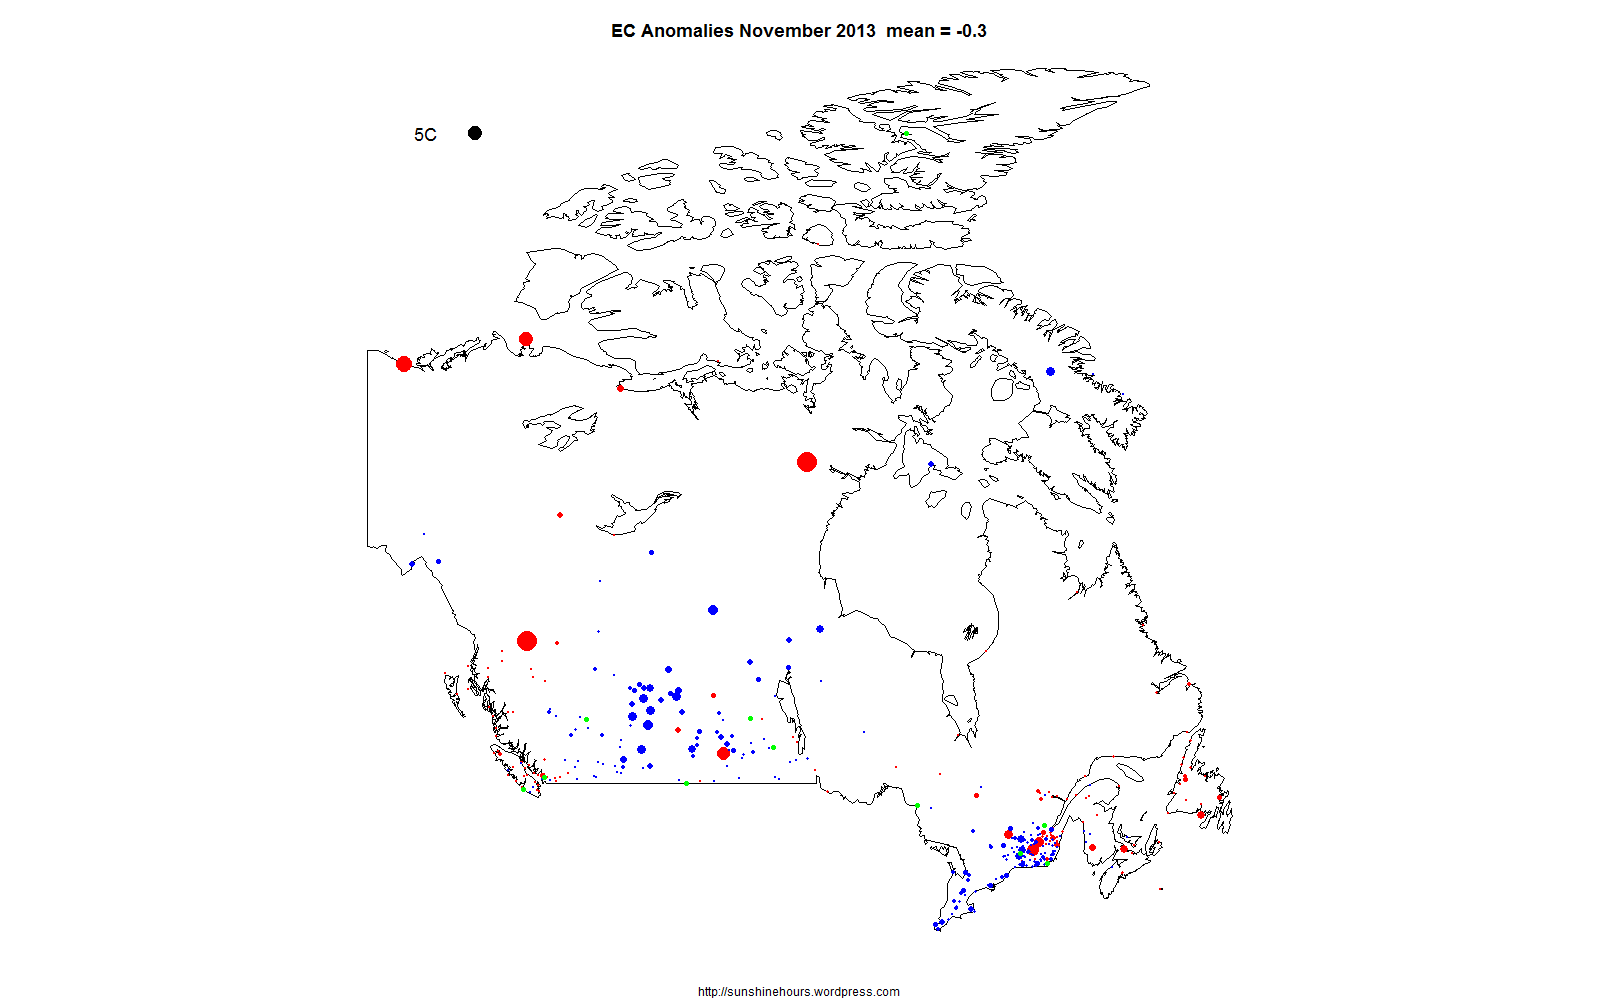
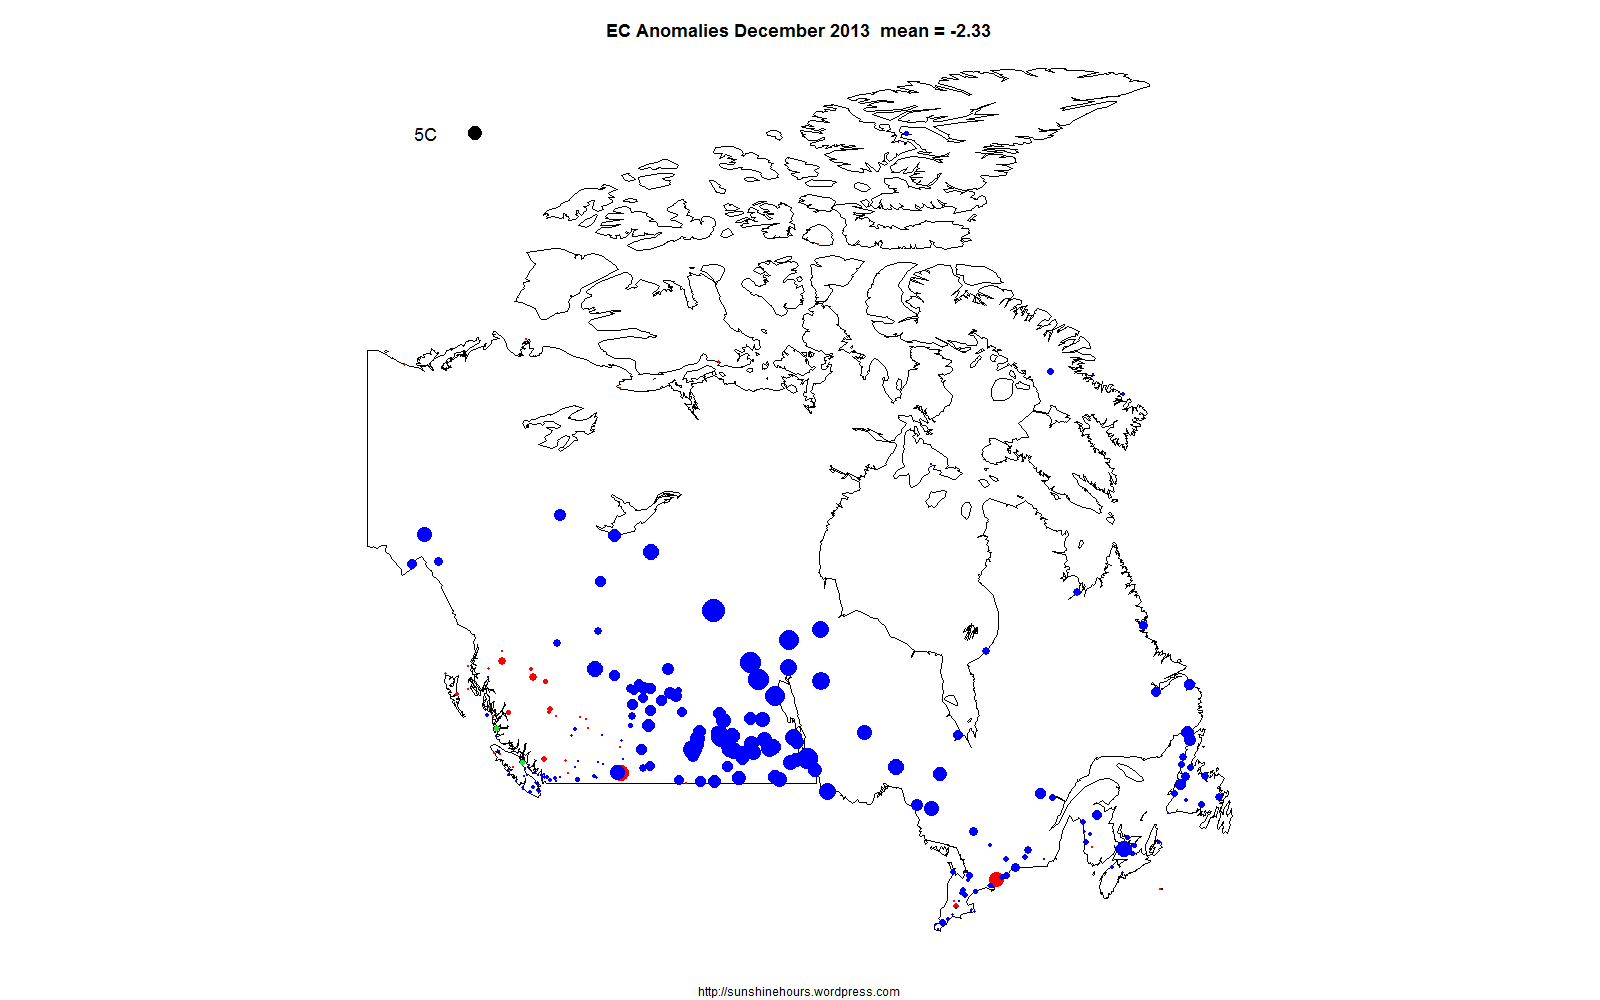
I have mapped the anomalies in the Environment Canada monthly summaries that have “normals”. The anomalies are calculated from selected stations based on the 1971-2000 average.
The 5C black dot in the top left hand corner represents 5C difference from “normal”. Red dots are warmer than normal. Blue are cooler. And Green are 0.
April was cold. December ended up very cold across the country.
There is an animated gif at the top showing all months of 2013. You may have to refresh this page or click on the gif to get the full effect.