HADCET – How Far Can You Go Back? June 1663 to June 2013 has a flat trend

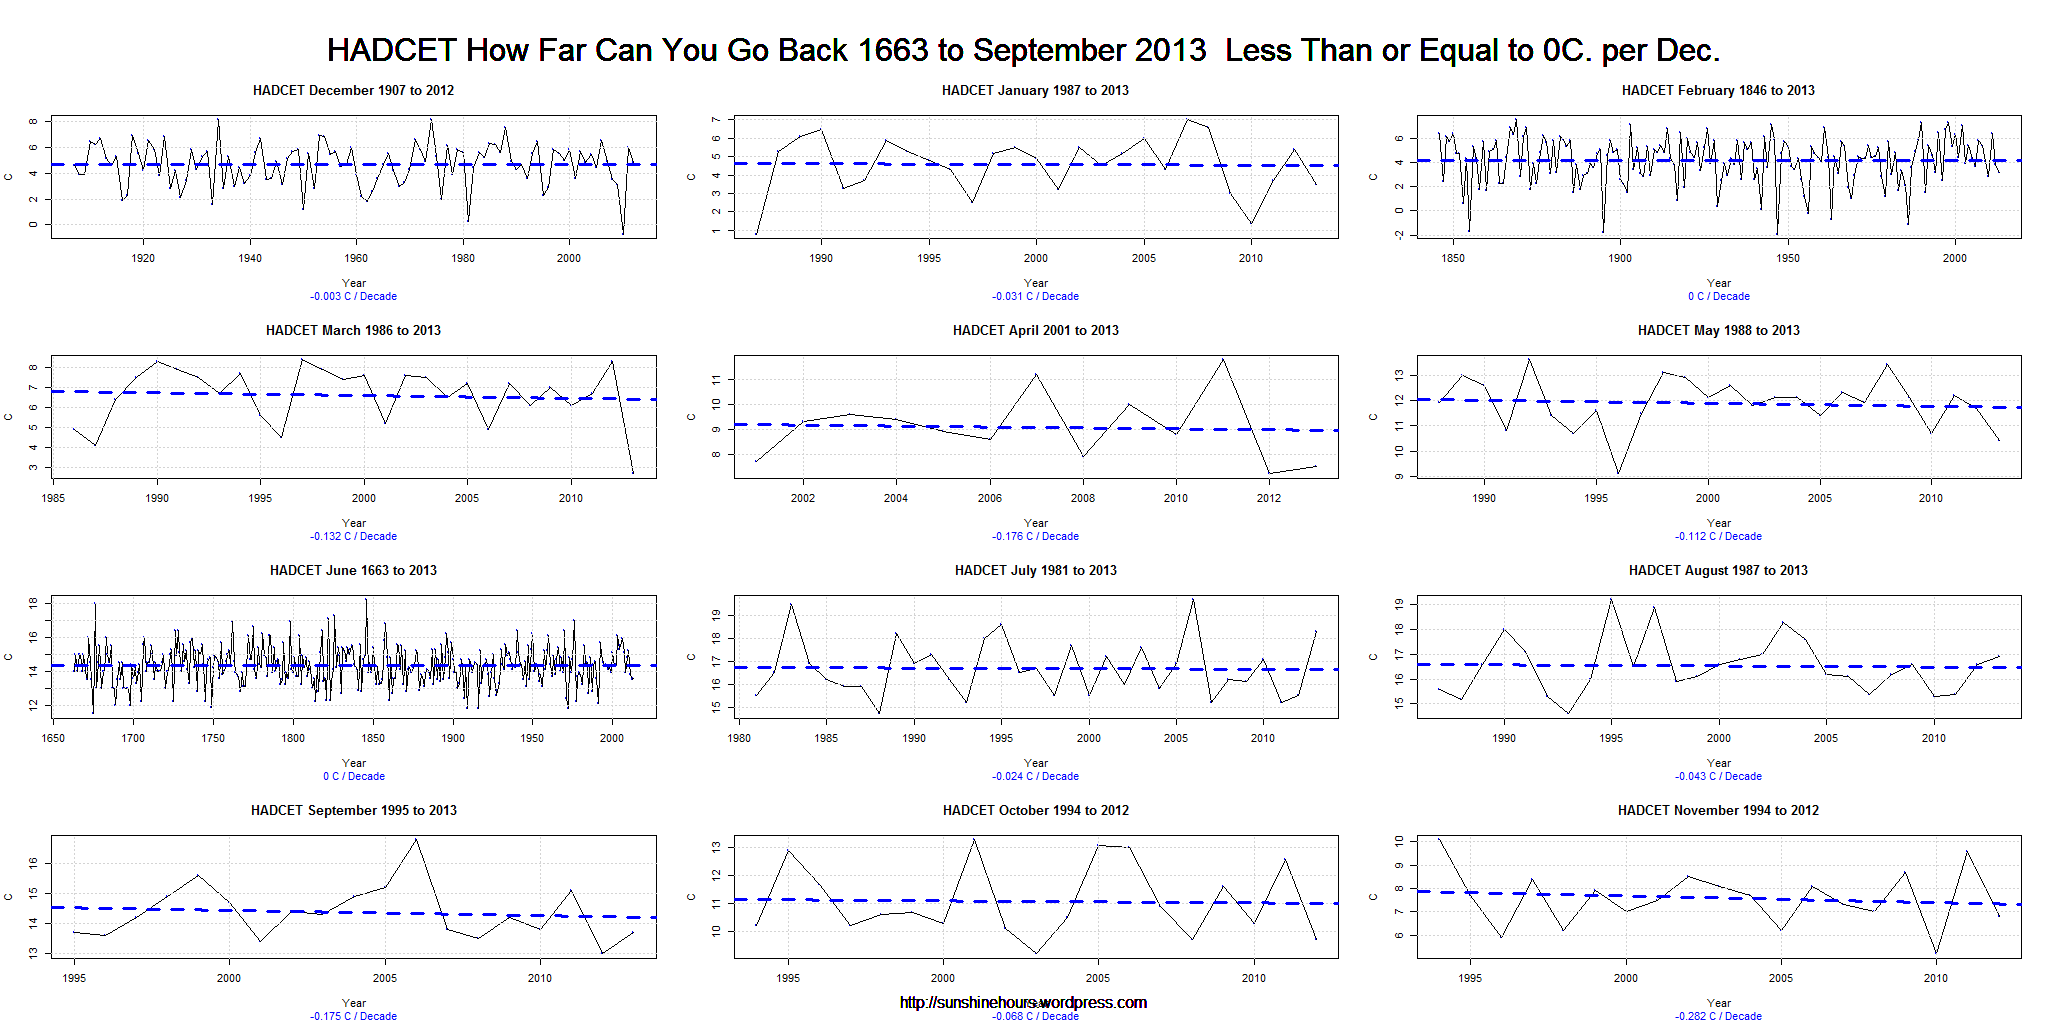
I was looking at the HADCET data by month out of curiousity and I noticed that the month of June had a pretty flat trend for a long, long time.

So I thought to myself, how far can I go back with HADCET and get a flat or just slightly flat trend for individual months?

The graph below (click for full size) has a graph for each month. The months are grouped by season. And the data for each month is the the furthest back you can go with a trend of 0C/decade or lower.

The grand champion is June. The trend is 0C/decade from 1663 to 2013.

Wow.  Not much of a “Global Warming Signal” in a 350 year flat trend is there?

2nd longest is February with 0C/Decade trend from 1846 to 2013.

3rd longest is December with a -0.003C/Decade trend from 1907 to 2012.

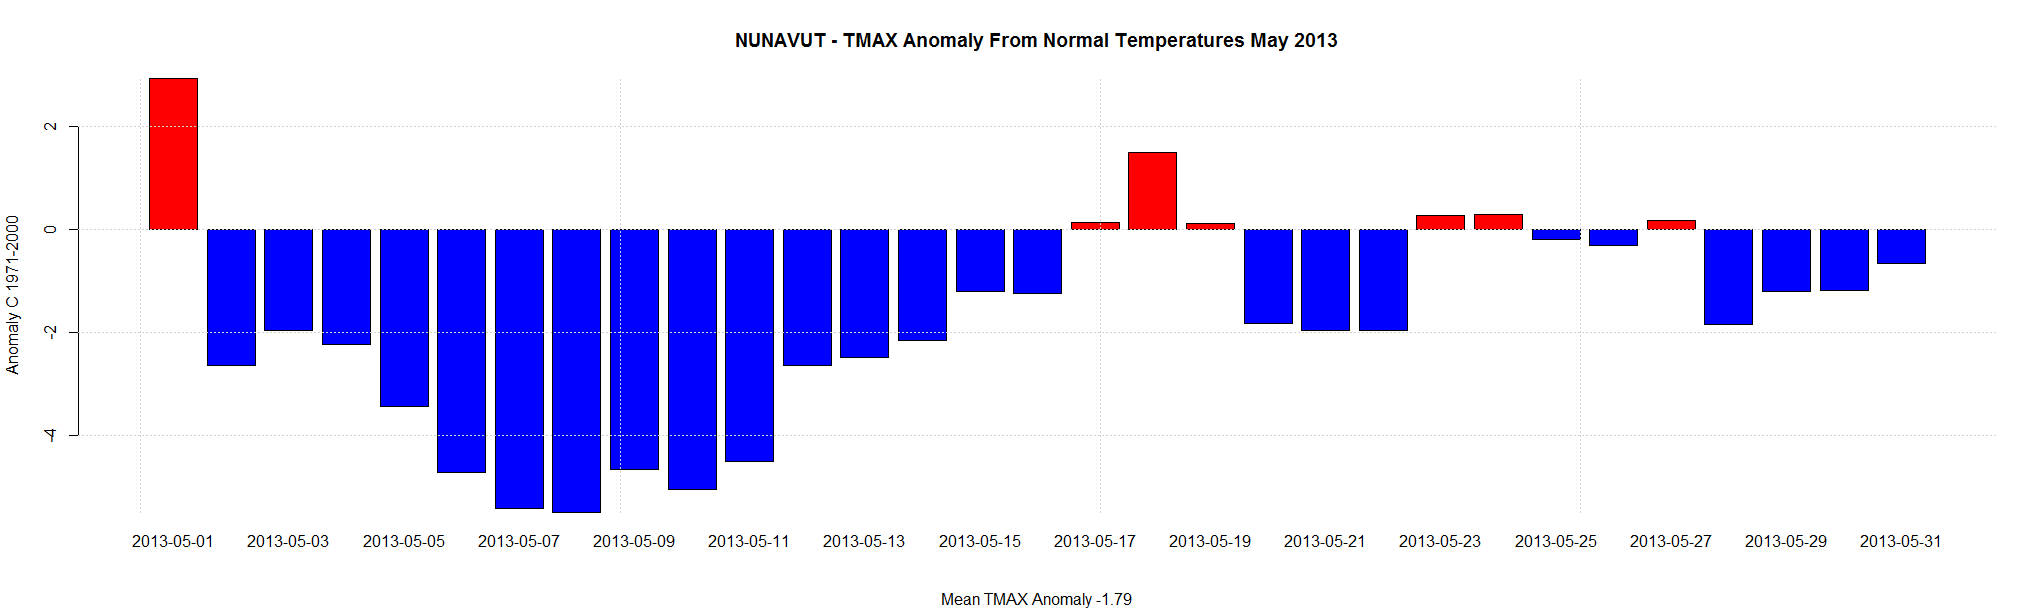
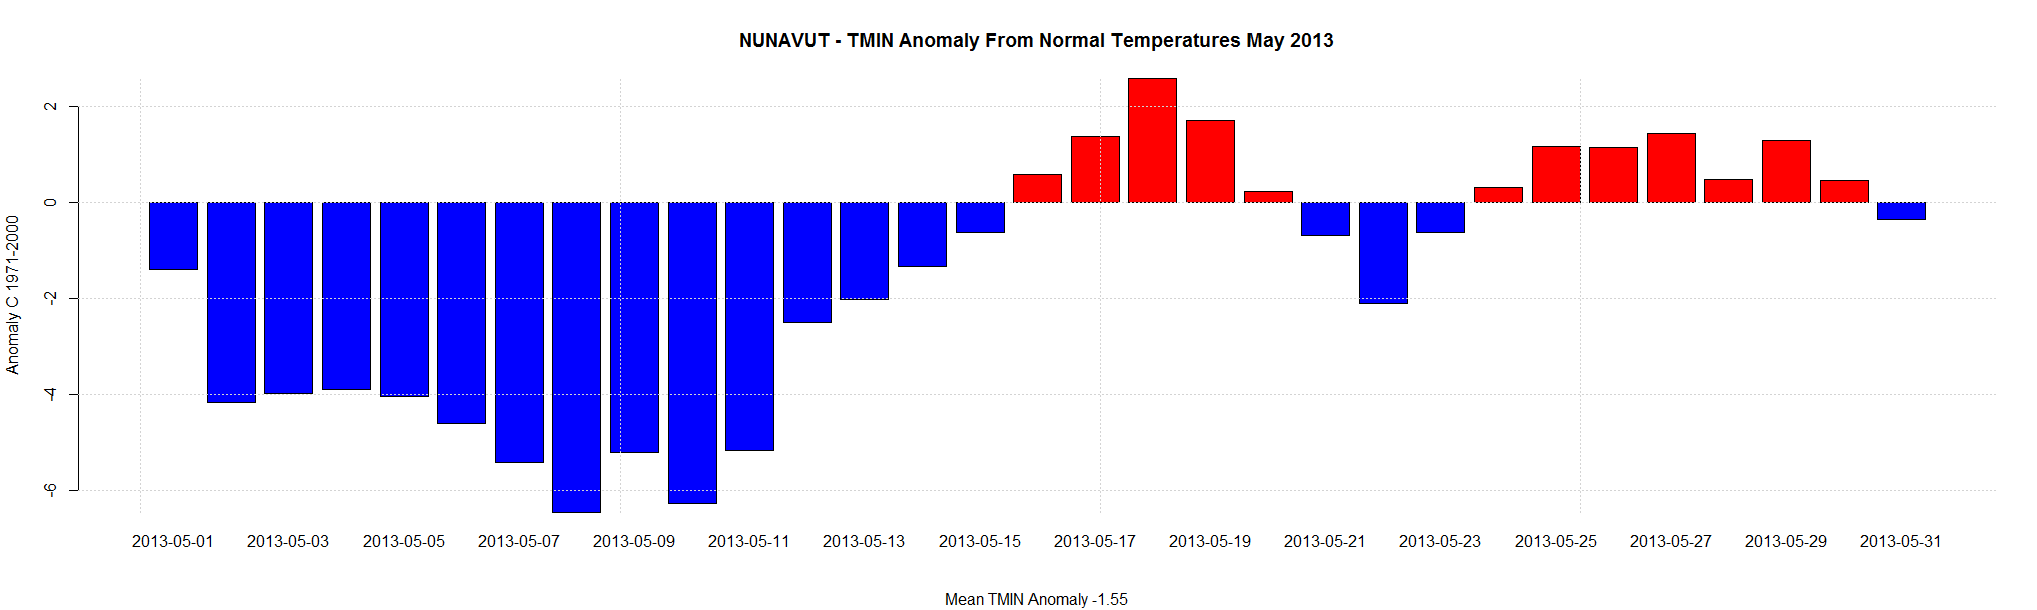
4th is July from 1981. 5th is March from 1986. 6th and 7th is January and August from 1987.  May from 1988. October and November from 1994, September from 1995, And April from 2001,

I always wonder why CO2 is such a selective month.

HADCET How Far Can You Go Back 1663 to September 2013  Less Than or Equal to 0C. per Dec.

Antarctic Sea Ice Area 85,200 sq km short of an all time record

Antarctic Sea Ice Area came within 85,200 sq km short of an all time record.   Sea Ice Area reached 16.14718 million sq km on day 282. This was the 7th highest of all time.

I normally do Sea Ice Extent, but Cryosphere uses Sea Ice Area.

Sea Ice Area had lagged Extent for most of the peak, but suddenly advanced after the normal maximum was reached. The maximum for 2013 was reached on day 282 which is 19 days later than the 2007 record.

2007 holds the record for most Sea Ice Area at 16.23238 million sq km.

Antarctic_Sea_Ice_Day_288

Northern Hemisphere Winter Doom By Latitude Band

Winter temperatures in the Northern Hemisphere are dropping as much as 2.5C / decade over the last 7 years.

Yesterday my post was a look at the northern hemisphere by month over the last 7 years.

Today I am looking at the same time frame, but I am using the gridded HADCRUT4 data for Dec/Jan/Feb only. You will have to click on the image to get the full effect.

There are 7 latitude bands with yellow highlighting. The trend in those is from -.44C/decade to -2.49C/decade. And note the green 0 line. 0 is the 1961-1990 average, Anywhere the graph or trend crosses the green line it is colder than the 1961-1990 average. It was pretty cold in the 60s and 70s.

I wish I didn’t live in the 50th parallel.

Highlighted Dec Jan Feb HADCRUT4 By Latitude Band - Last 7 Years as of 2013-7


HADCRUT4 Northern Hemisphere Winter Doom

Do you live in the Northern Hemisphere.? Did anyone tell you that in the midst of record CO2 levels HADCRUT4 shows massively dropping winter temperatures?

At the bottom of this post is a graph of HADCRUT4 Northern Hemisphere only temperatures for each month for the last 7 years.

Did you know December was cooling at -.9C per decade? By 2100 December could be 8C colder?

Did you know January was cooling at -.73C per decade?

Did you know March was cooling at -.56C per decade?

Did you know February was cooling at -.19C per decade?

Did you know November was cooling at -.2C per decade?

Did you know October was cooling at -.17C per decade?

Did you know April was cooling at -.17C per decade?

I’m glad I have a wood stove.

Average HADCRUT4 Northern  Last 7 Years


HADCRUT4 10 Years By Month = AMO

Over the last 10 years HADCRUT4 has had a slightly negative trend. But the months each have their own trend.

September to April have been cooling, while May – August have been warning, All 12 months with trends are below.

I wonder why CO2 has forsaken the winter months?

The interesting thing is this matches the AMO as you can see in the post I did in January. (I would do a new post but the US shutdown has shutdown the page I got the AMO data from).

When the AMO finishes going negative this will be very bad news for the CO2/Warmist Cult.. And even worse news for the world’s agriculture.

Right now, Dec/Jan/Feb are cooling at -0.17C/decade to -0.25C/decade. Brr.  Germany is already off to the coldest start of winter in 200 years.

Average HADCRUT4 Global  Last 10 Years

NASA Misleads About “Warming Hole” in SouthEast

NASA is telling lies about the southeast USA. They claim that sulphates were causing the Southeast to stay cooler and masking AGW. For some reason they use the term “warming hole”.

Read about it here.

How do they explain that it was warmer in the southeast in the 20s and 30s than now?

Here is the big lie that jumped out at me.

“As a response to the declining sulfate levels, Leibensperger’s modeling shows temperatures over the central and eastern United States have increased by 0.3°Celsius between 1980 and 2010.”

The trend from 1980 to 2010 (using NASA’s own data) is indeed .2C per decade.

But the trend from 1990 to 2010 is in fact negative.  It is -.2C per decade.

And the trend from 1895 to 2010 is FLAT!

All 3 graphs below:

southeast_1895-2010

southeast_1980-2010

southeast_1990-2010

Boris Johnson Mocks the AGW Cult

Boris Johnson , the Mayor Of London, mocks the AGW Cults total inability to predict climate.

“For more than 20 years now, we have been told that this country was going to get hotter and hotter and hotter, and that global warming was going to change our climate in a fundamental way. Do you remember that? We were told that Britain was going to have short, wet winters and long, roasting summers. It was going to be like 1976 all over again, with streakers at Lord’s and your Mr Whippy melting before you could even lick it, and Hyde Park scorched into a mini Kalahari.

They said we were never going to have snow again, and that we should prepare for southern England to turn gradually into a Mediterranean world. There were going to be olive groves in the Weald of Kent, and the whole place was going to be so generally broiling in summer that no one would be able to move between noon and 4pm, after which people would come out to play boules and sip pastis, to the whine of a mandolin, in the dusty square that had once been a village green.

That’s what they said: the BBC, and all the respectable meteorologists – and I reckon there were tens of thousands of people who took these prophecies entirely seriously. Omigod, they said to themselves, we are all going to fry.

I hope I don’t need to tell you that we have not experienced a Mediterranean climate – not since they started to tell us to expect it. On the contrary, we have had some pretty long and miserable winters – including the last one, in which I saw snow settle in London on four separate occasions – and our summer is at risk of becoming a bit of a farce.”

http://www.telegraph.co.uk/topics/weather/10138096/The-weather-prophets-should-be-chucked-in-the-deep-end.html?placement=mid2


NOAA May 2013 – 39 Other Mays Were Warmer Including 1896,1897,1900,1902,1911,1914 ….

The NOAA ranked May 2013 80th out of 119. Which means 39 other Mays were warmer.

Here they are: 1896,1897,1900,1902,1911,1914,1922,1928,1934,1936,1937,1939,1941,1944,1949,1955,1956,1958,1962,1964,1969,1970,1977,1985,1986,1987,1988,1991,1992,1996,1998,2000,2001,2003,2004,2006,2007,2009,2012

May of 2013 was 3.5F colder than 1934 and even 1.24F colder than 1896.

May in the USA has been cooling at -0.55F per decade.

NOAA_MAY_2013

Canada May 2013 – Nunavut Daily Anomalies

Nunavut (northern Canada) was the coldest Province/Territory in May.

Environment Canada calculates “Normals” for a subset of stations. Those are the anomalies from the 1971-2000 average.

The following barplots are of the daily anomalies (TMax and TMin) for each Nunavut station (that have Normals) averaged together.

The coldest part of the month was 6 to 7C below the 1971-2000 average. So much for the overheating Arctic.

NUNAVUT - TMAX Anomaly From Normal Temperatures May 2013 NUNAVUT - TMIN Anomaly From Normal Temperatures May 2013