Antarctic Sea Ice – 22nd Daily Record of 2014 – 18th In A Row – Day 39

The 22nd daily record for Antarctic Sea Ice Extent in 2014 was set yesterday on Feb 8  (Day 39). The old record was from 2008.

The old record was broken by 78,260 sq km. Sea Ice is 807,000 sq km above the 1981-2010 mean.

I’ve added the 2008 Highest Minimum point to this graph. (But it isn’t looking as good for a new record now). Data is here. Click for bigger.

Antarctic_Sea_Ice_Extent_Zoomed_2014_Day_39_1981-2010


Extreme Weather Alert: Canada February 1936

The AGW cult likes to talk about “extreme weather” as if that is a new thing and all was nice and calm in the past before that evil CO2 came along. What a load of bull.

Inspired by my own post about 1930 temperatures  in Canada and Steven Goddards post about “extreme weather” in Montana in 1936,  I thought I should take a quick look at 1936.

Imagine you are in the middle of the worst 10 year heatwave ever in North America — the dust bowl — and along comes February 1936. The data in the graph below are monthly averages based on the 1971-2000 normals Canada uses.

The black dot in the top left hand corner is about 5C of difference above or below the normal for that month.

Of the 184 stations, 3 were above 0. 81 were more than -10C colder than normal. Animated gif of whole year at bottom. Click for bigger.

EC MonthlyNormalsTemperature1936-02

MonthlyNormals_1936

Stations More Than -15C below normal

Prov Stn_Name Anomaly
ALTA SION -21.5
ALTA MEDICINE HAT A -20.4
ALTA VIKING -19.6
ALTA FORT MACLEOD -19.4
ALTA BEAVER MINES -19.4
ALTA GLEICHEN -19.3
ALTA LETHBRIDGE CDA -19.3
ALTA CALMAR -19
ALTA CARDSTON -18.9
SASK BEECHY -18.9
SASK PENNANT -18.7
ALTA CALGARY INT’L A -18.4
ALTA HIGH RIVER -18.2
SASK ANEROID -18.2
SASK GRAVELBOURG -18.2
ALTA MANYBERRIES CDA -18
BC FORT ST JAMES -17.8
ALTA OLDS -17.8
ALTA PEKISKO -17.7
ALTA BROOKS AHRC -17.5
SASK TUGASKE -17.4
SASK SCOTT CDA -17.4
SASK YELLOW GRASS -17.3
ALTA BEAVERLODGE CDA -17.2
SASK CHAPLIN -17.2
BC ATLIN -17.1
MAN PIERSON -17.1
ALTA LACOMBE CDA -17
SASK REGINA A -16.9
SASK WASECA -16.9
YT MAYO A -16.7
ALTA CAMPSIE -16.7
BC BALDONNEL -16.6
ALTA FAIRVIEW -16.6
SASK HARRIS -16.6
ALTA RANFURLY -16.5
SASK MIDALE -16.5
SASK KLINTONEL -16.5
ALTA ENTRANCE -16.4
ALTA CALDWELL -16.2
ALTA ELK POINT -16
SASK NOKOMIS -16
SASK SASKATOON A -16
SASK BIGGAR -15.7
SASK DAVIDSON -15.5
SASK LUMSDEN -15.5
MAN DELORAINE -15.5
SASK MUENSTER -15.4
SASK INDIAN HEAD CDA -15.3
SASK REGINA CDA -15.2
SASK PILGER -15

The NY Times Thinks It Is The “End Of Snow” For the Olympics

Some guy at the NY Times Thinks It Is The “End Of Snow” For the Olympics.

“In the last 47 years, a million square miles of spring snow cover has disappeared from the Northern Hemisphere

I suspect the “author” used 47 years because the Rutgers Snow Lab’s data for the Northern Hemisphere starts in 1967  (2014 – 47).

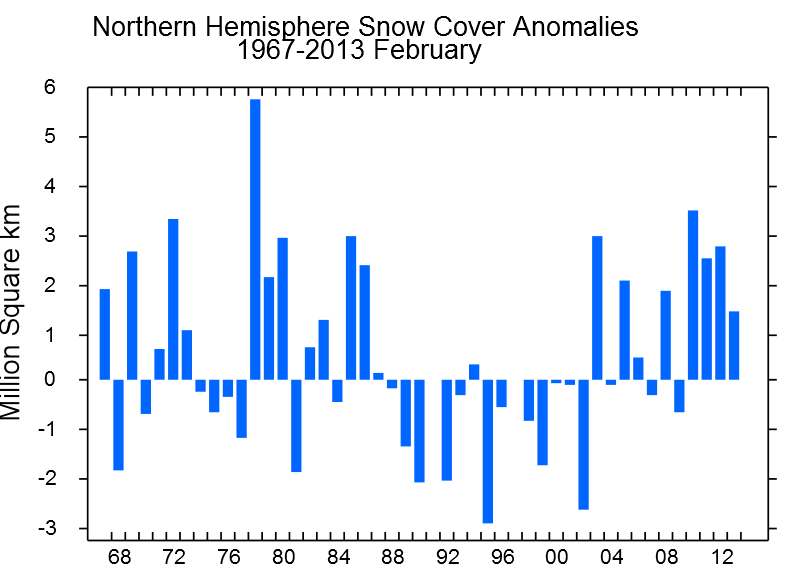
Now the Olympics usually runs in February, so lets look at snow cover data for February.

EndOfSnow

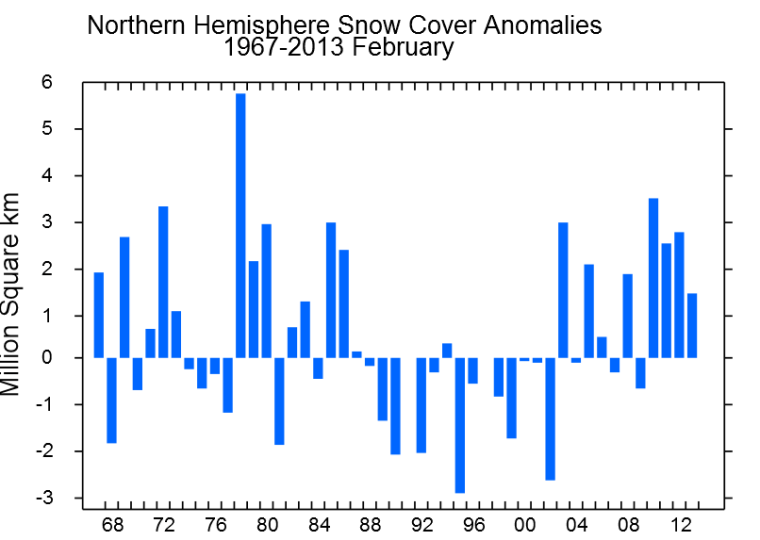
2013 in February certainly had a little less snow than 1967 (47 years ago).

But 2013 had a lot more than 1968. About 3.5 million sq km more in fact according the Rutgers snow lab.

And 2010-2013 were probably the snowiest 4 years ever. The late 1970s would be the snowiest 3 years (but that was the coldest winter in US history)

1989 to 2002 looked bad for snow. But that was a long time ago. Warmists do tend to live in the past.

Looking at that graph I would have to conclude that there is no end of snow. Snow is doing just fine in the Northern Hemisphere.

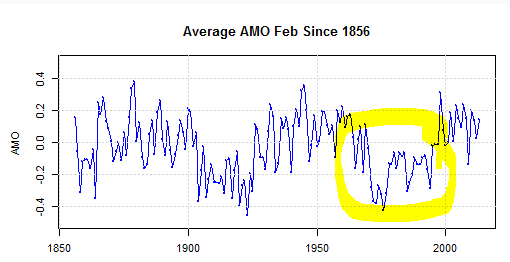
However, the lack of snow does somewhat coincide with the AMO in February being very low. But it has nothing to do with CO2.

AMO_EndOfSnow

Antarctic Sea Ice Extent is 27.4% above normal as of Feb 7 2014

Antarctic Sea Ice Extent  is really on track to have the highest minimum in the modern satellite era.

Antarctic Sea Ice Extent as of Feb 7 2014 was 904,000 sq km above the 1981-2010 mean and 220,000 sq km above 2008.

904,000 sq km above normal is 27.4%. Day 37 was the 20th daily record of the year.

I’ve added the 2008 Highest Minimum point to this graph. Data is here. Click for bigger.

Antarctic_Sea_Ice_Extent_Zoomed_2014_Day_37_1981-2010


Canada 1930- Monthly Anomalies Mapped

Yesterday I mapped the anomalies for 2013 using the Environment Canada monthly summaries that have “normals”. The anomalies are calculated from selected stations based on the 1971-2000 average.

Today I thought … why not 1930. I picked 1930 because I know the dustbowl occurred in the 1930s. So I assumed it would be warm at times. Remember, this is the anomaly from the 1971-2000 averages. It started out cold, but December was 3.21C warmer!

An example of the effect of the dustbowl. “In 1928, the net Farming income was $363 million; by 1933, it dropped to $11 million; and by 1937, two-thirds of the farm population of Saskatchewan was destitute.”

Click for a bigger version. (The black dot in the top left corner represents a 5C difference. Red = hotter than 1971-2000. Blue = colder.

MonthlyNormals_1930

Temperature North of 80 Rollercoaster

At the beginning of the year the DMI “Daily mean temperatures for the Arctic area north of the 80th northern parallel” was a few degrees C above normal.

And then it went about 12C above normal. That coincides with the Arctic Sea Ice Extent falling out of the one standard deviation point it was in on day 26

In the last week or so it has plunged back down to 7C above normal, and it looks like it will continue. I wonder what will happen?

DMI_meanT_80_Feb_5_2014

Arctic_Sea_Ice_Extent_Zoomed_2014_Day_35_1981-2010


Canada 2013 – Monthly Anomalies Mapped

I have mapped the anomalies in the Environment Canada monthly summaries that have “normals”. The anomalies are calculated from selected stations based on the 1971-2000 average.

The 5C black dot in the top left hand corner represents 5C difference from “normal”. Red dots are warmer than normal. Blue are cooler. And Green are 0.

April was cold. December ended up very cold across the country.

There is an animated gif at the top showing all months of 2013. You may have to refresh this page or click on the gif to get the full effect.

MonthlyNormals_2013

EC MonthlyNormals 2013-01
EC MonthlyNormals 2013-02
EC MonthlyNormals 2013-03
EC MonthlyNormals 2013-04
EC MonthlyNormals 2013-05
EC MonthlyNormals 2013-06
EC MonthlyNormals 2013-07
EC MonthlyNormals 2013-08
EC MonthlyNormals 2013-09
EC MonthlyNormals 2013-10
EC MonthlyNormals 2013-11
EC MonthlyNormals 2013-12

Antarctic Sea Ice – 29% Above Normal – 17th Daily Record of 2014 – 13th In A Row – Day 34

The 17th daily record for Antarctic Sea Ice Extent in 2014 was set yesterday on Feb 3 (Day 34).

The old record was broken by 290,000 sq km. Sea Ice is 980,000 sq km above the 1981-2010 mean. Thats 28.65%.

And WOW …. I know this is probably just an aberration (but it isn’t a normal time so who knows) but extent only fell 3230 sq km from day 33 to 34. Normally at this time of year extent falls around 40,000-100,000 sq km per day.

Caveat: the raw data has 0.00058 sq km in the missing column (which is usually 0). Not sure what that means, but that is only 580 sq km.

I’ve added the 2008 Highest Minimum point to this graph. Data is here. Click for bigger.

Antarctic_Sea_Ice_Extent_Zoomed_2014_Day_34_1981-2010


Antarctic Sea Ice – 16th Daily Record of 2014 – 12th In A Row – Day 33

The 16th daily record for Antarctic Sea Ice Extent in 2014 was set yesterday on Feb 2 (Day 33). For the first time this year the old record was from 2012, not 2008. 2012 did not have a high minimum, but did go on to set a new all time record at maximum (which was broken in 2013).

The old record was broken by 240,000 sq km. Sea Ice is 904,000 sq km above the 1981-2010 mean. Thats 25.76% above the 1981-2010 mean.

I’ve added the 2008 Highest Minimum point to this graph. Data is here. Click for bigger.

Antarctic_Sea_Ice_Extent_Zoomed_2014_Day_33_1981-2010