NOAA – 1025 Low Max Records Broken From Aug 1 to Aug 21. Some records Smashed by 16F

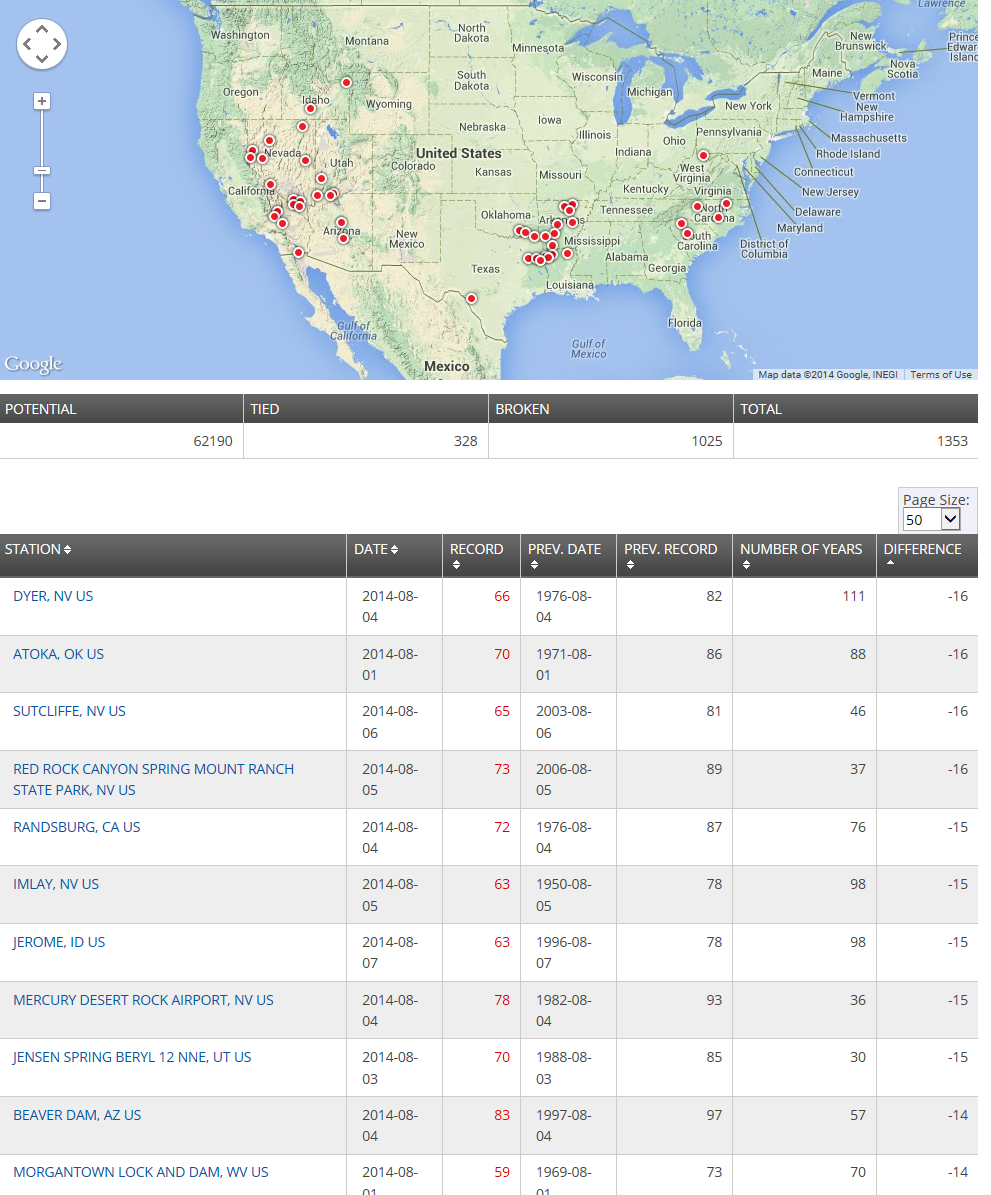
1025 Low Max Records Broken From Aug 1 to Aug 21 according to the NOAA.

A “Low Max” means that the maximum temperatures for the day was the lowest it has ever been.

This indicates daytime cooling.

Below is a screenshot showing location and the biggest difference between old record and new record.

Note that Dyer NV has 111 years of data. And the record was smashed by 16F.

LowMax_Aug_1_2014_to_Aug_21


Will Britain Enjoy Fewer Cold Days Thanks To Global Warming? No.

A new “study” is out.

“Britain will have fewer days of ‘extreme cold’ and will enjoy milder winters as a direct result of climate change, according to a new study.

The new research is set to cool growing fears that the Northern Hemisphere could be gripped by more severe winters throughout the next century due to the Arctic warming up.”

In these cases I like to turn to HADCET Daily Minimum data which is available from 1878 on. And I thought I would look at the number of days that the minimum was lower or equal to 0C for each year.

 Wow. 2010 had the 6th highest number of days that were 0C or colder. So much for “Global Warming”.

Year Days Longest Coldwave
1879 91 18
1917 90 28
1887 83 11
1888 81 23
1892 80 14
2010 79 16
1963 78 27
1895 75 32
1909 75 23
1891 73 13

What about equal to or less than -5C? Wow! 2010 was 2nd highest with 21 days.

Year Days Longest Coldwave
1963 26 5
2010 21 5
1895 20 11
1892 17 7
1940 17 14
1881 16 8
1985 16 6
1879 14 7
1962 14 3
1878 13 6

614 Days Under -5C 6281 Days Under 0C

Canada March 2014 Visualized

The data is from the daily data put out by Environment Canada. (It is wrong sometimes)

These are ONLY the “Normals” stations (the stations EC calculates anomalies for from the 1971-2000 mean)

The black circle in the top left corner represents 5C divergence from the “Normals”. Blue is cold. Red is warm. Click for bigger. Refresh to make it start over.

There are 3 maps: TMean,TMin and TMax. Click on each for bigger.

TMean
TMean_DailyNormals_2014-03

TMin
TMin_DailyNormals_2014-03

TMax
TMax_DailyNormals_2014-03

Canada February 2014 Visualized

The data is from the daily data put out by Environment Canada. (It is wrong sometimes)

These are ONLY the “Normals” stations (the stations EC calculates anomalies for from the 1971-2000 mean)

The black circle in the top left corner represents 5C divergence from the “Normals”. Blue is cold. Red is warm. Click for bigger. Refresh to make it start over.

There are 3 graphs: TMean,TMin and TMax. Feb 28 had average anomalies in the -8C range. Many were more than -10C. Polar Vortex!

TMean

TMean_DailyNormals_2014-02

TMin
TMin_DailyNormals_2014-02

TMax
TMax_DailyNormals_2014-02

NOAA USA January – 67 January’s Were Warmer

According to the NOAA, January was only the 53rd warmest out of 120. That means 67 January’s (out of 120) were warmer.

The lower 48 states were pretty much divided right down the middle. Very cold in the east, warm in the west and normal in the states directly above Texas.

Alabama had its 4th coldest January in 120 years. It was -8.3F colder than normal. Minnesota was the coldest state, averaging 2.3F. Brrr. Only 52.3F colder than Florida.

Here are the maps of average temperature, rank out of 120 (120 = warmest) and temperature anomaly from 1901-2000

Average Temperature in F

NOAA_JAN_2014_Map_Average_Temperature

Rank out of 120 (120 = warmest and 1 = coldest)

NOAA_JAN_2014_Map_Rank

Anomaly in F from 1901 – 2000 average.

NOAA_JAN_2014_Map_Anomaly

Extreme Weather Alert: Canada February 1936

The AGW cult likes to talk about “extreme weather” as if that is a new thing and all was nice and calm in the past before that evil CO2 came along. What a load of bull.

Inspired by my own post about 1930 temperatures  in Canada and Steven Goddards post about “extreme weather” in Montana in 1936,  I thought I should take a quick look at 1936.

Imagine you are in the middle of the worst 10 year heatwave ever in North America — the dust bowl — and along comes February 1936. The data in the graph below are monthly averages based on the 1971-2000 normals Canada uses.

The black dot in the top left hand corner is about 5C of difference above or below the normal for that month.

Of the 184 stations, 3 were above 0. 81 were more than -10C colder than normal. Animated gif of whole year at bottom. Click for bigger.

EC MonthlyNormalsTemperature1936-02

MonthlyNormals_1936

Stations More Than -15C below normal

Prov Stn_Name Anomaly
ALTA SION -21.5
ALTA MEDICINE HAT A -20.4
ALTA VIKING -19.6
ALTA FORT MACLEOD -19.4
ALTA BEAVER MINES -19.4
ALTA GLEICHEN -19.3
ALTA LETHBRIDGE CDA -19.3
ALTA CALMAR -19
ALTA CARDSTON -18.9
SASK BEECHY -18.9
SASK PENNANT -18.7
ALTA CALGARY INT’L A -18.4
ALTA HIGH RIVER -18.2
SASK ANEROID -18.2
SASK GRAVELBOURG -18.2
ALTA MANYBERRIES CDA -18
BC FORT ST JAMES -17.8
ALTA OLDS -17.8
ALTA PEKISKO -17.7
ALTA BROOKS AHRC -17.5
SASK TUGASKE -17.4
SASK SCOTT CDA -17.4
SASK YELLOW GRASS -17.3
ALTA BEAVERLODGE CDA -17.2
SASK CHAPLIN -17.2
BC ATLIN -17.1
MAN PIERSON -17.1
ALTA LACOMBE CDA -17
SASK REGINA A -16.9
SASK WASECA -16.9
YT MAYO A -16.7
ALTA CAMPSIE -16.7
BC BALDONNEL -16.6
ALTA FAIRVIEW -16.6
SASK HARRIS -16.6
ALTA RANFURLY -16.5
SASK MIDALE -16.5
SASK KLINTONEL -16.5
ALTA ENTRANCE -16.4
ALTA CALDWELL -16.2
ALTA ELK POINT -16
SASK NOKOMIS -16
SASK SASKATOON A -16
SASK BIGGAR -15.7
SASK DAVIDSON -15.5
SASK LUMSDEN -15.5
MAN DELORAINE -15.5
SASK MUENSTER -15.4
SASK INDIAN HEAD CDA -15.3
SASK REGINA CDA -15.2
SASK PILGER -15

NOAA 2013 – Brutally Cold Spring

What a brutal Spring. in the USA according to the NOAA.

Look at all those single digit rankings. Rank: (1 = Coldest and 119 = Warmest)

3rd coldest Spring out of 119 in Minnesota.

4th coldest in North and South Dakota. 5th coldest in Arkansas.

This should not be possible if AGW was real.

State Spring_2013 Spring Rank Coldest Spring Coldest Spring F
Minnesota 35.9 3 1950 34.43
North Dakota 33.83 4 1899 31.33
South Carolina 59.3 4 1960 58.87
Arkansas 57.33 5 1960 56.47
Alabama 60.1 6 1960 59.07
Georgia 60.67 6 1960 59.77
Mississippi 60.53 6 1960 59.97
Iowa 43.87 7 1960 42.83
Louisiana 63.7 7 1931 61.9
Missouri 51.17 7 1960 49.77
North Carolina 55.93 7 1960 54.9
Tennessee 54.9 8 1960 52.93
South Dakota 40.23 9 1950 37.6
Wisconsin 38.8 9 1950 37.3
Oklahoma 56.27 11 1924 54.3
Kansas 50.5 12 1924 48.3
Florida 68.1 13 1931 66.4
Kentucky 52.8 14 1960 50.53
Nebraska 44.9 16 1917 42.97
Illinois 49.17 19 1960 46.6
Virginia 53.03 34 1960 51.03
West Virginia 49.87 34 1960 46.8
Michigan 40.97 39 1950 37.6
Michigan 40.97 39 1940 37.6
Indiana 50.03 40 1960 46.53
Texas 64.2 40 1931 60.13
Colorado 42.73 42 1917 37.23
Montana 40.57 45 1917 35.5
Maryland 51.77 50 1940 48.63
Wyoming 39.67 57 1917 32.37
Ohio 49.5 58 1926 45.07
Pennsylvania 47.47 62 1984 43.57
New Jersey 50.3 63 1940 46.27
Connecticut 47.1 71 1967 42.13
New York 43.83 75 1926 38.57
Delaware 53.33 76 1940 48.63
Utah 47.8 76 1917 39.47
Massachusetts 46.17 77 1967 40.97
Washington 48.07 82 1955 41.5
Oregon 47.4 83 1917 42
Idaho 43.97 85 1917 36.17
Rhode Island 47.5 85 1917 40.97
New Mexico 53.47 92 1917 47.53
Maine 40.83 93 1926 33.7
Vermont 42.67 94 1926 34.03
Nevada 49.93 97 1917 41.17
New Hampshire 43.43 98 1926 35.4
Arizona 60.87 108 1917 52.4
California 60.13 113 1917 52.37