Warning labels on gas pump nozels? | CTV News.
If fossil fuels are so horrible why are environmentalists using them?
Stop it.
And leave the rest of us sane people alone.
Warning labels on gas pump nozels? | CTV News.
If fossil fuels are so horrible why are environmentalists using them?
Stop it.
And leave the rest of us sane people alone.
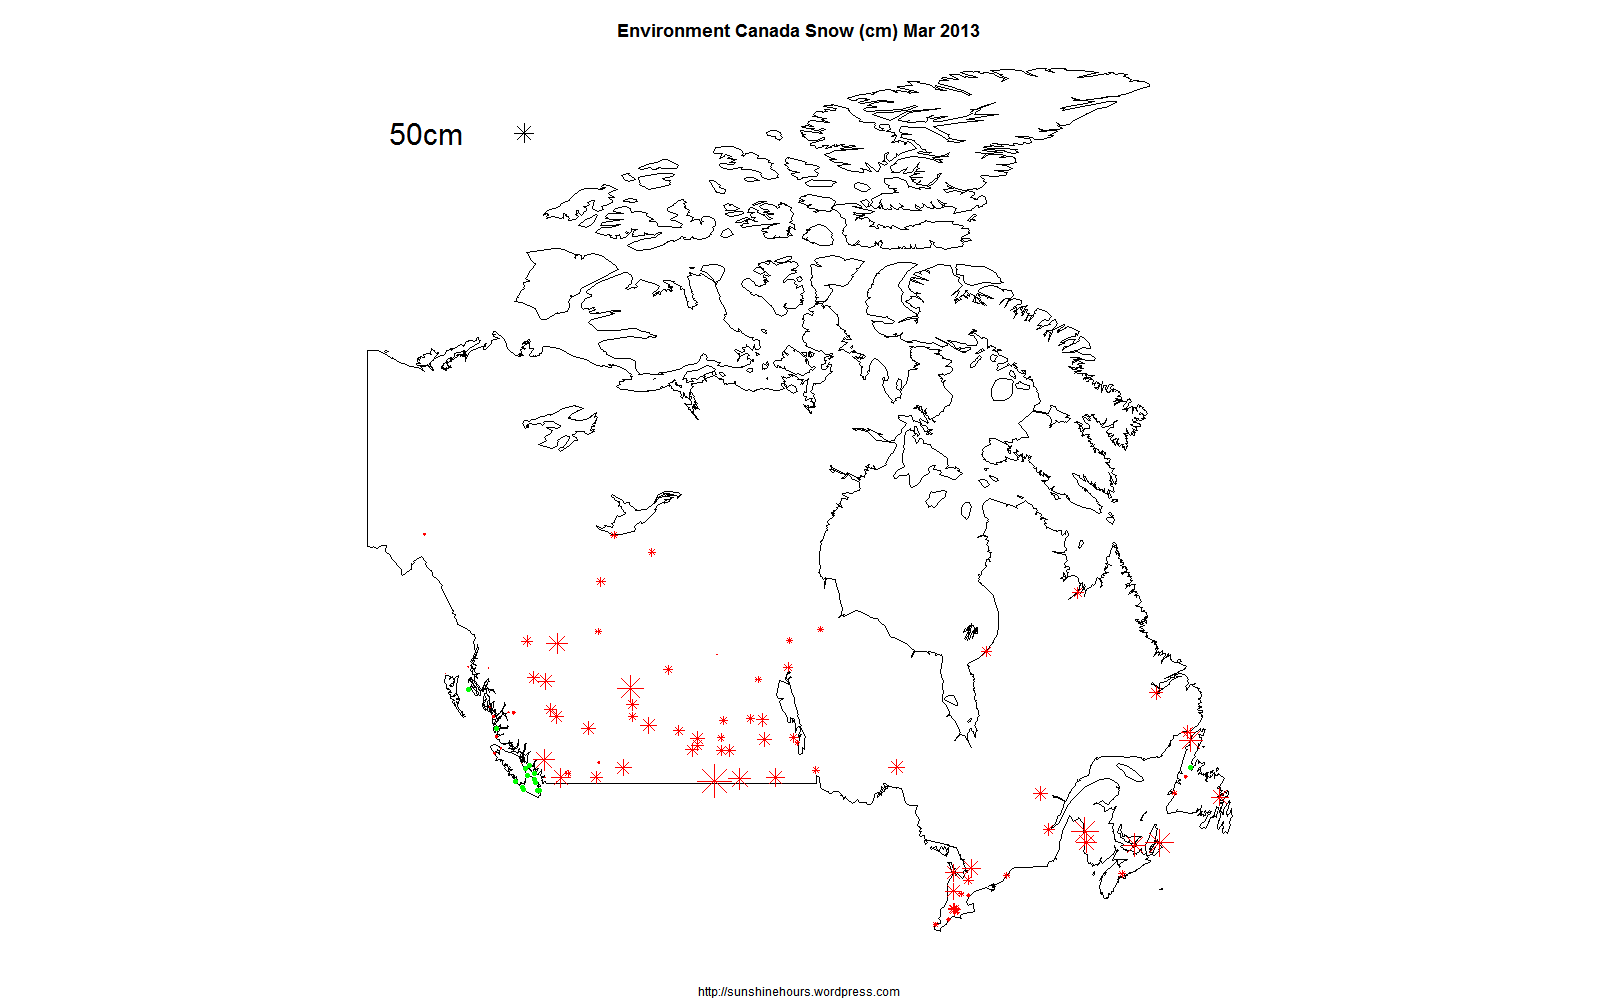
The data is from the monthly summaries put out by Environment Canada.
Snowfall is in cm. About 2.5cm to the inch for the non-metric.
Many of these stations are new and only 2 or 4 years of data. But Edmonton Woodbend has 40 years of data and broke the old record by 19.5cm.
New Snowfall Records for March 2013 = Monthly Snowfall Total
| Stn_Name | Prov | New Record (cm) | Previous Record (cm) | Difference | Previous Record Year | Years of Data |
| REGINA SIAST SNOW | SASK | 99.5 | 25 | 74.5 | 2005 | 8 |
| PUKASKWA (AUT) | ONT | 47 | 7.5 | 39.5 | 1999 | 4 |
| MOOSE JAW SNOW | SASK | 50.2 | 19.5 | 30.7 | 2005 | 9 |
| BARRIE LANDFILL | ONT | 32.5 | 3.5 | 29 | 2012 | 2 |
| OTTAWA INTL | ONT | 31.6 | 4.2 | 27.4 | 2012 | 2 |
| UNIVERSITY OF ALBERTA ME | ALTA | 58 | 32.4 | 25.6 | 2006 | 26 |
| EDMONTON WOODBEND | ALTA | 71.1 | 51.6 | 19.5 | 2005 | 40 |
| GAGETOWN A | NB | 41.9 | 22.7 | 19.2 | 2012 | 3 |
| TYNE VALLEY 2 | PEI | 41 | 23.1 | 17.9 | 2012 | 2 |
| ELMWOOD SNOW | PEI | 54.4 | 38.2 | 16.2 | 2012 | 2 |
| WILLIAMS LAKE | BC | 34 | 18.4 | 15.6 | 1943 | 13 |
| EDMONTON STONY PLAIN | ALTA | 68.4 | 53 | 15.4 | 1982 | 47 |
| SCHANZENFELD | MAN | 51.4 | 36.4 | 15 | 1996 | 23 |
| CORONACH | SASK | 88.4 | 74 | 14.4 | 1975 | 42 |
| VIRDEN WATER | MAN | 28 | 15.3 | 12.7 | 2011 | 5 |
| HOLLAND | MAN | 47 | 36.2 | 10.8 | 1995 | 29 |
| LONG CREEK SNOW | PEI | 41.5 | 31.2 | 10.3 | 2012 | 2 |
| OXBOW | SASK | 52.5 | 43.2 | 9.3 | 1964 | 63 |
| ESTEVAN A | SASK | 57 | 47.9 | 9.1 | 1955 | 68 |
| JAMESTOWN | ONT | 51.6 | 43 | 8.6 | 2008 | 7 |
| ALBERTON SNOW | PEI | 38.6 | 30.4 | 8.2 | 2012 | 2 |
| LETHBRIDGE CDA 2 | ALTA | 21 | 15 | 6 | 2009 | 7 |
| HEDLEY N | BC | 12.2 | 6.6 | 5.6 | 2011 | 6 |
| BELMONT | MAN | 57.3 | 52 | 5.3 | 2005 | 44 |
| MIDALE | SASK | 60.7 | 55.7 | 5 | 1936 | 88 |
| ROSSBURN 4 NORTH | MAN | 49 | 44 | 5 | 2008 | 27 |
| PRINCE GEORGE STP | BC | 42.4 | 38 | 4.4 | 2002 | 38 |
| PORTAGE ROMANCE | MAN | 27.9 | 24.3 | 3.6 | 2009 | 6 |
| ROCK POINT | SASK | 36.8 | 33.6 | 3.2 | 1982 | 40 |
| BALACLAVA | ONT | 53.7 | 50.8 | 2.9 | 2008 | 7 |
| EUREKA | NU | 12 | 10.2 | 1.8 | 1980 | 65 |
| BONNER LAKE | ONT | 84.8 | 83.4 | 1.4 | 1997 | 21 |
| MORELL SNOW | PEI | 43.4 | 42.2 | 1.2 | 2012 | 2 |
| CARMAN | MAN | 59 | 58 | 1 | 1979 | 48 |
The data is from the monthly summaries put out by Environment Canada.
Snowfall is in cm. About 2.5cm to the inch for the non-metric.
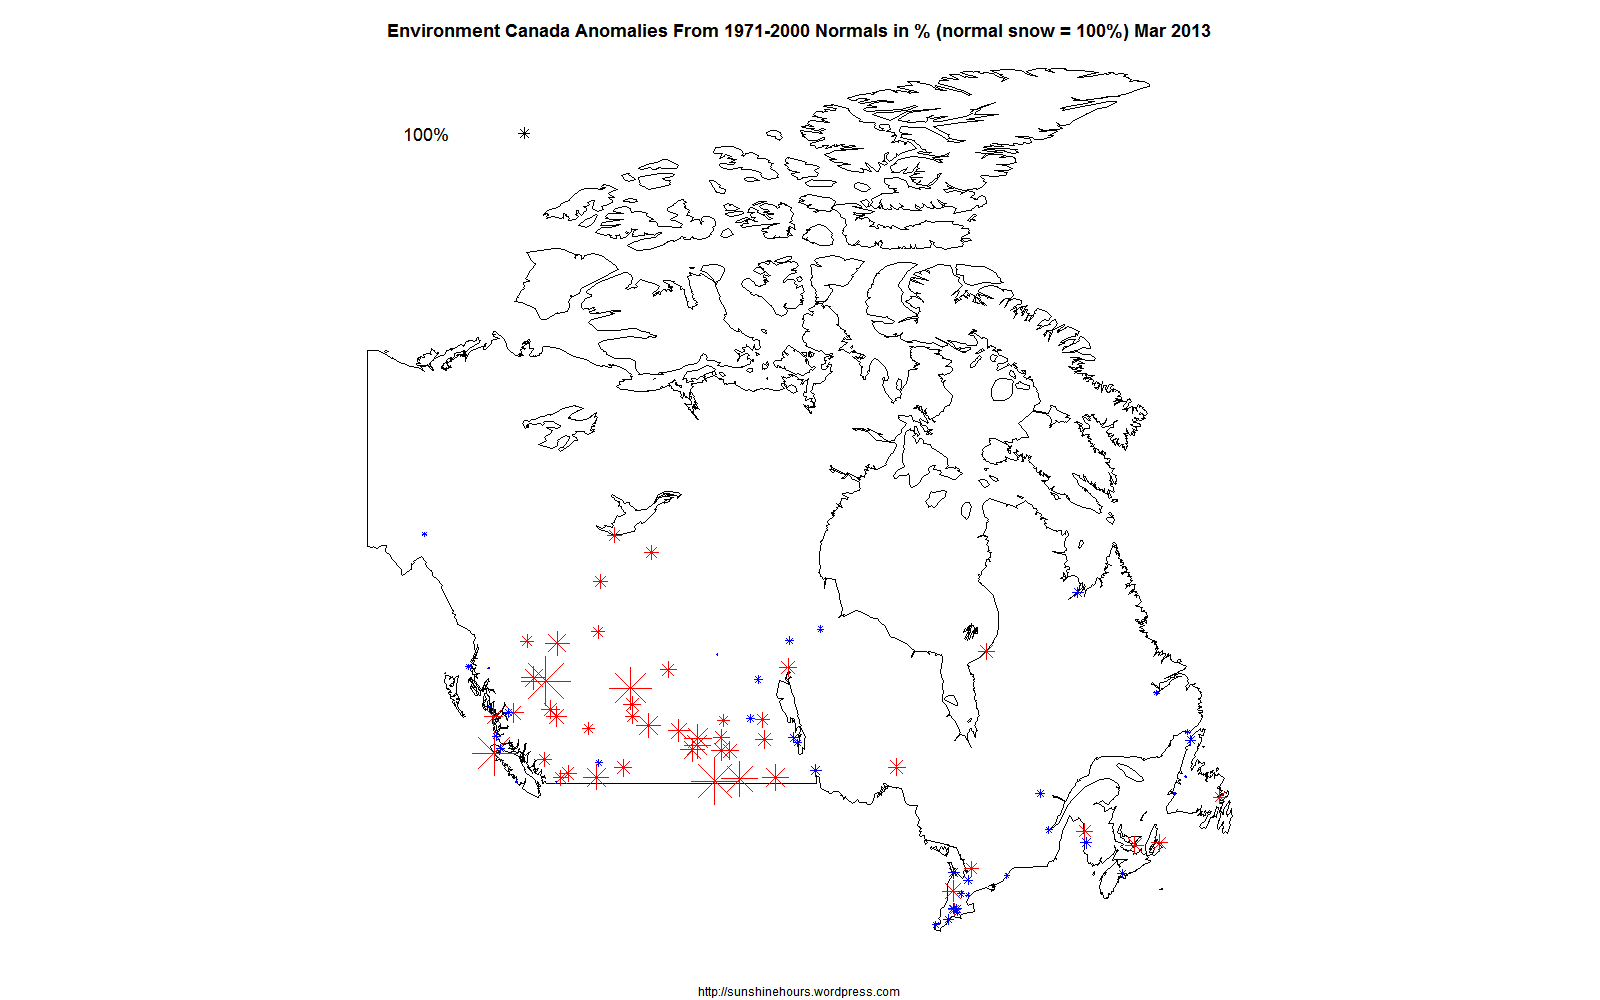
The first map is snowfall anomalies in % of normal from the 1971 – 2000 average calculated by EC. (Not all stations have anomalies)
In the top left corner is a black “snowflake” sized at 100% of normal. Blue is below 100%, red is above 100%
Coronach Sask and Prince George BC had snowfall over 400% of normal (top 25 total snowfall at bottom).
The 2nd map is snowfall in cm.
Click to make bigger.
Top 25 snowfall amounts March 2013.
| Province | Station | Year | Month | Snowfall(cm) | Snowfall % of Normal | Lat | Long |
| SASK | CORONACH | 2013 | 3 | 88.4 | 406 | 49.117 | -105.517 |
| NS | SYDNEY A | 2013 | 3 | 72.8 | 142 | 46.167 | -60.048 |
| NB | AROOSTOOK | 2013 | 3 | 71.3 | 136 | 46.712 | -67.716 |
| ALTA | EDMONTON STONY PLAIN | 2013 | 3 | 68.4 | 367 | 53.548 | -114.108 |
| NFLD | PLUM POINT | 2013 | 3 | 61.5 | 87 | 51.067 | -56.883 |
| PEI | ALLISTON | 2013 | 3 | 57.9 | 155 | 46.067 | -62.6 |
| SASK | ESTEVAN A | 2013 | 3 | 57 | 312 | 49.217 | -102.967 |
| BC | WHISTLER | 2013 | 3 | 56.2 | 124 | 50.129 | -122.955 |
| BC | CHETWYND A | 2013 | 3 | 53.2 | 209 | 55.687 | -121.627 |
| NB | WOODSTOCK | 2013 | 3 | 52.4 | 98 | 46.17 | -67.554 |
| BC | HOPE SLIDE | 2013 | 3 | 50 | 133 | 49.275 | -121.236 |
| ONT | MUSKOKA A | 2013 | 3 | 47.4 | 122 | 44.967 | -79.3 |
| MAN | BALDUR | 2013 | 3 | 46.4 | 223 | 49.276 | -99.292 |
| NFLD | LETHBRIDGE | 2013 | 3 | 46 | 115 | 48.35 | -53.902 |
| ONT | WIARTON A | 2013 | 3 | 44.8 | 97 | 44.746 | -81.107 |
| ONT | WROXETER | 2013 | 3 | 42.6 | 181 | 43.863 | -81.152 |
| BC | PRINCE GEORGE STP | 2013 | 3 | 42.4 | 430 | 53.88 | -122.768 |
| BC | SPARWOOD | 2013 | 3 | 42.1 | 148 | 49.745 | -114.883 |
| ONT | GERALDTON A | 2013 | 3 | 41.4 | 150 | 49.783 | -86.931 |
| ALTA | CRAIGMYLE | 2013 | 3 | 40.5 | 215 | 51.767 | -112.283 |
| SASK | ROCK POINT | 2013 | 3 | 36.8 | 235 | 51.154 | -107.263 |
| QUE | ROBERVAL A | 2013 | 3 | 36 | 75 | 48.517 | -72.267 |
| MAN | GILBERT PLAINS | 2013 | 3 | 35.5 | 151 | 51.1 | -100.467 |
| BC | SPOKIN LAKE 4E | 2013 | 3 | 35.2 | 178 | 52.184 | -121.686 |
| BC | GOLDSTREAM RIVER | 2013 | 3 | 35 | 104 | 51.63 | -118.425 |
Once upon a time, there were over 250 weather stations collecting bright sunshine data in Canada each month.
Alas we are now down to 7 stations. In 3 provinces. And only 5 of the 7 are considered reliable enough or old enough to have “% of Normals” calculated.
March 2013 was pretty sunny in BC (really Vancouver Island / Vancouver) where sunshine was around 115% of normal (the 1971-2000 average).
(I’m not sure why Vancouver has an NA for % of normal as it usually has a value )
I think most of the sunshine arrived the last week of March.
Goose A was pretty gloomy. 61% of normal.
| Province | Station | Year | Month | Bright Sunshine Hours | Bright Sunshine % of Normal |
| BC | VICTORIA INTL A | 2013 | 3 | 160 | 112 |
| BC | COMOX A | 2013 | 3 | 144 | 115 |
| BC | VANCOUVER INTL A | 2013 | 3 | 156 | NA |
| ONT | WIARTON A | 2013 | 3 | 130 | 88 |
| ONT | TORONTO LESTER B. PEARSO | 2013 | 3 | 146 | NA |
| NFLD | CARTWRIGHT | 2013 | 3 | 58 | NA |
| NFLD | GOOSE A | 2013 | 3 | 82 | 61 |
The data is from the monthly summaries put out by Environment Canada.
These are the “Normals” stations (the stations EC calculates anomalies for) with a temperature anomaly colder than -1.0C.
254 stations are part of the Normals. 92 were colder than -1C below the 1970-2001 average. 64 were warmer.
Brrrr.
| Stn Name | Prov | Year | Month | Anomaly |
| ESTEVAN A | SASK | 2013 | 3 | -8.5 |
| KINDERSLEY A | SASK | 2013 | 3 | -7.6 |
| LAST MOUNTAIN CS | SASK | 2013 | 3 | -7.5 |
| OUTLOOK PFRA | SASK | 2013 | 3 | -7.4 |
| REGINA INTL A | SASK | 2013 | 3 | -7.3 |
| ROCANVILLE | SASK | 2013 | 3 | -7.3 |
| LEROY | SASK | 2013 | 3 | -6.9 |
| CORONACH | SASK | 2013 | 3 | -6.9 |
| BEECHY | SASK | 2013 | 3 | -6.8 |
| BROADVIEW | SASK | 2013 | 3 | -6.7 |
| STEWART VALLEY | SASK | 2013 | 3 | -6.7 |
| INDIAN HEAD CDA | SASK | 2013 | 3 | -6.6 |
| MUENSTER | SASK | 2013 | 3 | -6.2 |
| SWIFT CURRENT CDA | SASK | 2013 | 3 | -6.1 |
| GILBERT PLAINS | MAN | 2013 | 3 | -6.1 |
| CRAIGMYLE | ALTA | 2013 | 3 | -6 |
| LANGENBURG | SASK | 2013 | 3 | -6 |
| SCOTT CDA | SASK | 2013 | 3 | -5.8 |
| FORT SIMPSON A | NWT | 2013 | 3 | -5.7 |
| DUVAL | SASK | 2013 | 3 | -5.7 |
| ROCK POINT | SASK | 2013 | 3 | -5.7 |
| PILOT MOUND (AUT) | MAN | 2013 | 3 | -5.7 |
| MCCREARY | MAN | 2013 | 3 | -5.6 |
| KELLIHER | SASK | 2013 | 3 | -5.5 |
| BALDUR | MAN | 2013 | 3 | -5.4 |
| STRATHCLAIR | MAN | 2013 | 3 | -5.4 |
| FORESTBURG PLANT SITE | ALTA | 2013 | 3 | -5.1 |
| VEGREVILLE | ALTA | 2013 | 3 | -5.1 |
| COWAN | MAN | 2013 | 3 | -5.1 |
| ORANGEVILLE MOE | ONT | 2013 | 3 | -5.1 |
| MANKOTA | SASK | 2013 | 3 | -4.9 |
| BUTTE ST PIERRE | SASK | 2013 | 3 | -4.8 |
| LLOYDMINSTER A | ALTA | 2013 | 3 | -4.7 |
| CAMPSIE | ALTA | 2013 | 3 | -4.7 |
| QUAPPELLE 1 | SASK | 2013 | 3 | -4.6 |
| KIPLING | SASK | 2013 | 3 | -4.5 |
| WASAGAMING | MAN | 2013 | 3 | -4.5 |
| PRINCE ALBERT A | SASK | 2013 | 3 | -4.2 |
| MAYO ROAD | YT | 2013 | 3 | -4.1 |
| WASECA | SASK | 2013 | 3 | -4 |
| BARWICK | ONT | 2013 | 3 | -4 |
| QUEENSTOWN | ALTA | 2013 | 3 | -3.9 |
| MARQUETTE | MAN | 2013 | 3 | -3.9 |
| PINAWA WNRE | MAN | 2013 | 3 | -3.7 |
| CAMROSE | ALTA | 2013 | 3 | -3.6 |
| KEY LAKE | SASK | 2013 | 3 | -3.6 |
| EDMONTON WOODBEND | ALTA | 2013 | 3 | -3.5 |
| TOFIELD NORTH | ALTA | 2013 | 3 | -3.4 |
| WHITECOURT A | ALTA | 2013 | 3 | -3.4 |
| ATLIN | BC | 2013 | 3 | -3.3 |
| THE PAS A | MAN | 2013 | 3 | -3.3 |
| RED DEER | ALTA | 2013 | 3 | -3.1 |
| FORT ST JAMES | BC | 2013 | 3 | -3 |
| DAKOTA WEST | ALTA | 2013 | 3 | -3 |
| RED DEER A | ALTA | 2013 | 3 | -3 |
| GRANDE PRAIRIE A | ALTA | 2013 | 3 | -3 |
| PELLY | SASK | 2013 | 3 | -3 |
| STONY MOUNTAIN | MAN | 2013 | 3 | -3 |
| FORT SASKATCHEWAN | ALTA | 2013 | 3 | -2.9 |
| SIMONETTE | ALTA | 2013 | 3 | -2.9 |
| CLAYDON | SASK | 2013 | 3 | -2.9 |
| GRAND RAPIDS HYDRO | MAN | 2013 | 3 | -2.9 |
| PLEASANT CAMP | BC | 2013 | 3 | -2.8 |
| COLD LAKE A | ALTA | 2013 | 3 | -2.8 |
| HODGSON 2 | MAN | 2013 | 3 | -2.8 |
| HIGH LEVEL A | ALTA | 2013 | 3 | -2.7 |
| MACKENZIE A | BC | 2013 | 3 | -2.6 |
| FORT SMITH A | NWT | 2013 | 3 | -2.6 |
| PEACE RIVER A | ALTA | 2013 | 3 | -2.6 |
| RANKIN INLET A | NU | 2013 | 3 | -2.5 |
| FLIN FLON | MAN | 2013 | 3 | -2.5 |
| VANDERHOOF | BC | 2013 | 3 | -2.4 |
| HAY RIVER A | NWT | 2013 | 3 | -2.3 |
| EDMONTON STONY PLAIN | ALTA | 2013 | 3 | -2.3 |
| FABYAN | ALTA | 2013 | 3 | -2.2 |
| TREELON | SASK | 2013 | 3 | -2.2 |
| LA RONGE A | SASK | 2013 | 3 | -2.2 |
| CROSS LAKE JENPEG | MAN | 2013 | 3 | -2.2 |
| KANANASKIS | ALTA | 2013 | 3 | -2 |
| INDIAN BAY | MAN | 2013 | 3 | -2 |
| CHATHAM WPCP | ONT | 2013 | 3 | -2 |
| GERMANSEN LANDING | BC | 2013 | 3 | -1.9 |
| YELLOW GRASS | SASK | 2013 | 3 | -1.7 |
| SMITHERS A | BC | 2013 | 3 | -1.5 |
| PRINCE GEORGE STP | BC | 2013 | 3 | -1.5 |
| ARBORG | MAN | 2013 | 3 | -1.5 |
| THOMPSON A | MAN | 2013 | 3 | -1.5 |
| ST THOMAS WPCP | ONT | 2013 | 3 | -1.5 |
| TABER | ALTA | 2013 | 3 | -1.4 |
| CHETWYND A | BC | 2013 | 3 | -1.3 |
| PUGWASH | NS | 2013 | 3 | -1.3 |
| KANANASKIS POCATERRA | ALTA | 2013 | 3 | -1.1 |
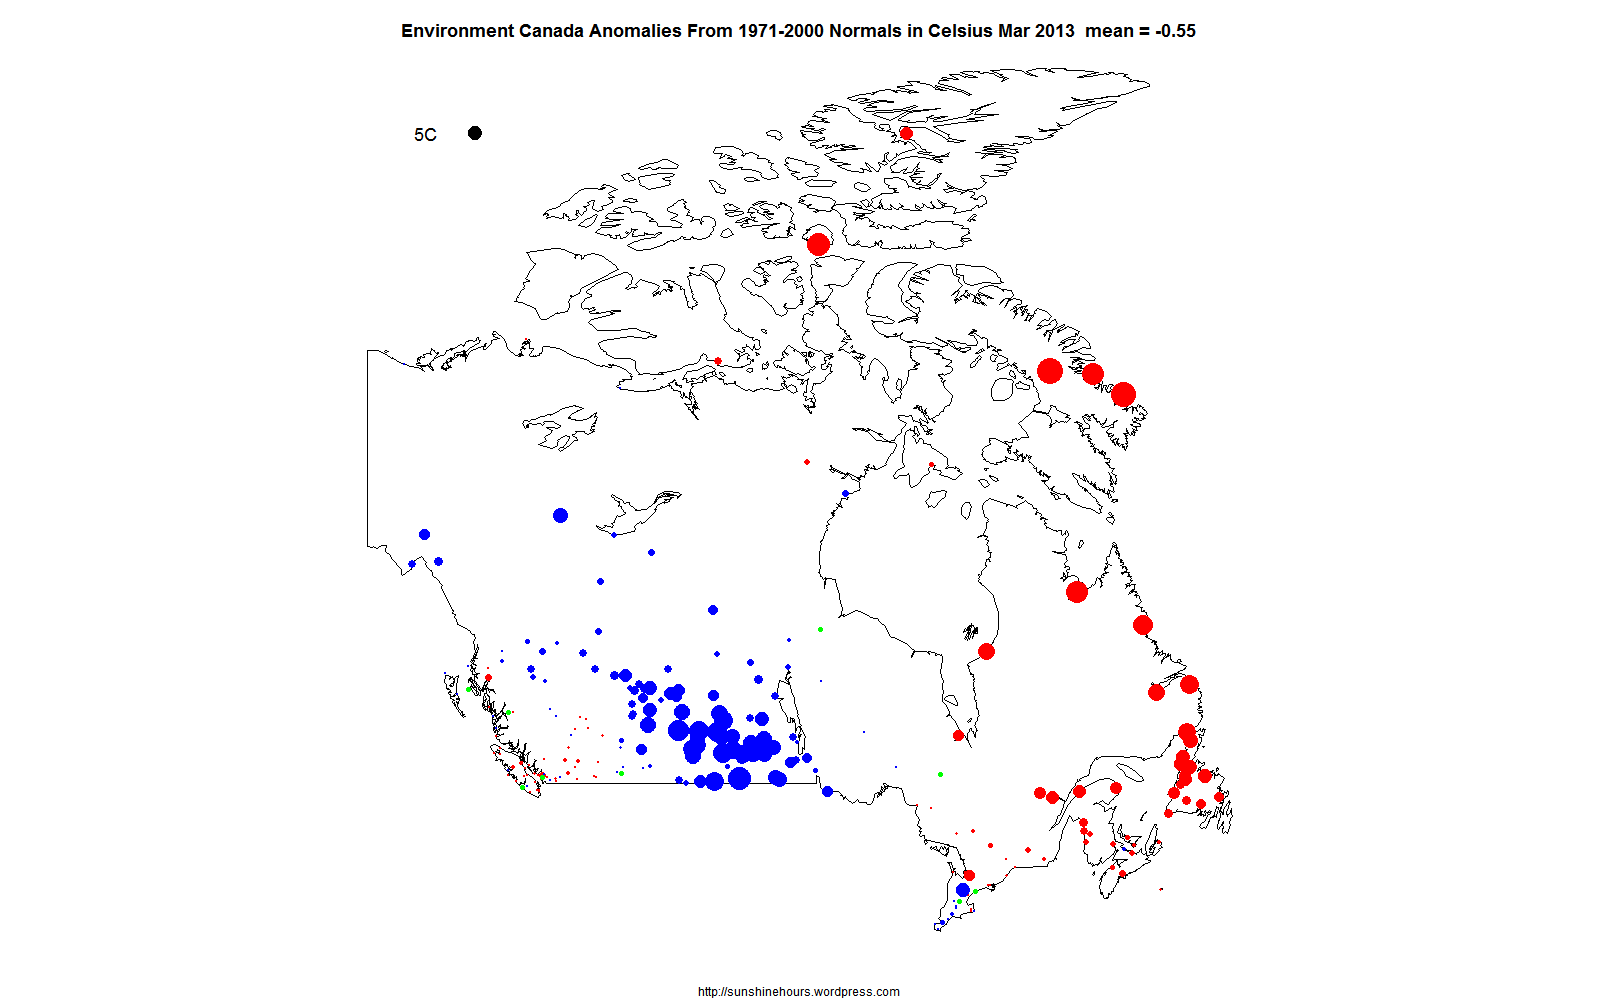
According to the Environment Canada “Normals” (the stations EC calculates anomalies for) , Canada was colder than the 1971-2000 average in March 2013.
The mean of all the “Normals” was -.55C colder than 1971-2000 average.
If you look in the top left corder of the anomaly map and note the black circle represents 5C anomalies. Blue is colder than normal. Red is warmer.
The middle of the country was really, really cold. The warmth was concentrated in the far east and a couple of arctic stations.
And many of the stations had values too small to really show up on the map.
The anomaly map for Mar 2013 follows. Click to make it bigger.
Where do I get the data? From Environment Canada monthly summaries.
The URL for March 2013 BC data is here. You can replace BC with ALL or SASK of MAN etc.
I use the data with a D column value because EC calculates the anomalies for me. And because they are supposed to be better/long stations.
UAH for March 2013 is out.
According to WUWT there are two new products added:
“The two new products are a USA49, which includes Alaska with the lower 48, and a listing for Australia, which includes Tasmania. Both of these new products will include temperature anomaly and trend data going back to the beginning of the UAH dataset in December 1978.”
3rd Coldest March in USA49 history! (Since 1979 anyway)
10 coldest March’s USA49 ranked coldest to 10th coldest
| Year | Mo | USA49 |
| 1980 | 3 | -1.37 |
| 1981 | 3 | -0.93 |
| 2013 | 3 | -0.87 |
| 1984 | 3 | -0.82 |
| 2001 | 3 | -0.8 |
| 1988 | 3 | -0.75 |
| 1983 | 3 | -0.73 |
| 2002 | 3 | -0.73 |
| 2008 | 3 | -0.71 |
| 1996 | 3 | -0.63 |
USA48 has March 2013 as the 6th coldest
| year | Mo | USA48 |
| 1981 | 3 | -1.55 |
| 1980 | 3 | -1.49 |
| 1984 | 3 | -1.31 |
| 1996 | 3 | -1.24 |
| 2002 | 3 | -1.2 |
| 2013 | 3 | -1.00 |
| 1983 | 3 | -0.91 |
| 2001 | 3 | -0.85 |
| 2005 | 3 | -0.81 |
| 1988 | 3 | -0.71 |
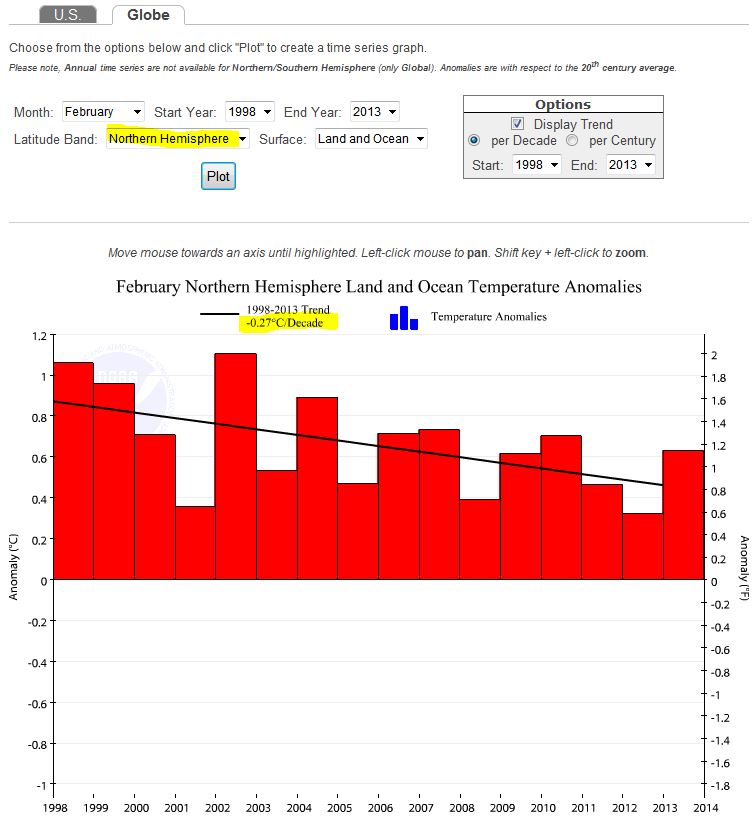
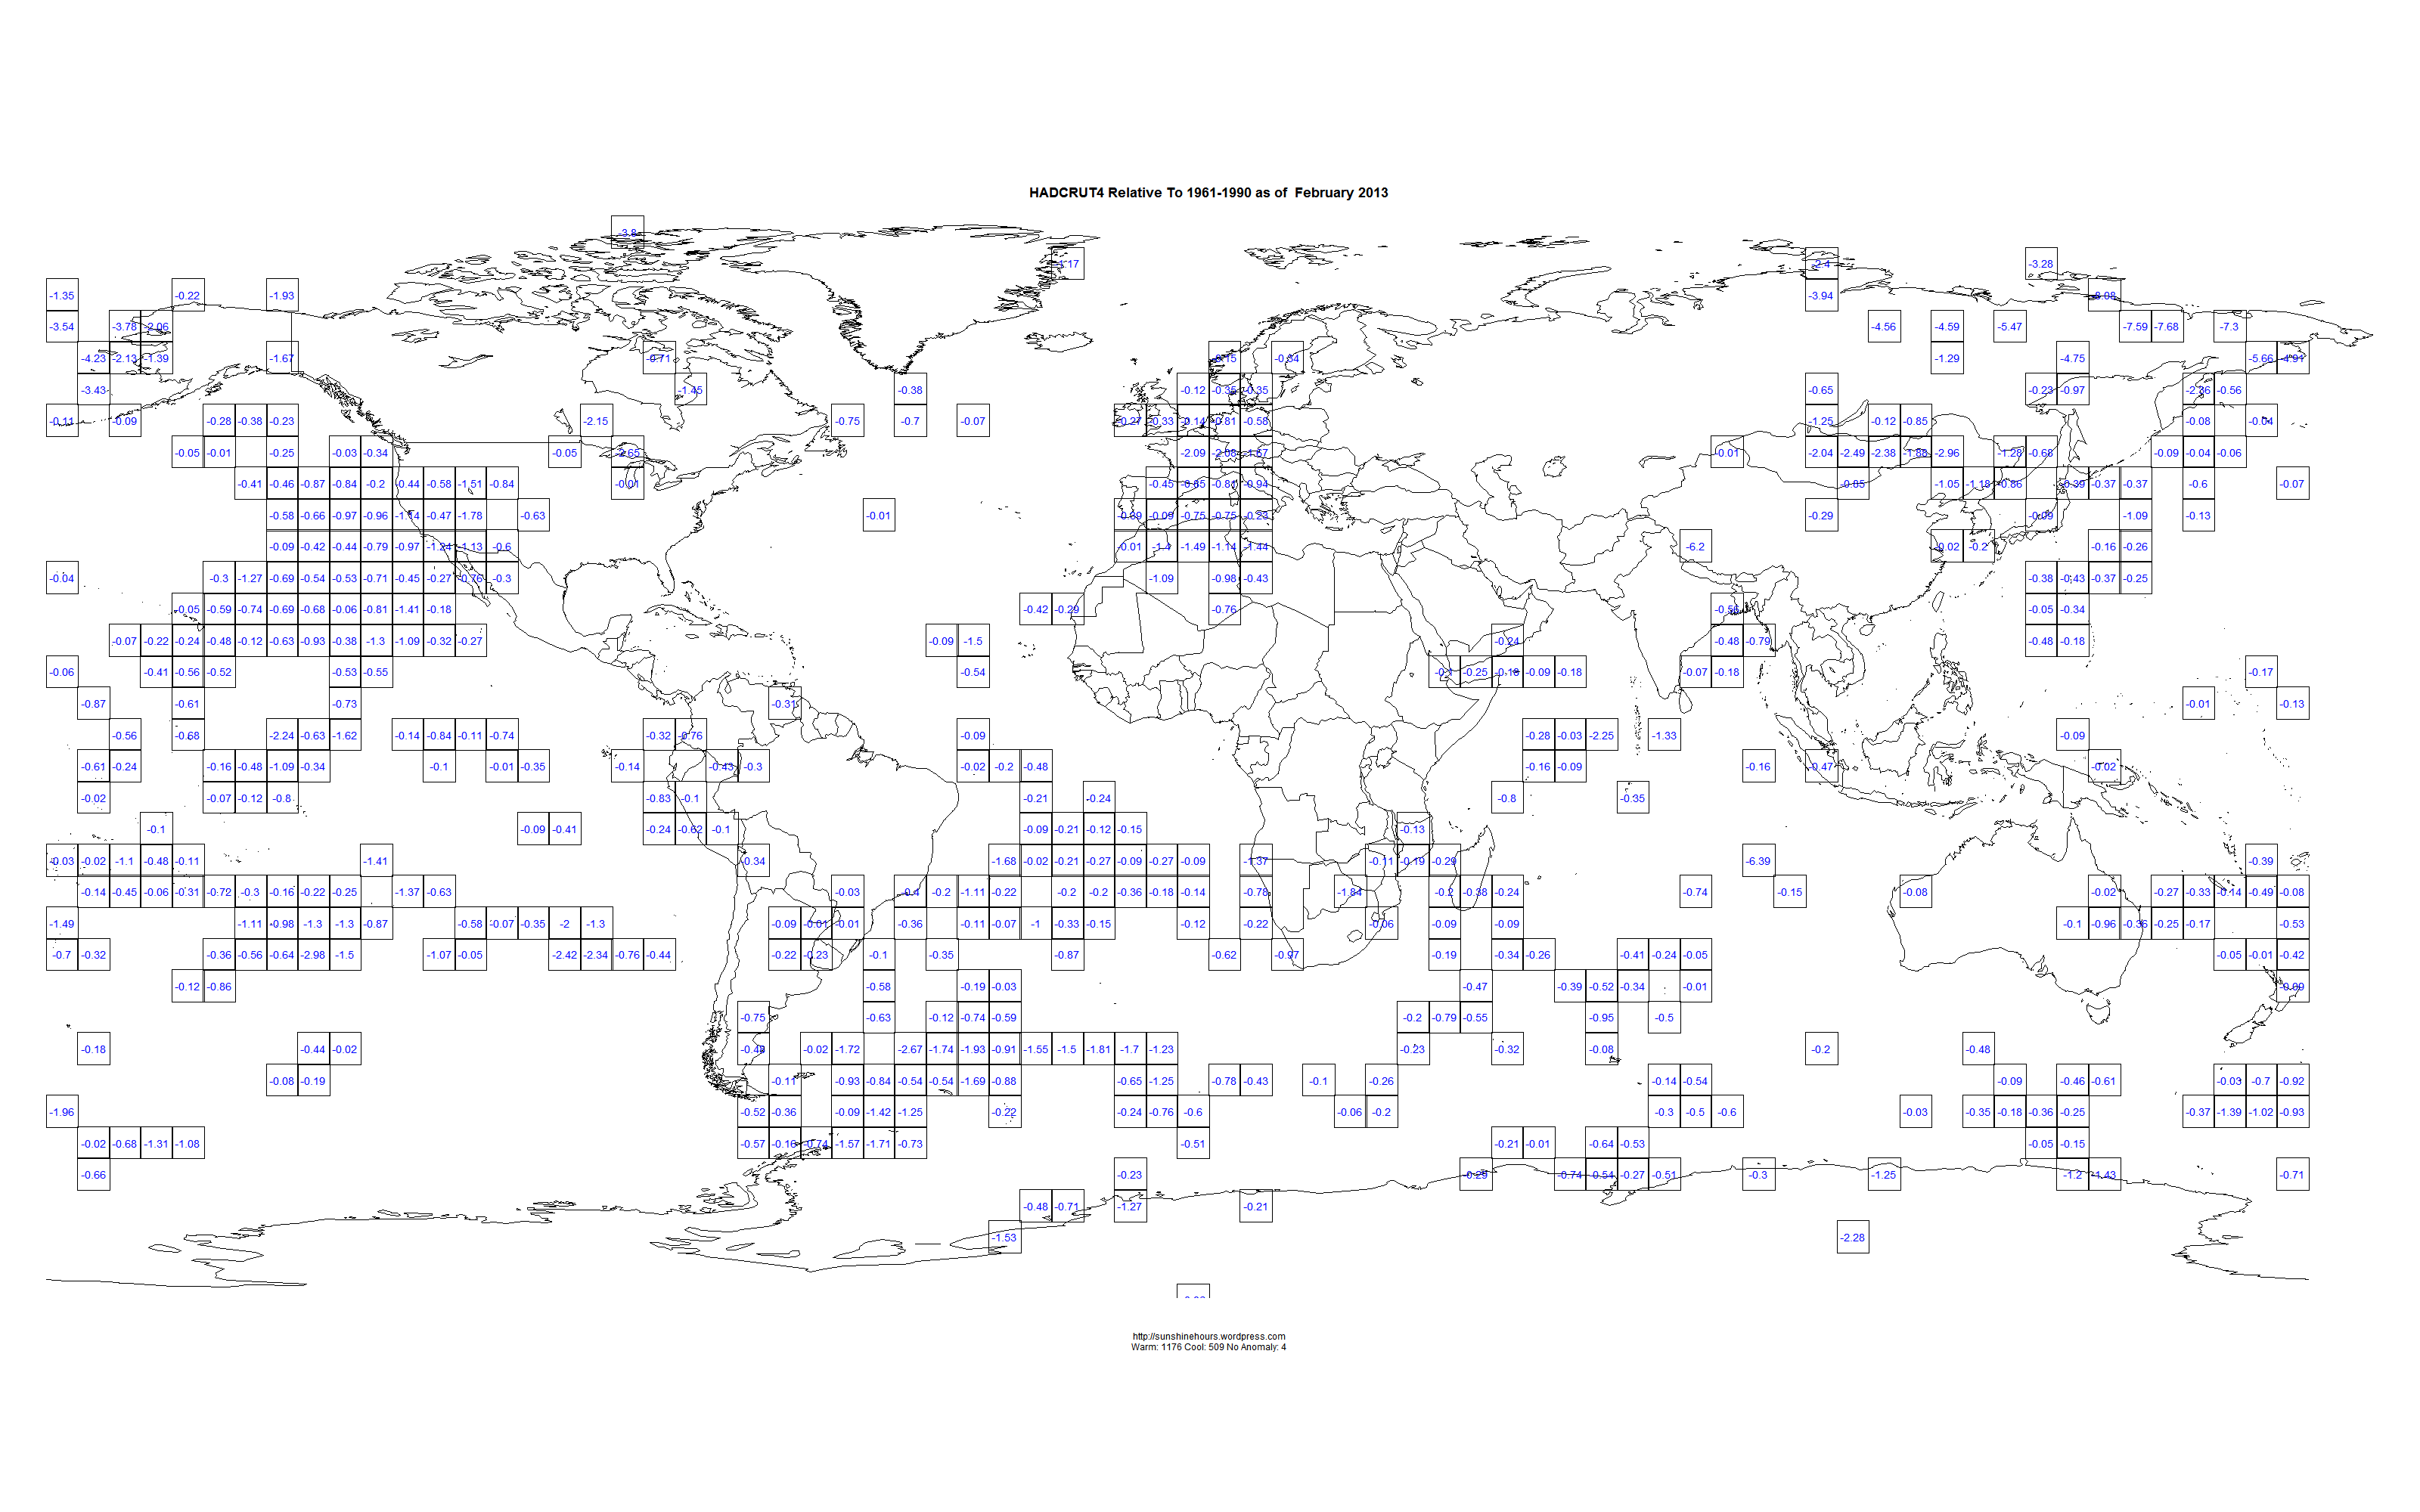
Using HADCRUT4 Gridded data for Feb 2013 , I thought it would be useful to map the 5×5 grid squares colder than 1961-1990.
For some strange reason HADCRUT4 uses the archaic 1961-1990 period as the baseline, rather than the accepted 1981-2010.
Please click on the maps to make them bigger. And make sure you get them to go full size. I made them pretty big (3200 x 2000 pixels).
The number in the boxes is the temperature difference between the 1961-90 average and Feb 2013.
Notice that most of Western Europe was colder than 1961-1990!!!!!!!
Why only the cold squares? Because the HADCRUT4 page colr choices tends to minimize the cold areas. And because I can.
Do you know what the difference is between the 5,000 dead people referenced in this story and all the people killed by global warming?
The UK dead are real. Cold kills.
“Freezing Britain’s unusually harsh winter could have cost thousands of pensioners their lives.
This month is on track to be the coldest March for 50 years – and as the bitter Arctic conditions caused blackouts and traffic chaos yesterday, experts warned of an ‘horrendous’ death toll among the elderly.
About 2,000 extra deaths were registered in just the first two weeks of March compared with the average for the same period over the past five years.
And for February, 3,057 extra deaths were registered in England and Wales compared with the five-year average for the month.”
(h/t Tom Nelson)