According to the NOAA, for Arkansas July 2014 ranked 2nd coldest out of 120 using the Maximum temperature.
It was -5.8F below the 1901-2000 average. Only .1F warmer than 1905.

According to the NOAA, for Arkansas July 2014 ranked 2nd coldest out of 120 using the Maximum temperature.
It was -5.8F below the 1901-2000 average. Only .1F warmer than 1905.
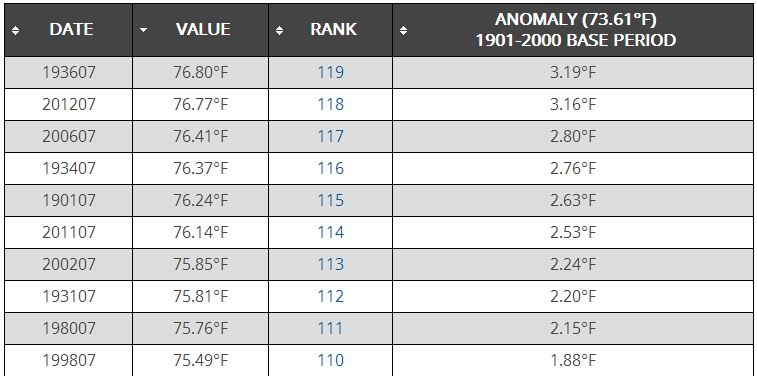
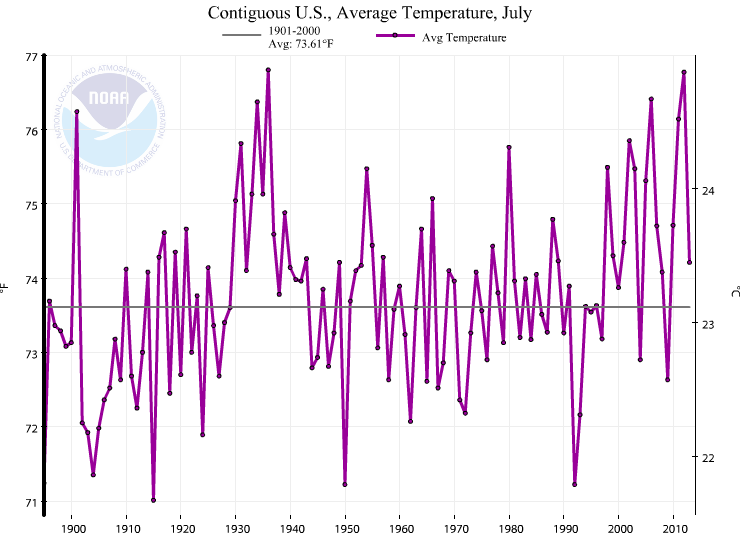
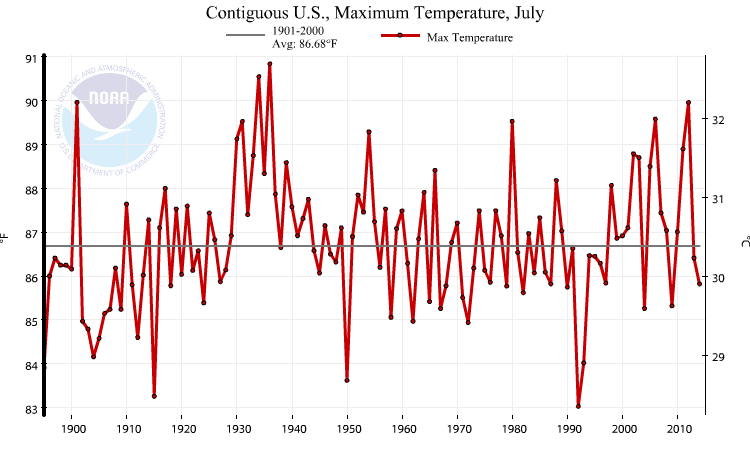
According to the NOAA, July 2014 ranked 29th coldest out of 120 using the Maximum temperature
The list in order of warmest to coldest.
1936,1934,1901,2012,2006,1931,1980,1954,1930,2011,2002,1933,2003,1939,2005,1966,1935,1988,1998,1917,1964
1937,1952,1943,1910,1921,1940,1919,1957,1960,1974,1977,1953,1925,2007,1932,1985,1942,1914,1955,1970,1946
1916,1949,2001,1959,2008,1989,2010,1983,1929,1941,1978,2000,1951,1999,1963,1926,1969,1938,1991,1923,1944
1981,1947,1994,1995,1897,2013,1948,1961,1996,1898,1899,1956,1908,1973,1900,1928,1922,1975,1986,1945,1984
1920,1913,1896,1927,1976,1997,1987,2014,1911,1918,1968,1979,1990,1982,1971,1965,1924,2009,1967,2004
1907,1909,1906,1958,1902,1962,1972,1903,1912,1905,1904,1993,1895,1950,1915,1992
The scary thing is … 2009 and 2004 were colder than 2014.
UPDATE: Antarctic and Arctic has been published. MASIE is still one day behind.
There have been no updates to NSIDC/NOAA Antarctic Sea Ice Extent for three days. Arctic Data is late for today. And MASIE did update their data, but it is one day older than it should be.
Data is usually found here and here and here.
28,504 Low Max Records were set in last 365 days according to the NOAA.
A “Low Max” means that the maximum temperatures for the day was the lowest it has ever been.
This indicates daytime cooling.
Only 13205 High Max records were set. That is over a 2:1 ratio. Brrr.

(h/t IceAgeNow)
According to the NOAA the first 5 months (Jan-May) 2014 was ranked 56th out of 120 (120 = warmest) .
The cooling trend for Jan-May dates back to 1990. 2012 was the hot aberration.

These are the anomalies from the Jan-May average. It has been a cold start to the year for the East while warmer in the south west.
![cag_[ Statewide Avg Temp Anomalies (average between Jan 2014 and May 2014) ]](https://sunshinehours.net/wp-content/uploads/2014/06/cag_-statewide-avg-temp-anomalies-average-between-jan-2014-and-may-2014.jpg)
The White House admitted yesterday that warmer weather is better for the US GDP. (A very slight exaggeration on my part)
“3. The first quarter of 2014 was marked by unusually severe winter weather, including record cold temperatures and snowstorms, which explains part of the difference in GDP growth relative to previous quarters. The left chart shows the quarterly deviation in heating degree days from its average for the same quarter over the previous five years. By this measure, the first quarter of 2014 was the third most unusually cold quarter over the last sixty years, behind only the first quarter of 1978 and the fourth quarter of 1976. “
There is some question whether there numbers are correct as this blog post discusses.
The NOAA suggests Q1 had the 9th lowest heating degree days (not the asserted 3rd)

But I think we can all agree that if more “Heating Degree Days” is bad for the GDP as the White House assets, then fewer “Heating Degree Days” would be better for the economy.
And therefore “Global Warming” is better for the US GDP.
We certainly don’t want to damage the economy by returning to the late 1970’s when “Heating Degree Days” went through the roof! That would be a disaster for the US economy.
Hurrah!